This is the multi-page printable view of this section. Click here to print.
Containers
- 1: Setup
- 2: Java Monitoring Tooling
- 3: Docker Tooling
- 4: References
- 5: Hello World Example
1 - Setup
In this section we’re going to spin up the containers needed for the workshop.
- Make sure you’ve gone through the Prerequisites.
- Make sure your Docker daemon is running.
- If this is the first time you’re using docker, we recommend going through Orientation and Setup to quickly learn a few concepts.
Building
The maven project uses the fabric8.io/docker-maven-plugin to create two images:
workshop-server- the docker image for the workshop serviceworkshop-wiremock- the docker image for the wiremock service
Run mvn clean package -Pdocker , the docker profile enables the docker-maven-plugin.
You can view the generated images with docker image ls | grep workshop:
$ docker image ls | grep workshop
workshop-wiremock                                                             2.0-SNAPSHOT                 2cc43b2348c8   2 minutes ago   657MB
workshop-wiremock                                                             latest                         2cc43b2348c8   2 minutes ago   657MB
workshop-server                                                               2.0-SNAPSHOT                 be7cfbd0735a   2 minutes ago   659MB
workshop-server                                                               latest                         be7cfbd0735a   2 minutes ago   659MB
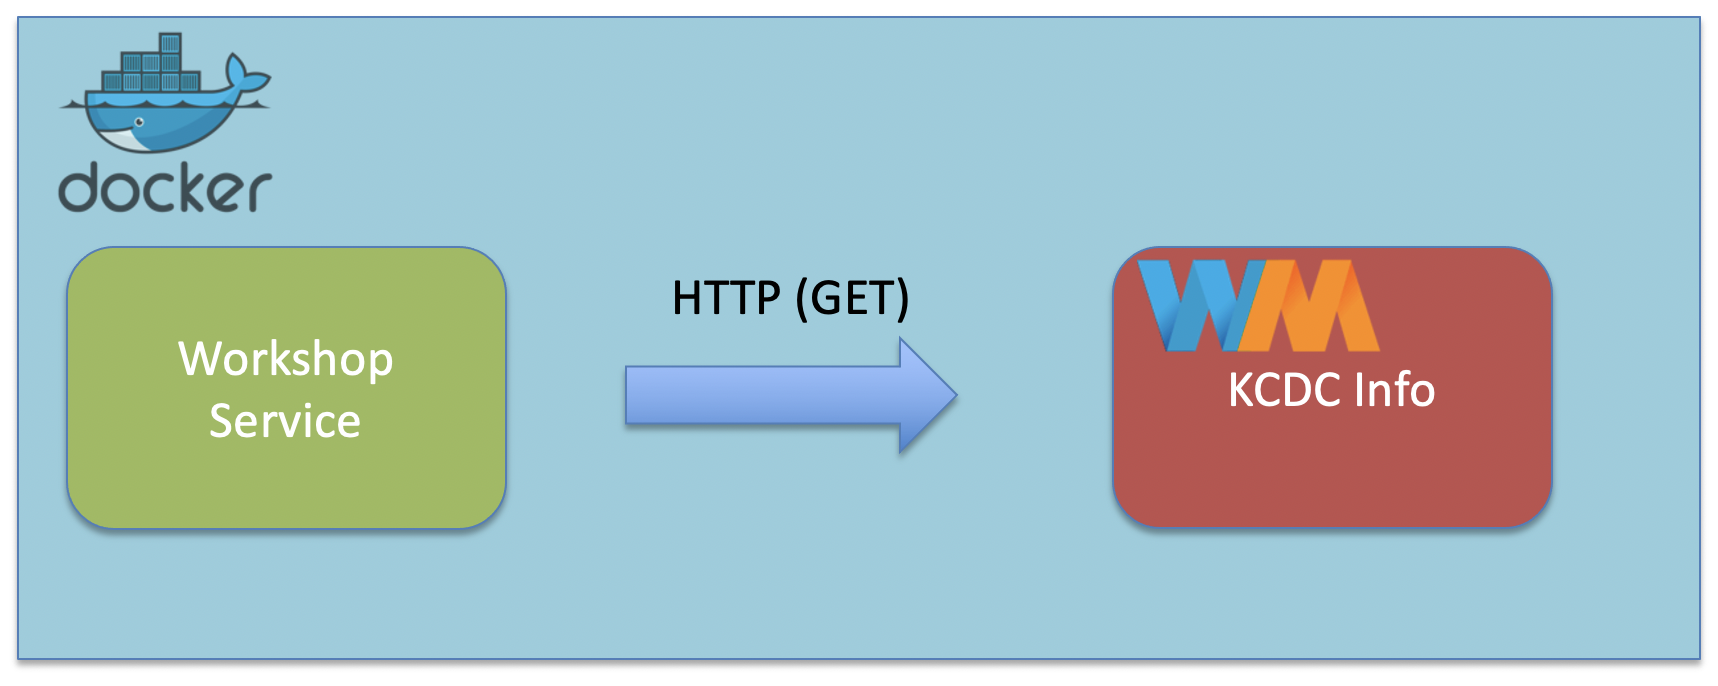
Running
Since our Workshop Service depends on the Wiremock Service, we’re going to use docker-compose to create a docker environment with both our services ready to go:
Within the java-perf-workshop directory, run docker-compose up:
$ docker-compose up
Creating network "java-perf-workshop_default" with the default driver
Creating java-perf-workshop_wiremock_1 ... done
Creating java-perf-workshop_server_1   ... done
Attaching to java-perf-workshop_wiremock_1, java-perf-workshop_server_1
...
wiremock_1  | port:                         8080
wiremock_1  | enable-browser-proxying:      false
wiremock_1  | disable-banner:               false
wiremock_1  | no-request-journal:           false
wiremock_1  | verbose:                      false
wiremock_1  |
...
server_1    | INFO  [2021-03-14 18:59:06,883] org.eclipse.jetty.server.AbstractConnector: Started application@4c777e7b{HTTP/1.1,[http/1.1]}{0.0.0.0:8080}
server_1    | INFO  [2021-03-14 18:59:06,892] org.eclipse.jetty.server.AbstractConnector: Started admin@5f038248{HTTP/1.1,[http/1.1]}{0.0.0.0:8081}
server_1    | INFO  [2021-03-14 18:59:06,892] org.eclipse.jetty.server.Server: Started @4358ms
In another terminal, you can check the status of the containers by running docker ps:
$ docker ps
CONTAINER ID   IMAGE                      COMMAND                  CREATED          STATUS          PORTS                              NAMES
c9aeb5375f79   workshop-server:latest     "/bin/sh -c 'java -j…"   52 seconds ago   Up 50 seconds   0.0.0.0:8080-8081->8080-8081/tcp   java-perf-workshop_server_1
6b1522e7acb9   workshop-wiremock:latest   "/bin/sh -c 'java -j…"   52 seconds ago   Up 51 seconds                                      java-perf-workshop_wiremock_1
Our workshop service container is exposing port 8080 and mapping it into the container’s 8080. Verify that your setup is working by visiting: http://localhost:8080/search?q=docker.
In the next section, we'll learn how to enable Java Monitoring Tooling to work with containers.
Java Monitoring Tooling2 - Java Monitoring Tooling
In this section we’re going to configure our container to enable remote tooling.
- Make sure you’ve gone through the Prerequisites.
- Make sure your Docker daemon is running.
- If this is the first time you’re using docker, we recommend going through Orientation and Setup to quickly learn a few concepts.
Remote Monitoring
In previous sections of the workshop, we ran all our tooling without any configuration. In previous versions of Java you would have had to configure things even for local monitoring, this is no longer the case with Java 6+:
Any application that is started on the Java SE 6 platform will support the Attach API, and so will automatically be made available for local monitoring and management when needed.
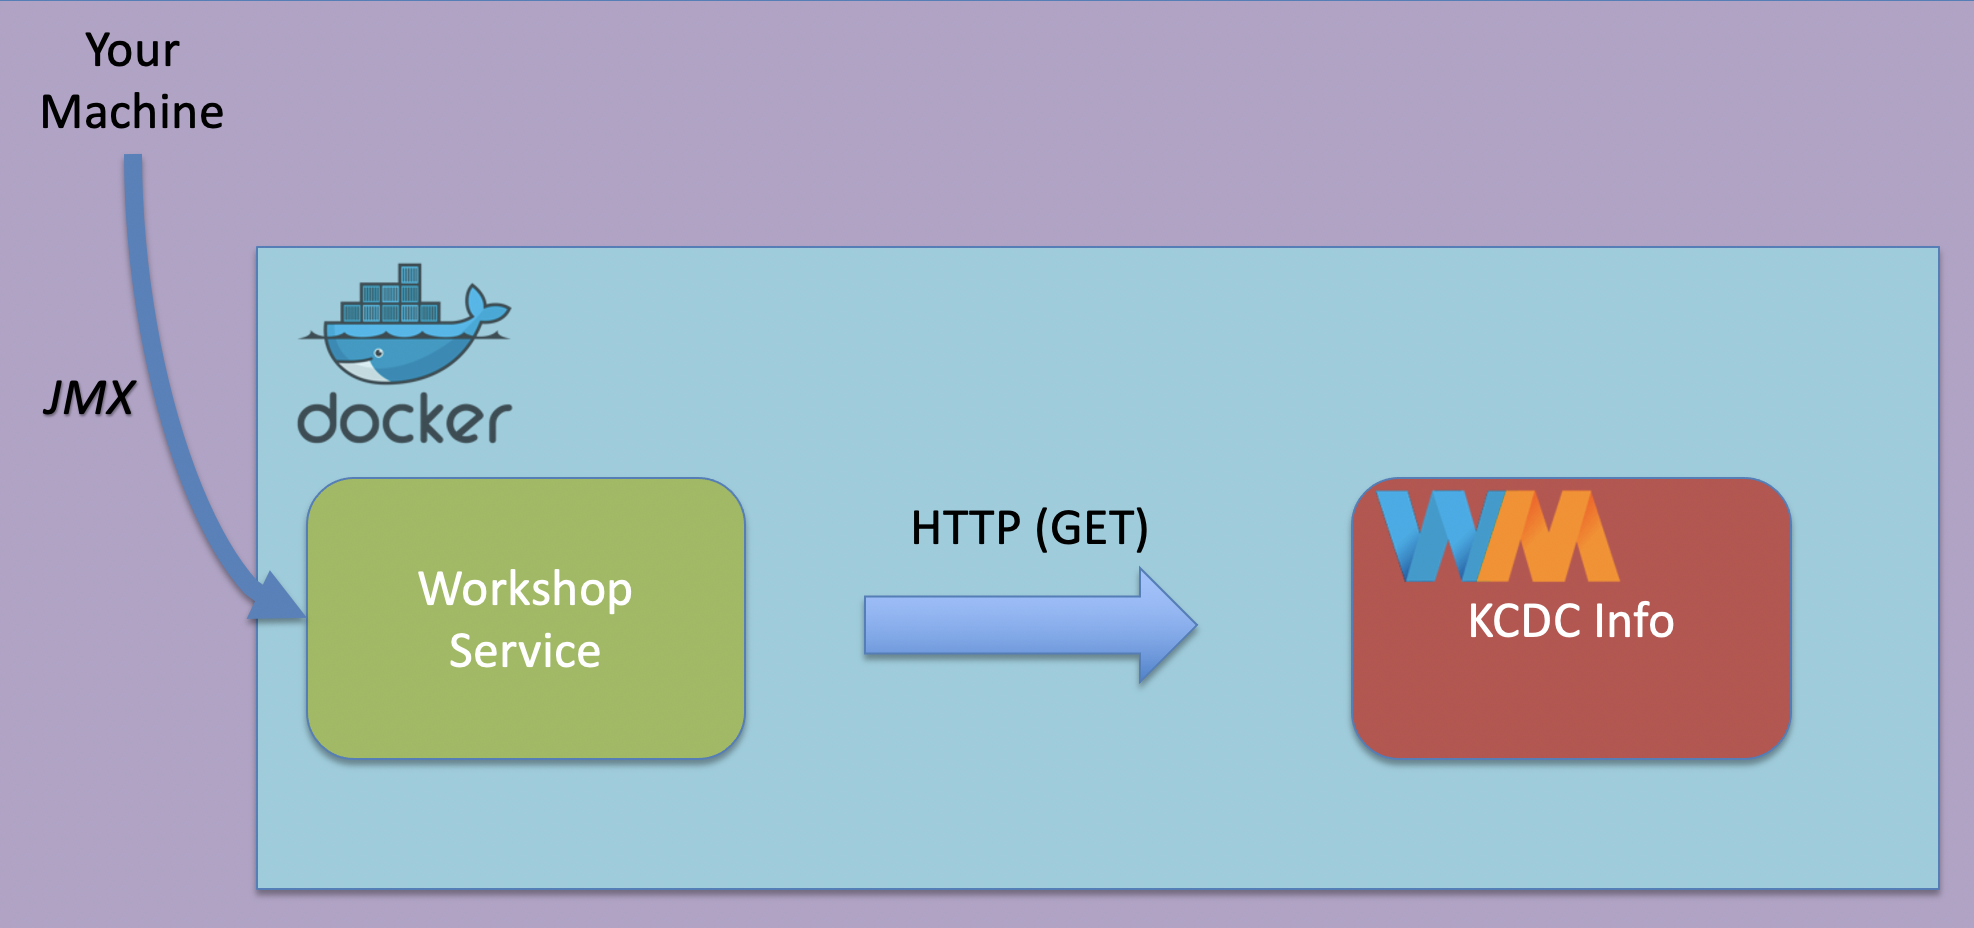
Since the docker-compose network and containers are ran separate from our host (consider them a different machine), we need to enable remote monitoring and management.
Properties
We’ll set the following properties as a JAVA_OPTS environment variable when we start our workshop server container:
- The
JMX remote portto8082:-Dcom.sun.management.jmxremote.port=8082 - The RMI registry port also set to
8082:-Dcom.sun.management.jmxremote.rmi.port=8082 - Disabling for both the registry and jmx:
-Dcom.sun.management.jmxremote.registry.ssl=falseand-Dcom.sun.management.jmxremote.ssl=false - Accept connections not from localhost:
-Dcom.sun.management.jmxremote.local.only=false- Since the machine we are connecting from will not be in the container network, we need to allow non localhost connections.
- The host name for the RMI server will be set to
127.0.0.1. The default value for this will be the container’s IP address, which we are overriding.
Set these values as an environment property on your workshop container:
...
  server:
    image: workshop-server:latest
    environment:
      JAVA_OPTS: "
        -Dcom.sun.management.jmxremote.port=8082
        -Dcom.sun.management.jmxremote.rmi.port=8082
        -Dcom.sun.management.jmxremote.registry.ssl=false
        -Dcom.sun.management.jmxremote.authenticate=false
        -Dcom.sun.management.jmxremote.ssl=false
        -Dcom.sun.management.jmxremote.local.only=false
        -Djava.rmi.server.hostname=127.0.0.1
      "
...
Test Our Setup
Spin up your services again with docker-compose up. Once the services are started, use docker ps to check the open ports on the workshop server. Notice that 8082 is now mapped as well.
$ docker ps
CONTAINER ID   IMAGE                      COMMAND                  CREATED          STATUS          PORTS                              NAMES
44d4a1ebedef   workshop-server:latest     "/bin/sh -c 'java $J…"   39 seconds ago   Up 37 seconds   0.0.0.0:8080-8082->8080-8082/tcp   java-perf-workshop_server_1
JDK Mission Control
We’ll use JDK Mission Control to create a JMX Connection.
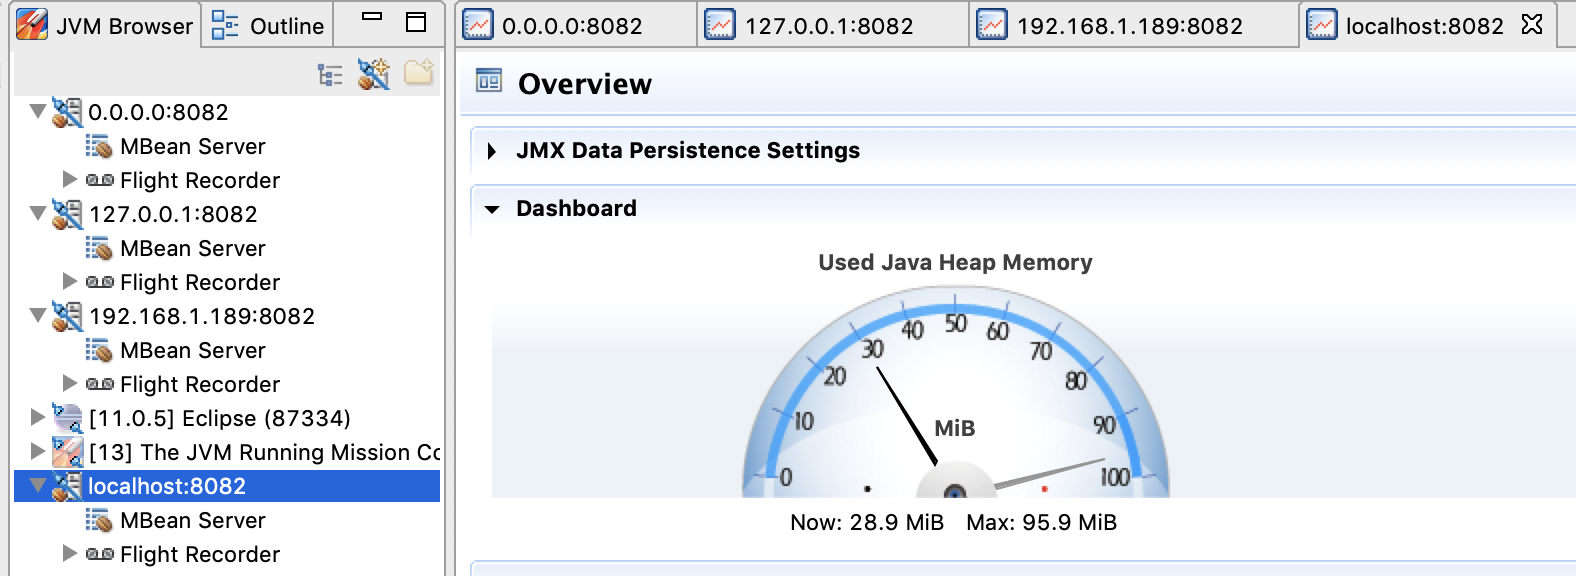
Open JDK Mission Control. Notice that the JVM Browser no longer shows the two services (since they no longer are running on the local host):
![]()
Create a new JMX Connection using 0.0.0.0 and 8082 as the host and port:
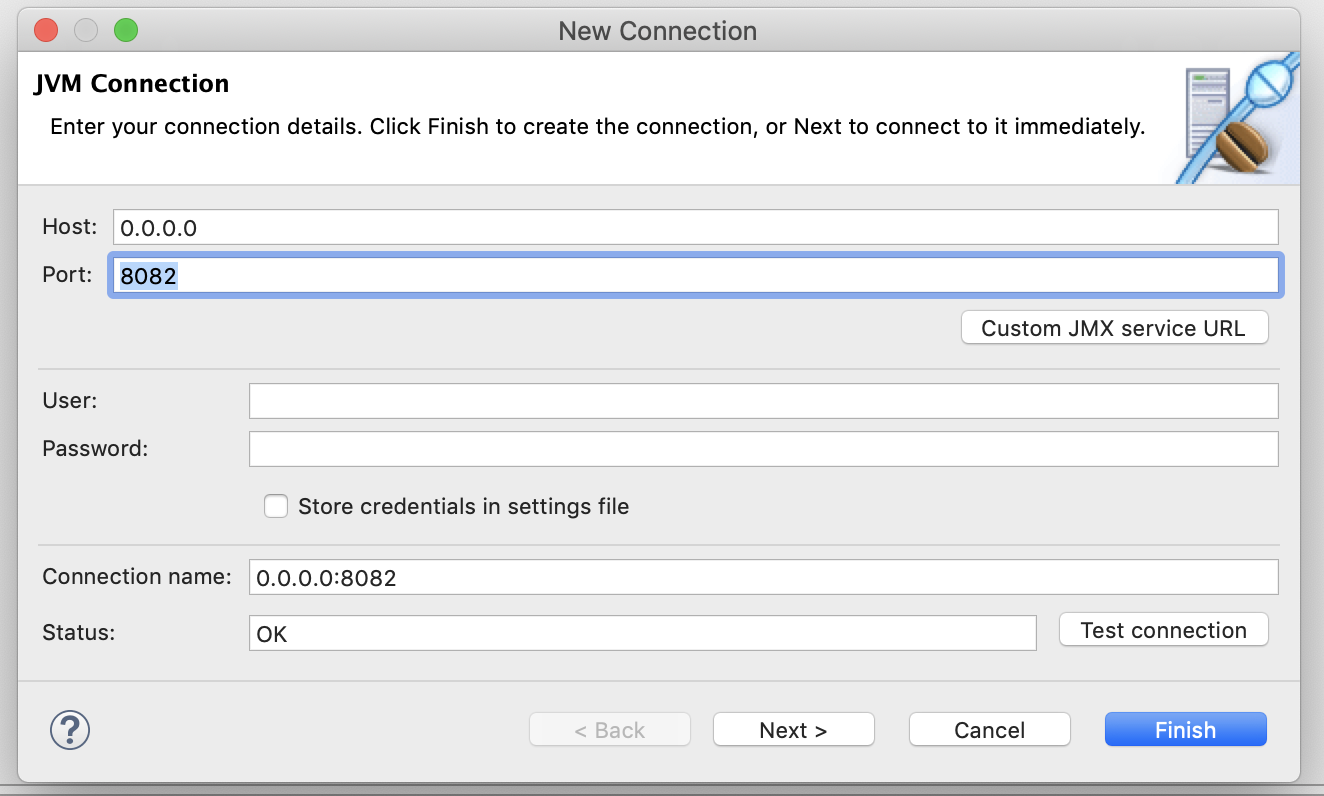
With our setup, we can connect with other addresses as well:
127.0.0.1localhost(since we are exposing port 8082 on the container as port 8082 on the local host)- Our wifi/ethernet IP address, which you can find under the
en0interface usingifconfig/ipconfig:$ ifconfig ... en0: flags=8863<UP,BROADCAST,SMART,RUNNING,SIMPLEX,MULTICAST> mtu 1500 ether 8c:85:90:ba:52:10 inet6 fe80::1862:95fe:55e7:284e%en0 prefixlen 64 secured scopeid 0x9 inet 192.168.1.189 netmask 0xffffff00 broadcast 192.168.1.255 ...
In the next section, we'll learn about some Docker tooling.
Docker Tooling3 - Docker Tooling
In the next section, X
References4 - References
5 - Hello World Example
Here is a tiny Java HTTP service used by the JVM memory in Kubernetes slides. The demo is intentionally small so the commands focus on the container, cgroup, heap, and native-memory signals rather than application code.
- HelloWorld.java: Simple single Java file that is a HTTP server
- Dockerfile: Dockerfile for the application
- k8s-deployment.yaml: Kubernetes deployment manifest
The Kubernetes manifest enables a few JVM diagnostics through
JAVA_TOOL_OPTIONS:
env:
- name: JAVA_TOOL_OPTIONS
  value: >
    -Xlog:os+container=debug
    -XX:NativeMemoryTracking=summary
    -XX:+UseG1GC
    -XX:+FlightRecorder
    -XX:StartFlightRecording=filename=/tmp/startup.jfr,dumponexit=true
It also exposes JMX on port 9091 for JDK Mission Control.
Build the Image
Run these commands from this directory:
docker build -t jvmperf.net/java-hello-world:v1 .
If you are using a local Kubernetes runtime such as minikube, kind, or Docker Desktop, make sure the image is available to that cluster before deploying.
Deploy to Kubernetes
Apply the deployment and service:
kubectl apply -f k8s-deployment.yaml
Wait for the pod to become ready:
kubectl rollout status deployment/java-hello-world
kubectl get pods -l app=java-hello-world
For the commands below, capture the pod name once:
POD=$(kubectl get pod -l app=java-hello-world -o jsonpath='{.items[0].metadata.name}')
echo "$POD"
Verify the App
The service is a NodePort, so Kubernetes assigns a local node port for the
HTTP endpoint:
kubectl get svc java-hello-world-service
Use the returned NODE-PORT value with localhost:
NODE_PORT=$(kubectl get svc java-hello-world-service -o jsonpath='{.spec.ports[0].nodePort}')
curl "http://localhost:${NODE_PORT}/"
Expected response:
Hello, World from Kubernetes!
Check the JVM’s Container View
Start with -XshowSettings:system. This is the quick check that the JVM sees the
pod’s cgroup limits rather than sizing itself from the whole node:
kubectl exec "$POD" -- java -XshowSettings:system -version
Look for output shaped like this:
Operating System Metrics:
    Provider: cgroupv2
    Effective CPU Count: 1
    CPU Quota: 100000us
    CPU Period: 100000us
    Memory Limit: 1.00G
    Memory & Swap Limit: 1.00G
The important fields for the slides are:
| Field | Why it matters |
|---|---|
Provider |
Shows whether the JVM is reading cgroup data. |
Effective CPU Count |
Influences GC threads, JIT threads, and app parallelism. |
Memory Limit |
The process budget for heap plus native memory. |
CPU Quota / CPU Period |
Should line up with the deployment CPU limit. |
Inspect Native Memory
Native Memory Tracking is enabled in the manifest with
-XX:NativeMemoryTracking=summary, so you can ask the running JVM for its native
memory map:
kubectl exec "$POD" -- jcmd 1 VM.native_memory summary
The top of the output gives total reserved and committed memory:
Native Memory Tracking:

Total: reserved=1677076KB, committed=43616KB
       malloc: 3328KB #7179, peak=3201KB #7181
       mmap:   reserved=1673748KB, committed=40288KB
Then NMT breaks memory into JVM categories:
- Java Heap (reserved=262144KB, committed=16384KB)
- Class     (reserved=1048664KB, committed=280KB)
- Thread    (reserved=30653KB, committed=1141KB)
- Code      (reserved=249735KB, committed=7735KB)
- GC        (reserved=860KB, committed=64KB)
Use this breakdown to explain where memory outside the Java heap can come from: thread stacks, class metadata, code cache, GC structures, direct buffers, native libraries, and JVM internals.
Compare Heap and NMT
GC.heap_info explains the Java heap from the collector’s point of view:
kubectl exec "$POD" -- jcmd 1 GC.heap_info
Example:
garbage-first heap total reserved 262144K, committed 18432K, used 2925K
For the Java heap, reserved and committed should line up with the
Java Heap row in NMT. heap_info adds used, which is the live heap occupancy
inside the committed heap space.
Inspect VM and Cgroup Details
VM.info gives a broader diagnostic snapshot, including the JVM’s cgroup view:
kubectl exec "$POD" -- jcmd 1 VM.info
Useful segment:
container (cgroup) information:
container_type: cgroupv2
active_processor_count: 1
cpu_quota: 100000
cpu_period: 100000
memory_limit_in_bytes: 1048576 k
memory_and_swap_limit_in_bytes: 1048576 k
memory_usage_in_bytes: 118316 k
rss_usage_in_bytes: 116428 k
cache_usage_in_bytes: 64 k
current number of tasks: 29
Capture this beside the pod spec, heap settings, and NMT output when you want to explain why a container is close to its limit.
Record Heap Behavior with JFR
Java Flight Recorder is useful during load tests because it keeps the heap story tied to time. Use it to see heap usage, allocation pressure, and GC behavior across the same window where you are collecting NMT and cgroup data.
The manifest starts a recording automatically:
-XX:+FlightRecorder
-XX:StartFlightRecording=filename=/tmp/startup.jfr,dumponexit=true
For a specific test window, start and stop a named recording with jcmd:
kubectl exec "$POD" -- jcmd 1 JFR.start name=load-test filename=/tmp/load-test.jfr settings=profile
# run representative load
kubectl exec "$POD" -- jcmd 1 JFR.dump name=load-test filename=/tmp/load-test.jfr
kubectl exec "$POD" -- jcmd 1 JFR.stop name=load-test
Copy the recording locally:
kubectl cp "${POD}:/tmp/load-test.jfr" ./load-test.jfr
Open load-test.jfr in JDK Mission Control. For heap-focused analysis, start
with heap usage, allocation, GC pause, and GC heap summary views.
Use JDK Mission Control
The manifest opens JMX on container port 9091. Port-forward it to your machine:
kubectl port-forward "$POD" 9091:9091
Then connect JDK Mission Control to:
localhost:9091
This is useful when you want to show the memory story over time rather than only single command snapshots.
Cleanup
Remove the demo resources when you are done:
kubectl delete -f k8s-deployment.yaml
References
java.lang.management.OperatingSystemMXBean: https://docs.oracle.com/en/java/javase/11/docs/api/java.management/java/lang/management/OperatingSystemMXBean.htmlcom.sun.management.OperatingSystemMXBean: https://docs.oracle.com/en/java/javase/25/docs/api/jdk.management/com/sun/management/OperatingSystemMXBean.html- Native Memory Tracking: https://docs.oracle.com/en/java/javase/11/vm/native-memory-tracking.html