In this workshop, we will be getting more familiar with using JDK Mission Control and the Flight Recorder. As we have been running our service, we want to gather more insight of the code in the service by running series of simple tests and measuring the service.
This is the multi-page printable view of this section. Click here to print.
JDK Mission Control & Flight Recorder
Initial look at the JVM from its native perspective.
- 1: Introduction
- 2: Method Profiling
- 3: Exceptions
- 4: Threads
- 5: Memory
- 6: I/O Operations
- 7: References
1 - Introduction
Introduction into JDK Mission Control with Flight Recorder
JDK Flight Recorder
The JDK Flight Recorder (JFR) is a very low overhead profiling and diagnostics tool. It was inherited from the JRockit JVM, and originally was offered as part of the HotSpot JVM. It is designed to be “black box” data recorder of the the run-time, which can be used in production environments, making it an attractive tool for profiling code since it has low overhead on the JVM. In 2018, it was open-sourced and released as part of OpenJDK.
JFR is enabled by default in Java 11 and later. In previous versions, it required enabling with JVM options (ex. -XX:+FlightRecorder)
Higher Fidelity on Method Profiling
To get better fidelity on method profiling, include the following options which will enable the compiler to include additional metadata on non-safe code points. This is helpful, as sometimes the metadata will not fully resolve to the correct line in the code.
-XX:+UnlockDiagnosticVMOptions -XX:+DebugNonSafepoints
JDK Mission Control
We will be using JDK Mission Control to monitor and evaluate the Java flight recordings. To utilizes JDK Mission Control, you will need to download the build. To start up JDK Mission Control, simply executing the following in your console:
jmc
💡 In order to be able to invoke jmc (JDK Mission Control) from your console, it assumes $JAVA_HOME/bin is on your $PATH. If it is not included, go ahead and update your profile to include this so you can easily invoke jmc from your terminal. Also, JMC 9.1 requires JDK 21.
Start Service with JFR
Let’s start profiling our service. Start the service up by enabling JFR:
Start from the console
# Note, if you are running this server from a different folder, consider changing the SERVER_HOME
SERVER_HOME=java-perf-workshop-server/target
java -XX:+UnlockDiagnosticVMOptions -XX:+DebugNonSafepoints -jar $SERVER_HOME/java-perf-workshop-server-1.1.0-SNAPSHOT.jar server server.yml
Start Flight Recording from JMC
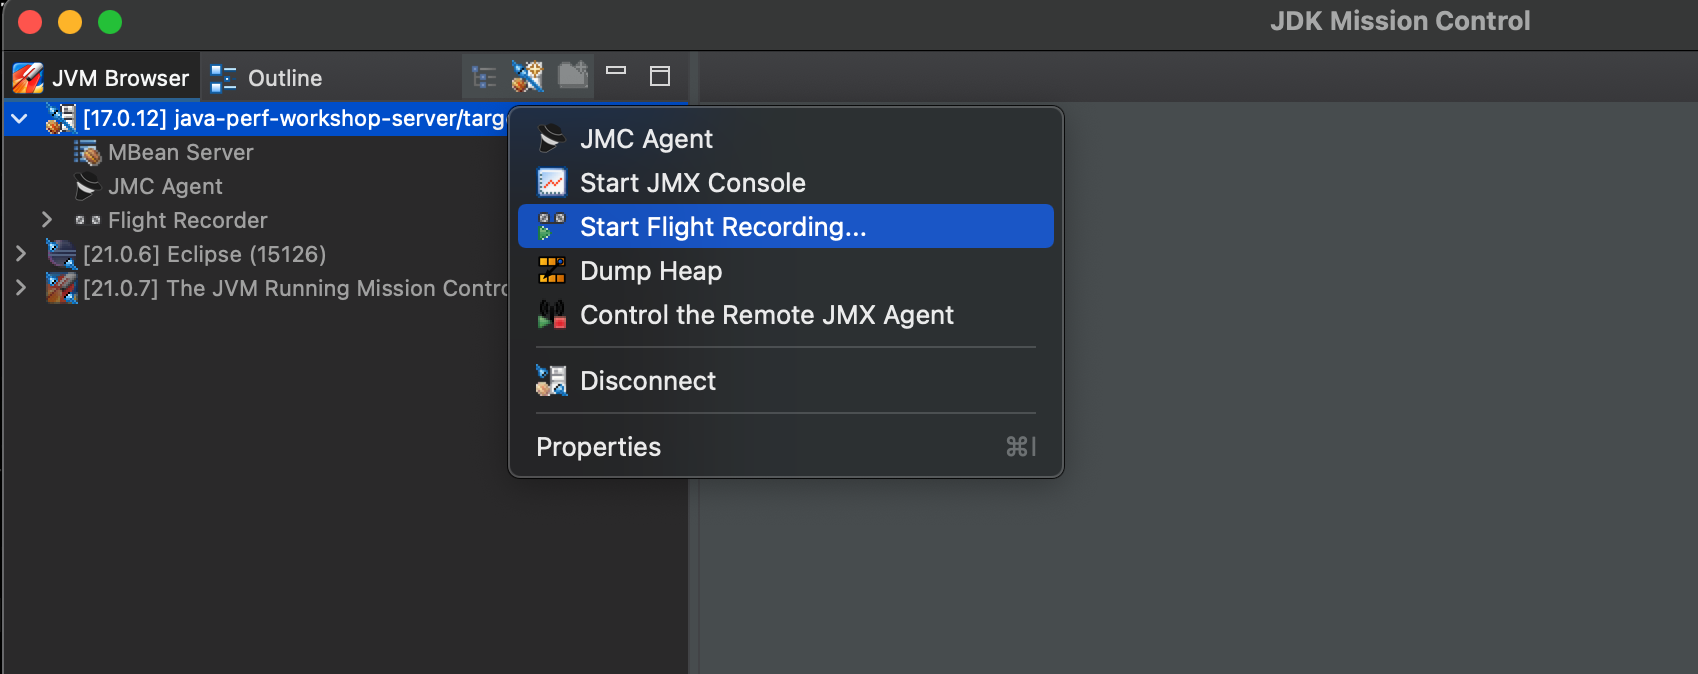
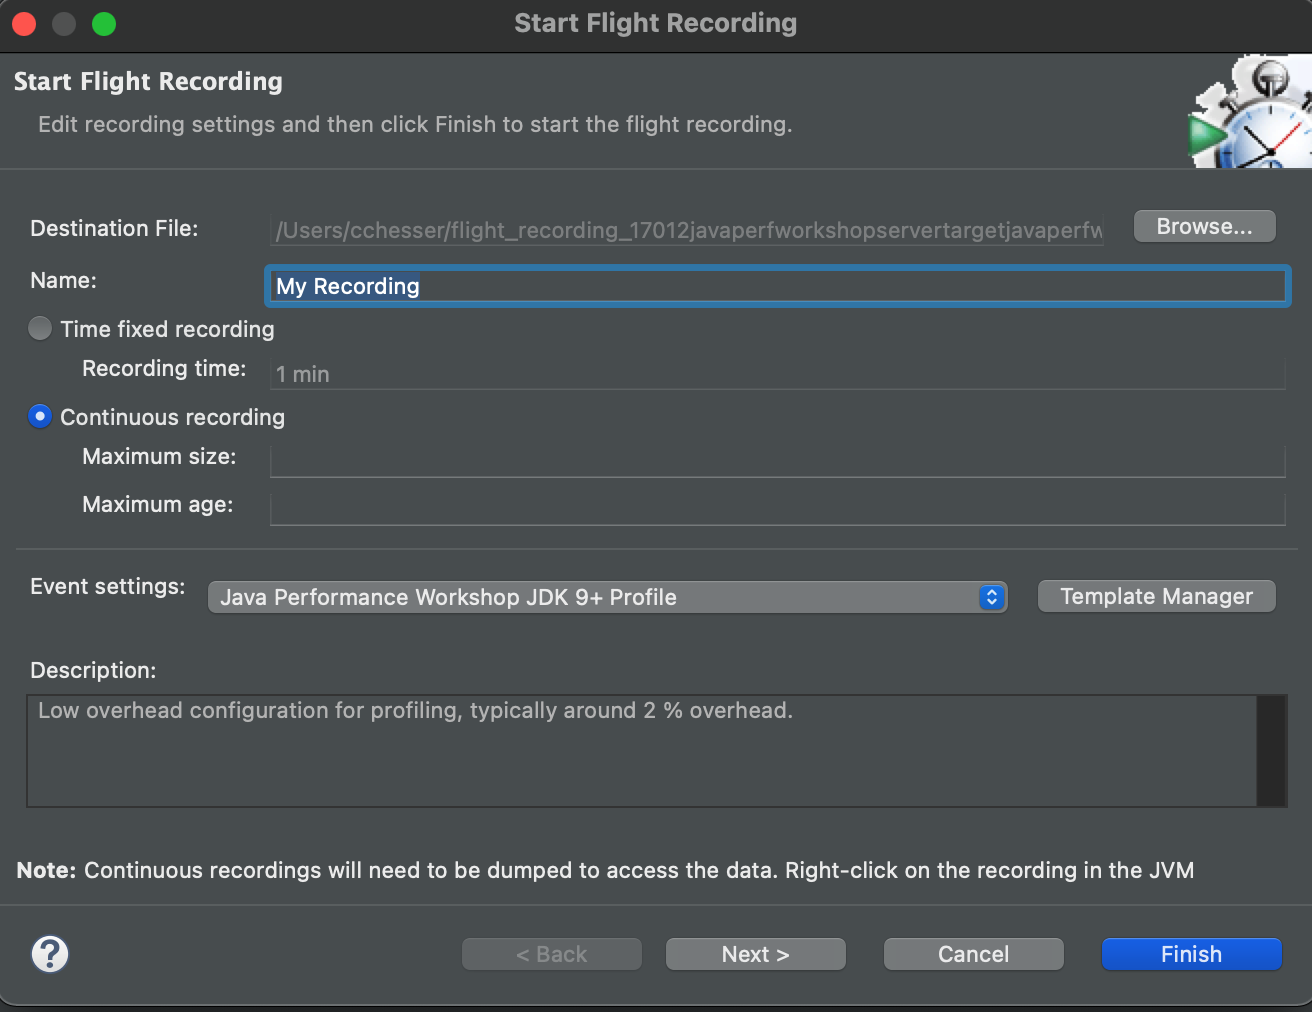
This will open a window where you apply some settings for the recording. First select that you want this to be a Continuous recording and for Event settings, we will import a template to get some consistent settings for profiling. Within the Template Manager, select Import Files… and import the open_jdk_9_.jfc by downloading it here folder. It should appear as Java Performance Workshop JDK9+ Profile. Select this as the Event Settings and then click on Finish.
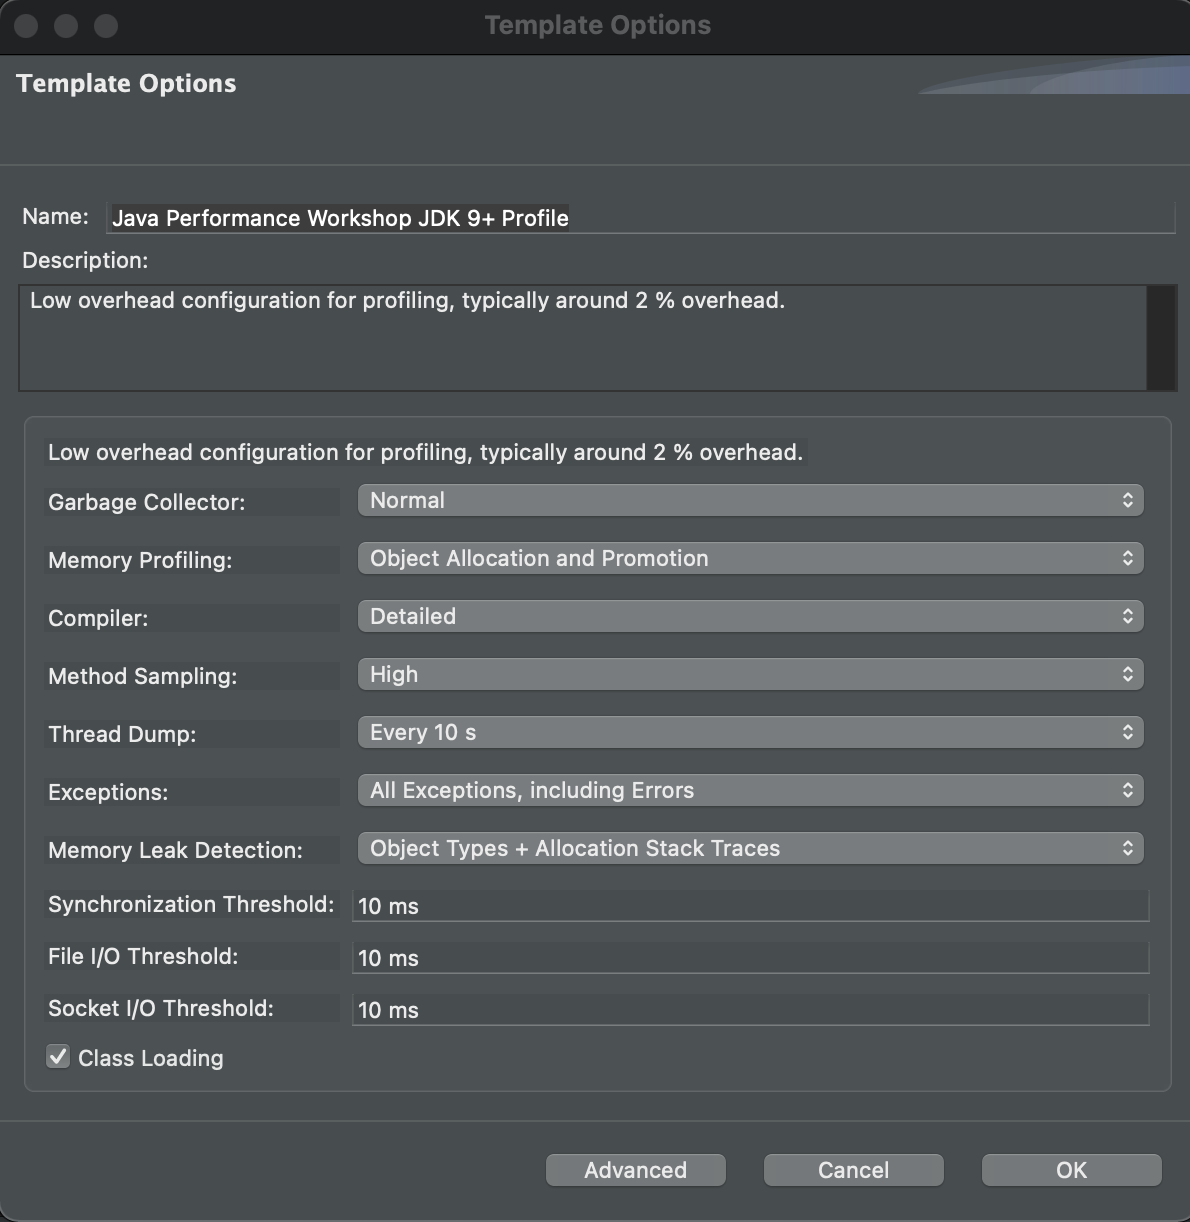
For reference, these are the options for the template.
First select that you want this to be a Continuous recording and for Event settings we will use Profiling on Server.
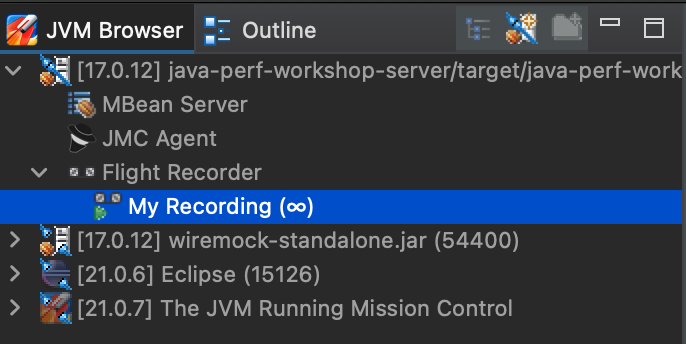
Once your flight recording is being captured in a Continuous recording, it will show a ∞.
💡 You can see the JFR templates (continuous / profile) which are shipped as part of the JRE in: $JAVA_HOME/jre/lib/jfr. These become helpful if you are wanting to compare your settings to some of the standard ones.
Generate HTTP traffic on service
We will want to generate some traffic on the service to measure some general characteristics of the service:
- Throughput (requests per second)
- Response time
- Trend of response time over time
By generating traffic on service, this gives us baseline activity in the JVM to start evaluating the flight recording.
Basic test
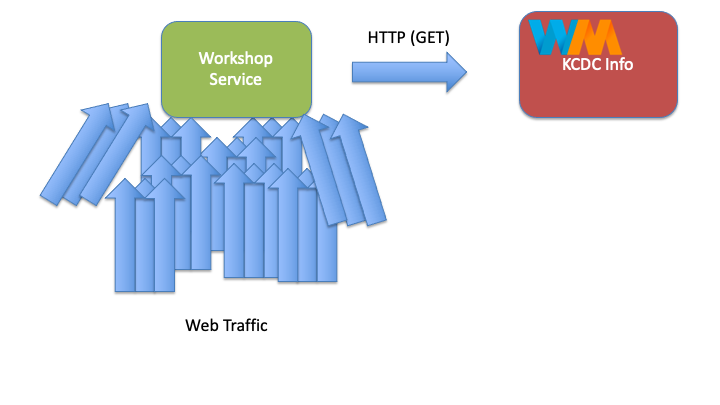
This service under test, is a simple web service which provides results based on a search API. When interacting with the service, you can simply supply a HTTP GET on the search resource with a query parameter (‘q’) with the term that you are searching for. It will then return KCDC’s 2015 sessions that contain that term. Example:
curl "http://localhost:8080/search?q=jvm"
{
  "results" : [ {
    "title" : "Concurrency Options on the JVM",
    "presenter" : "Jessica Kerr",
    "sessionType" : "Regular Session"
  }, {
    "title" : "Exploring the Actor Model with Akka.NET",
    "presenter" : "Robert Macdonald Smith",
    "sessionType" : "Regular Session"
  }, {
    "title" : "What's in your JVM?",
    "presenter" : "Carl Chesser",
    "sessionType" : "4-Hour Workshop"
  } ]
}
Using Apache Benchmark
We can utilize Apache Benchmark to generate traffic on the service From the console, we will execute the following to generate traffic against our service. Note, we will use a very basic search of just “a”, since this will generate more results.
ab -n 1000 -c 15 "http://localhost:8080/search?q=a"
Using loadtest
An alternative to Apache Benchmark, is loadtest (a node.js equivalent). To install:
sudo npm install -g loadtest
Then you can execute similarly:
loadtest -n 1000 -c 15 "http://localhost:8080/search?q=a"
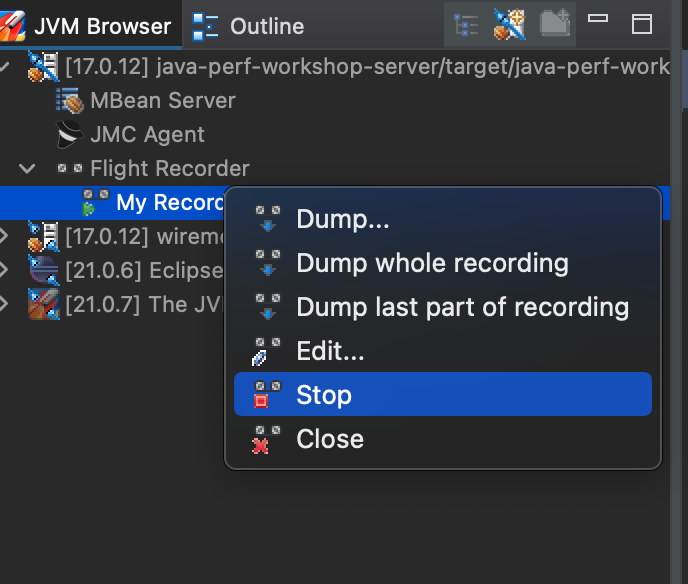
Stop Flight Recorder
After you have played traffic through the service, you can then stop your flight recording from JMC.
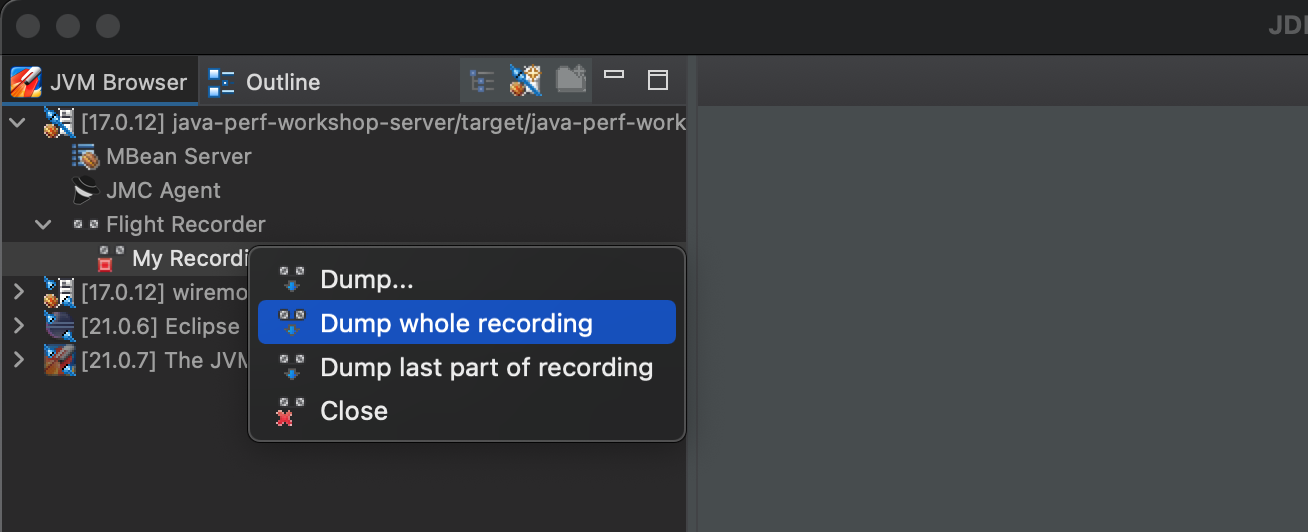
Then dump the whole recording.
The Flight Recording
From a Java Flight Recording, there are several categories of information (pages) you can view from JMC:
- Code Information:
- Method Profiling: Provides information about specific method runs and how long each run took, identifying hot spots in your code base.
- Exceptions: Displays Exceptions and Errors thrown and which methods threw them. Viewing exceptions requires editing the settings to also capture Exceptions.
- Thread information:
- Threads: Provides a snapshot of all the threads that belong to the Java Application and the thread activity.
- Lock Instances: Provides further details on threads by specifying lock information, showing which threads request and which threads take a particular lock.
- Thread Dump: Provides period thread dump information.
- Memory Information:
- Memory: Represents heap memory usage of the JVM.
- IO Information:
- File I/O: Displays File costs and behaviors
- Socket I/O: Displays Network costs and behaviors
- JVM Internals:
- Garbage Collections: Displays heap usage compared to pause times as well as GC events.
- Compilations: Provides details on code compilation.
- TLAB Allocations: Displays Thread Local Allocation Buffers.
- System Information:
- Processes: See other processes on the system and what is competing for resources.
- Environment: Provides information about the environment in which the recording was made.
- System Properties: Show properties passed on to the JVM.
- Events: Event Browser: View detailed log of the events within the JVM. You can use this page to further filter down on events across all the pages in the recording.
Note
Feel free to reference the additional resources as you navigate through the sections.
Up Next
In the next section, we'll find out more about what our methods are doing.
Method Profiling2 - Method Profiling
Gather context of where we spend time in our code
Our first look at the recording will start with finding out where we might be spending time with our code.
Method Profiling Page
We’ll start by taking a look at the detailed Method Profiling Page. This page displays how often a specific method is ran based on sampling.
Note
This page is a little bit difficult to use in JMC7, planned improvements for the data visualization will come in JMC8, see JMC#165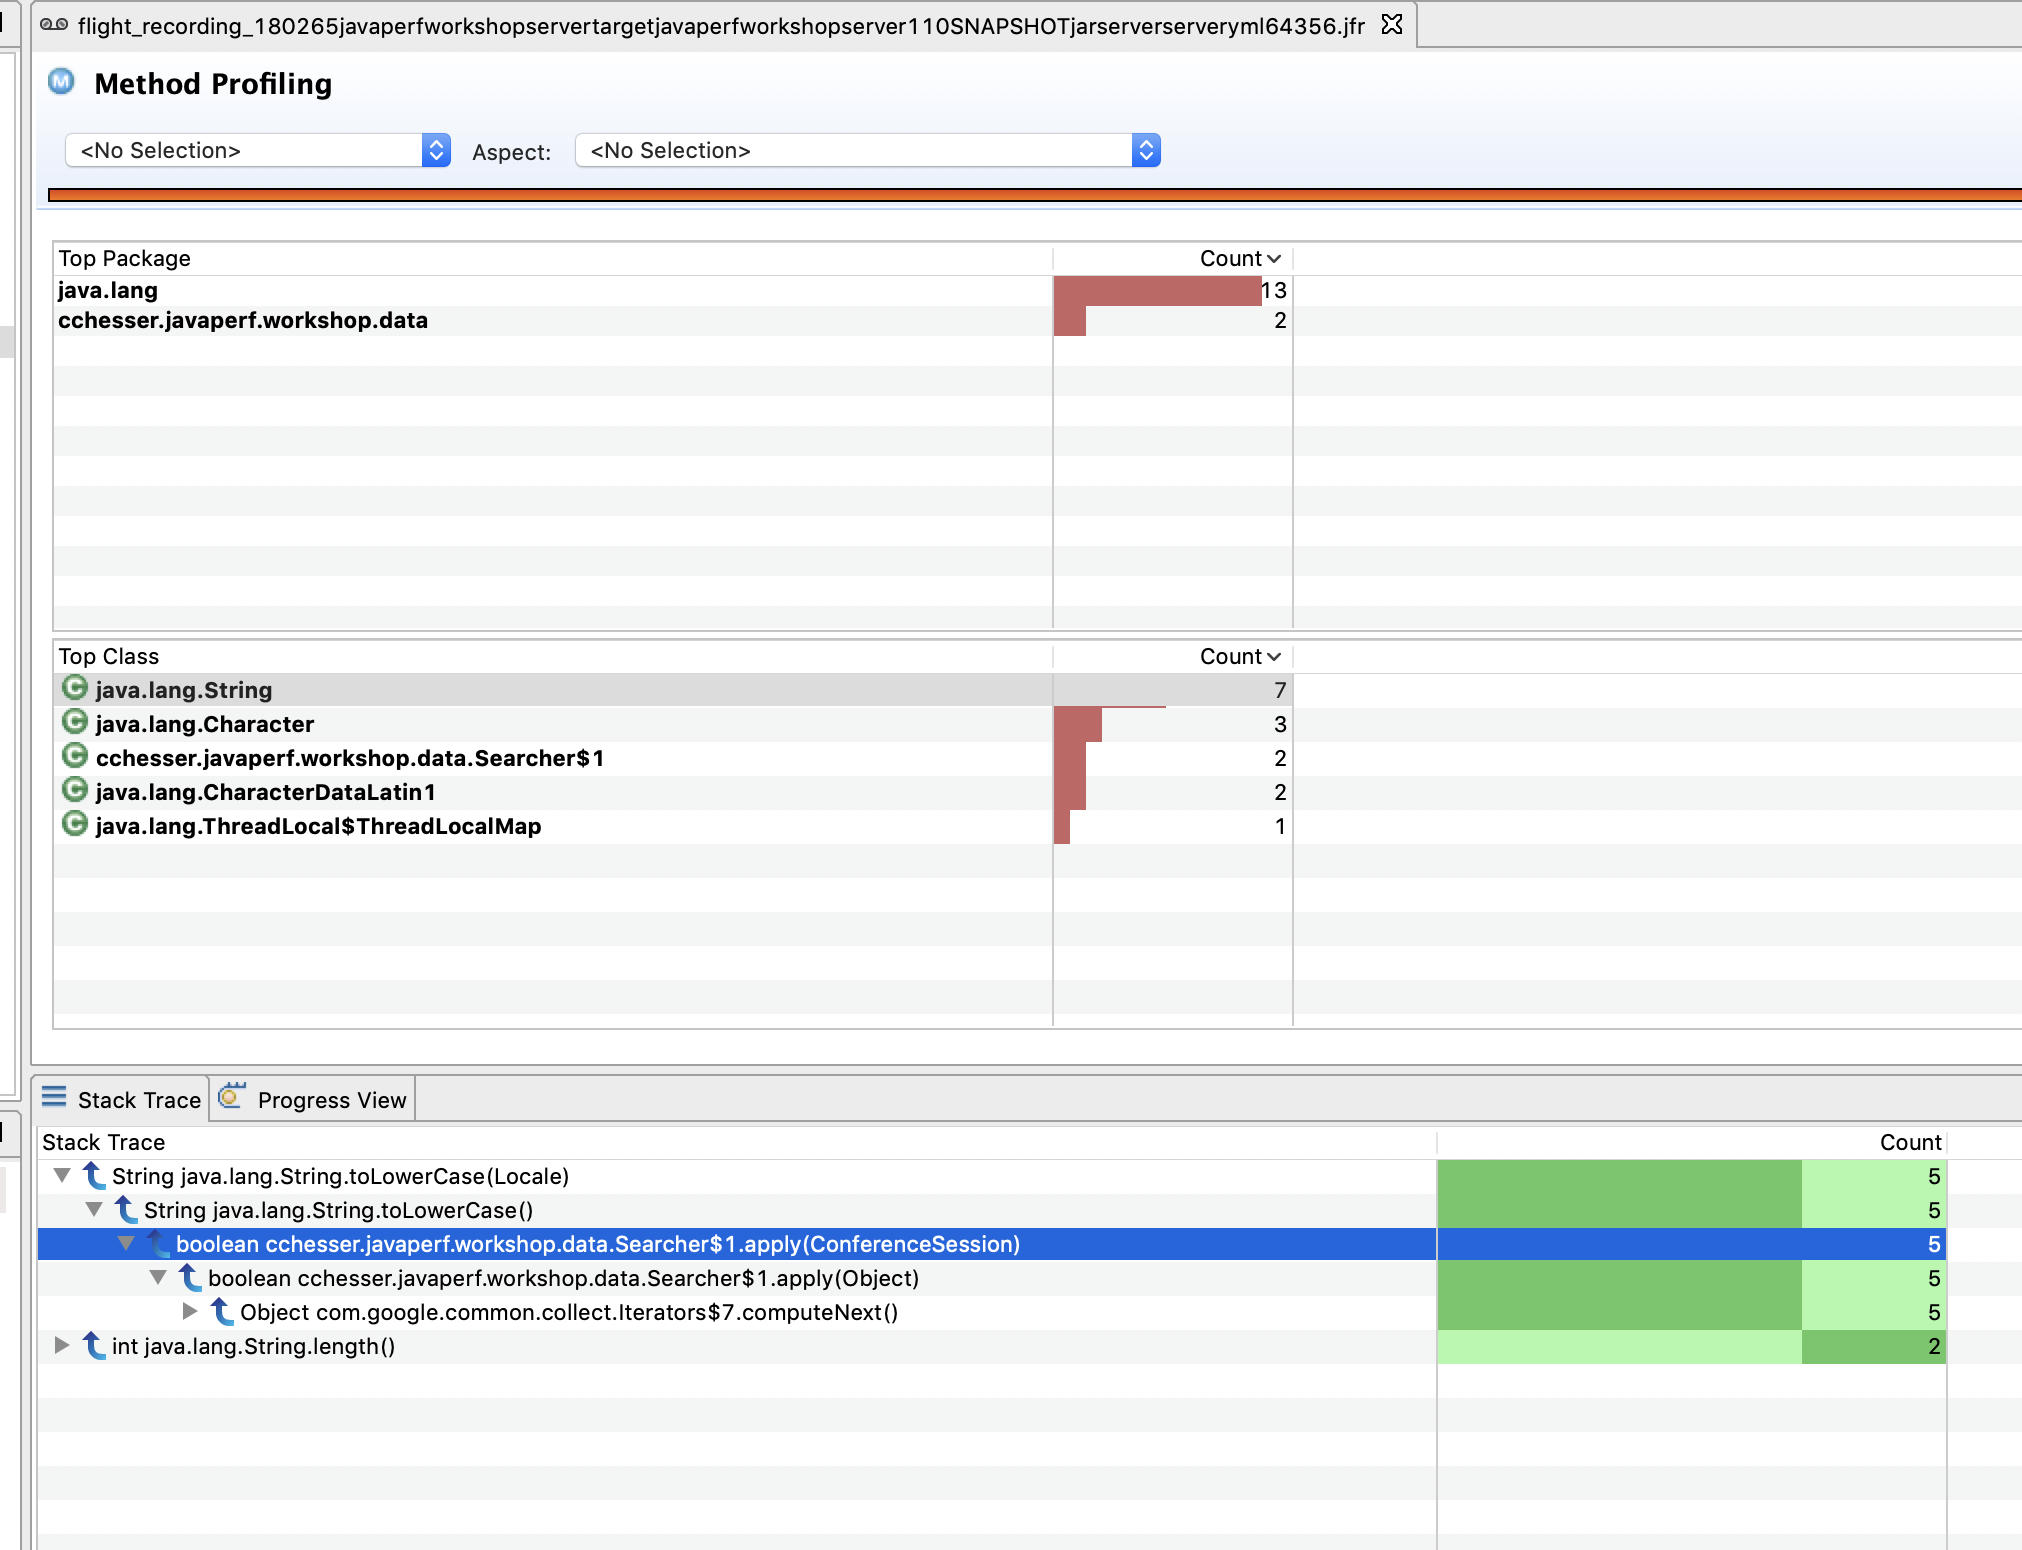
By default, this view groups threads by method, but you can also include the line number for each method. This can be accomplished by selecting the View Menu option and going to Distinguish Frames By and selecting Line Number.
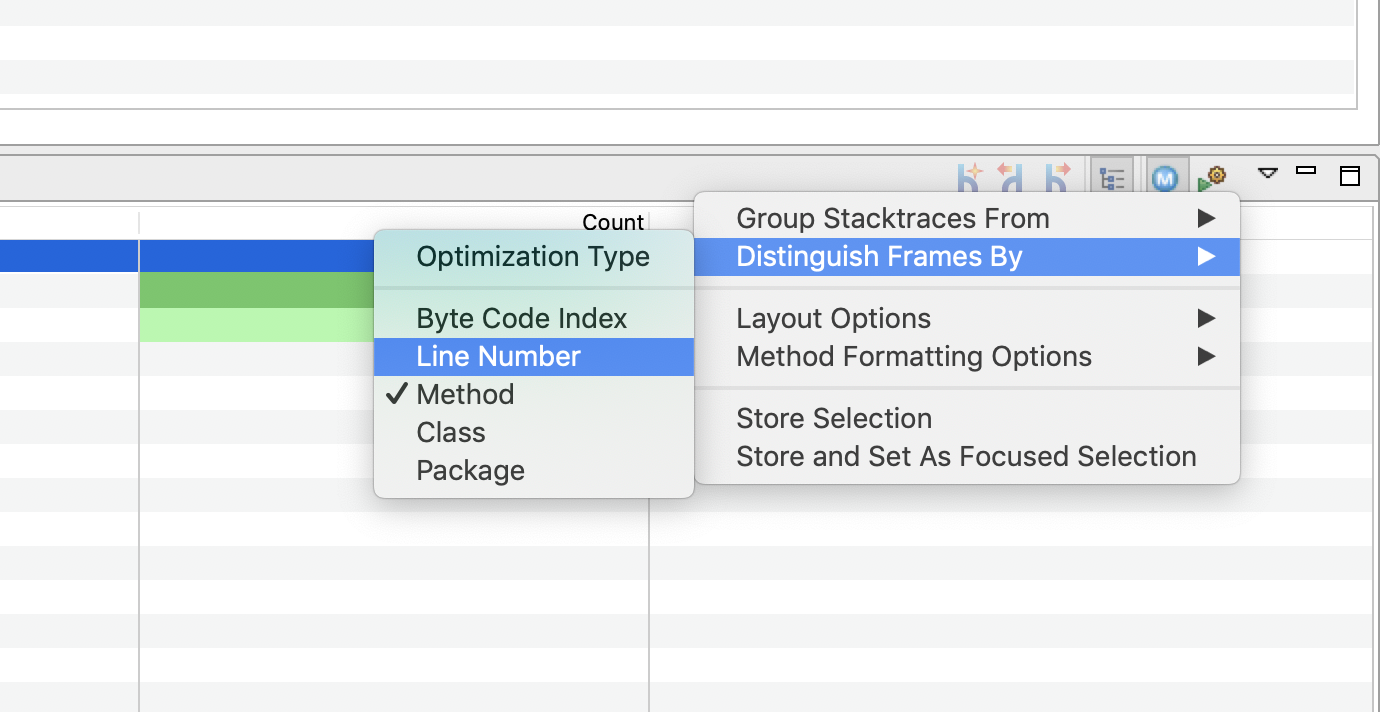
💡 Generally, you don’t need this, as it can be quite apparent by the base method being invoked where the cost is at. Though, it may be helpful to include in some contexts.
Note
Remember that this is just a sampling view, and does not mean that only a small amount of methods were hit. We’ll be able to visualize more of this info in the following part.Java Application
Navigate to the Java Application page. This page provides an overview of the state of the JVM and collates information from a couple of the dedicated pages.
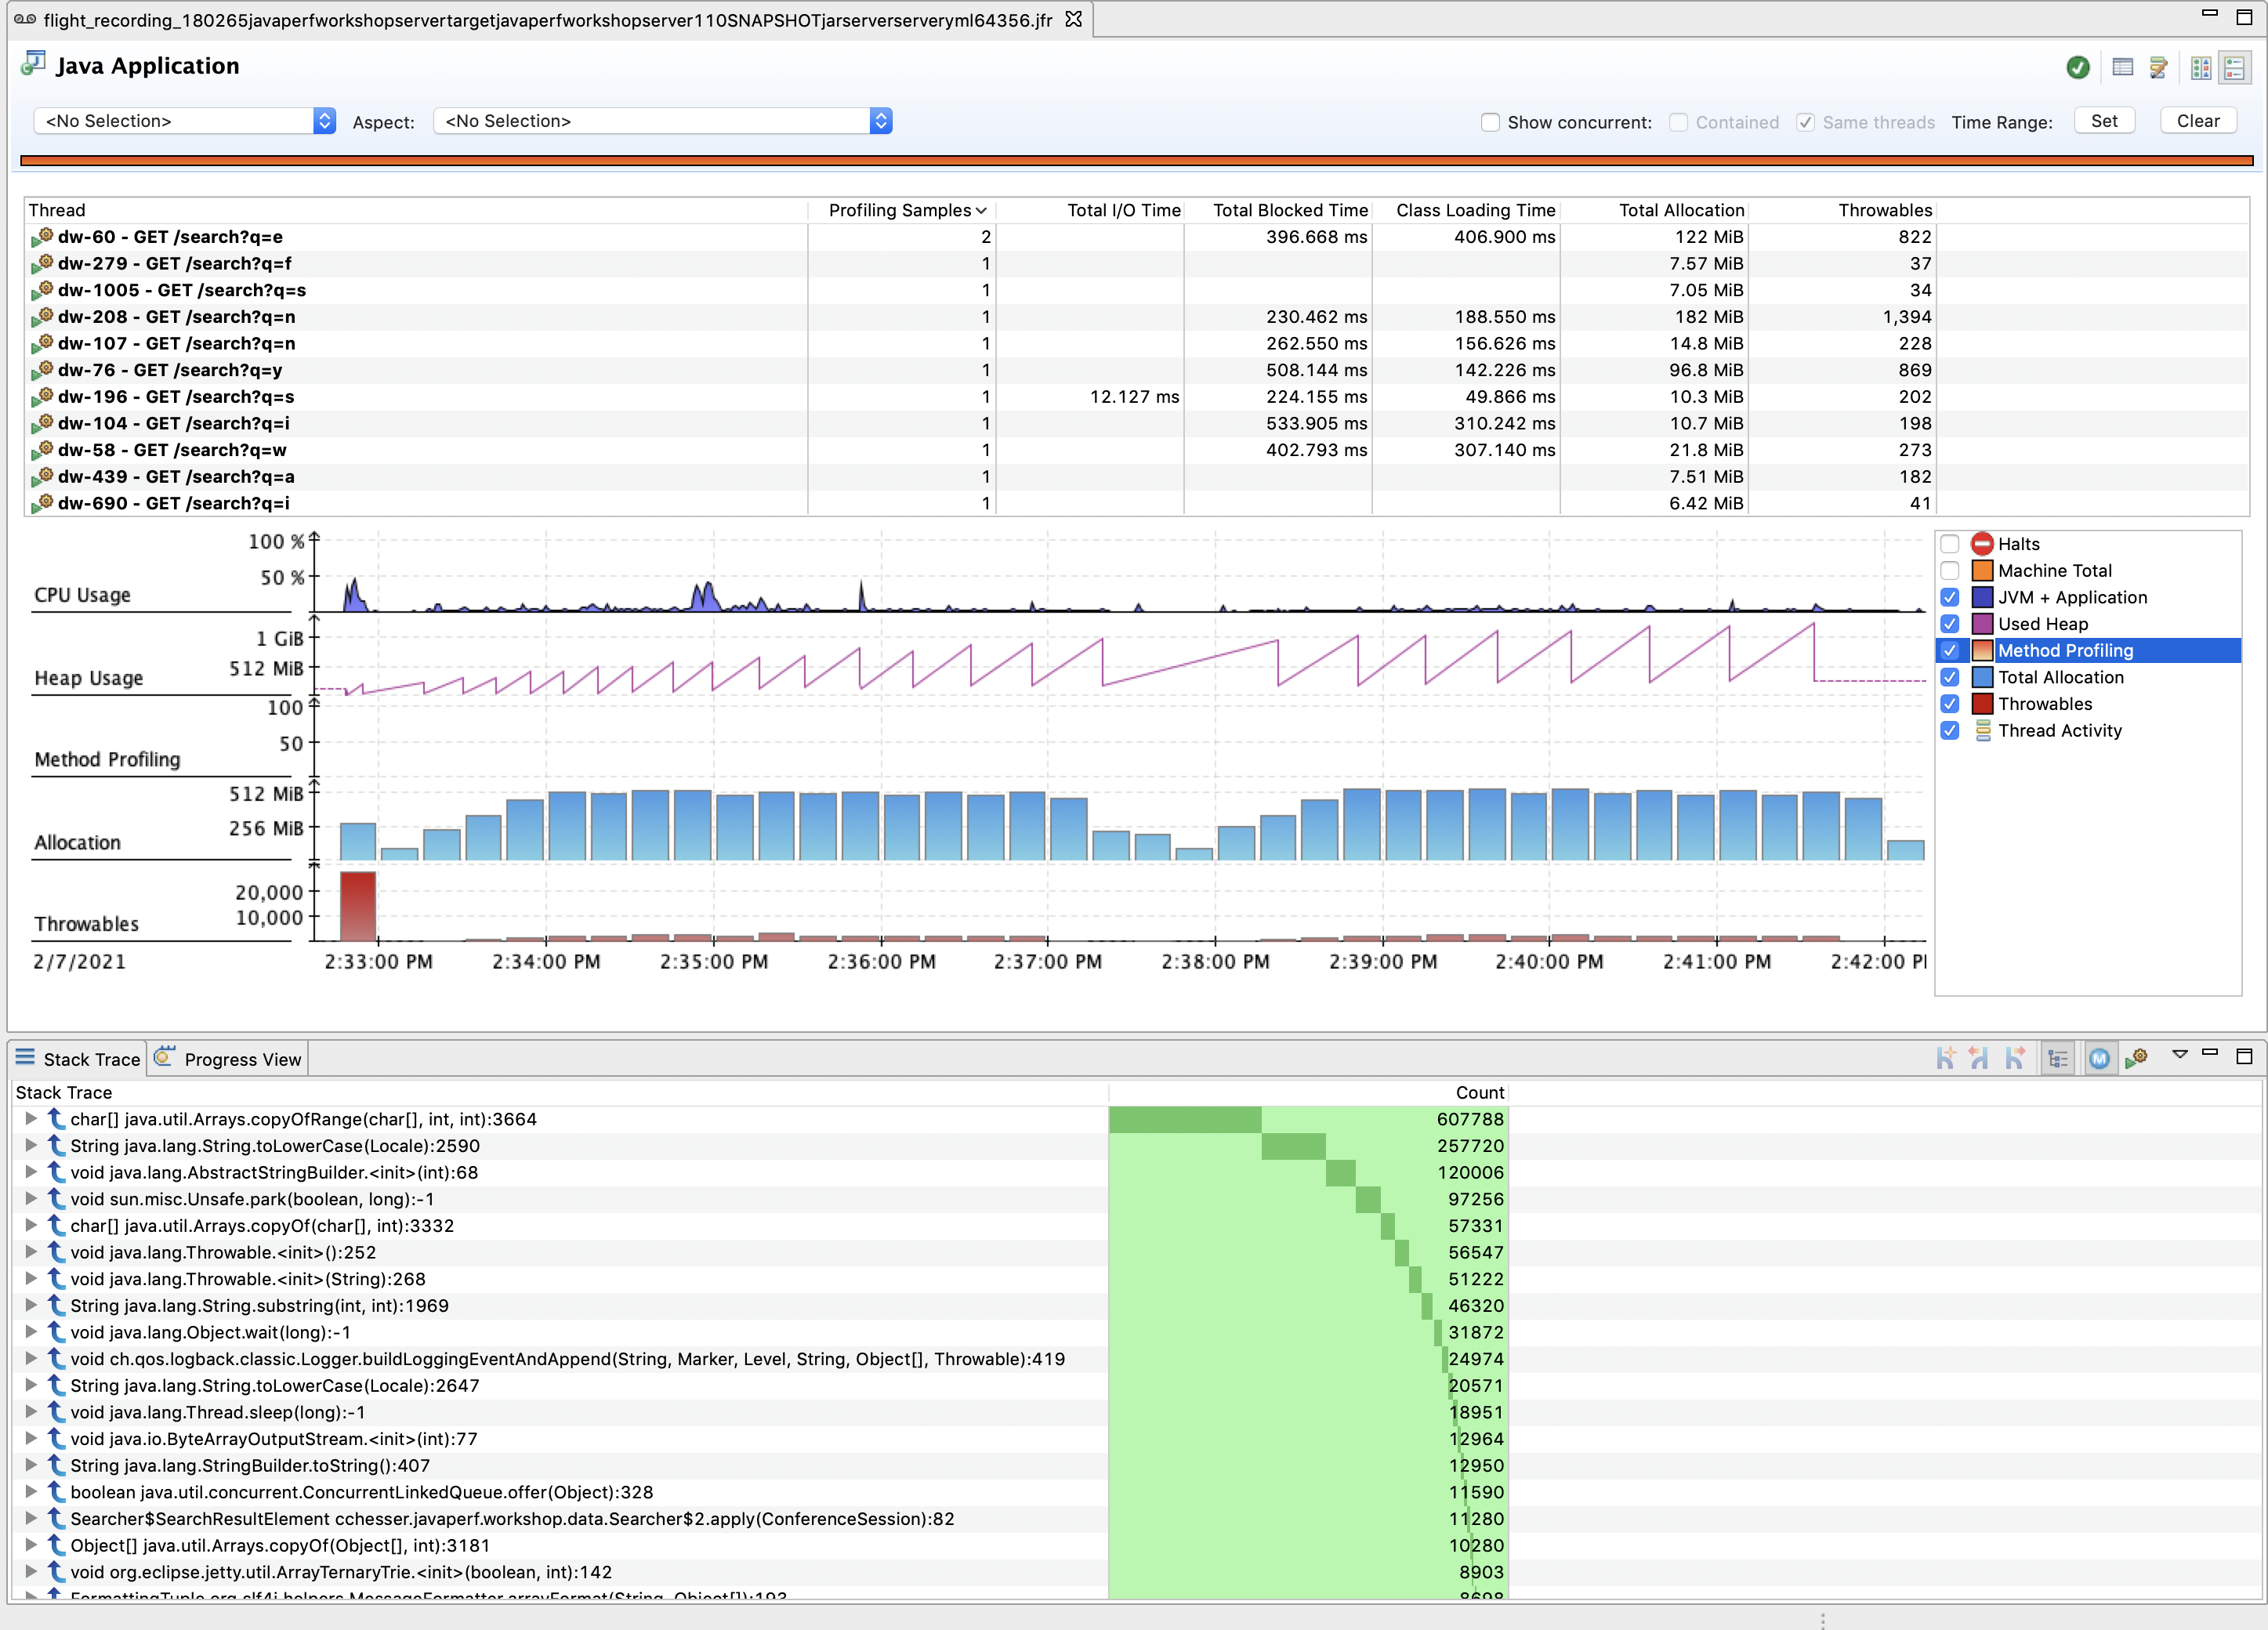
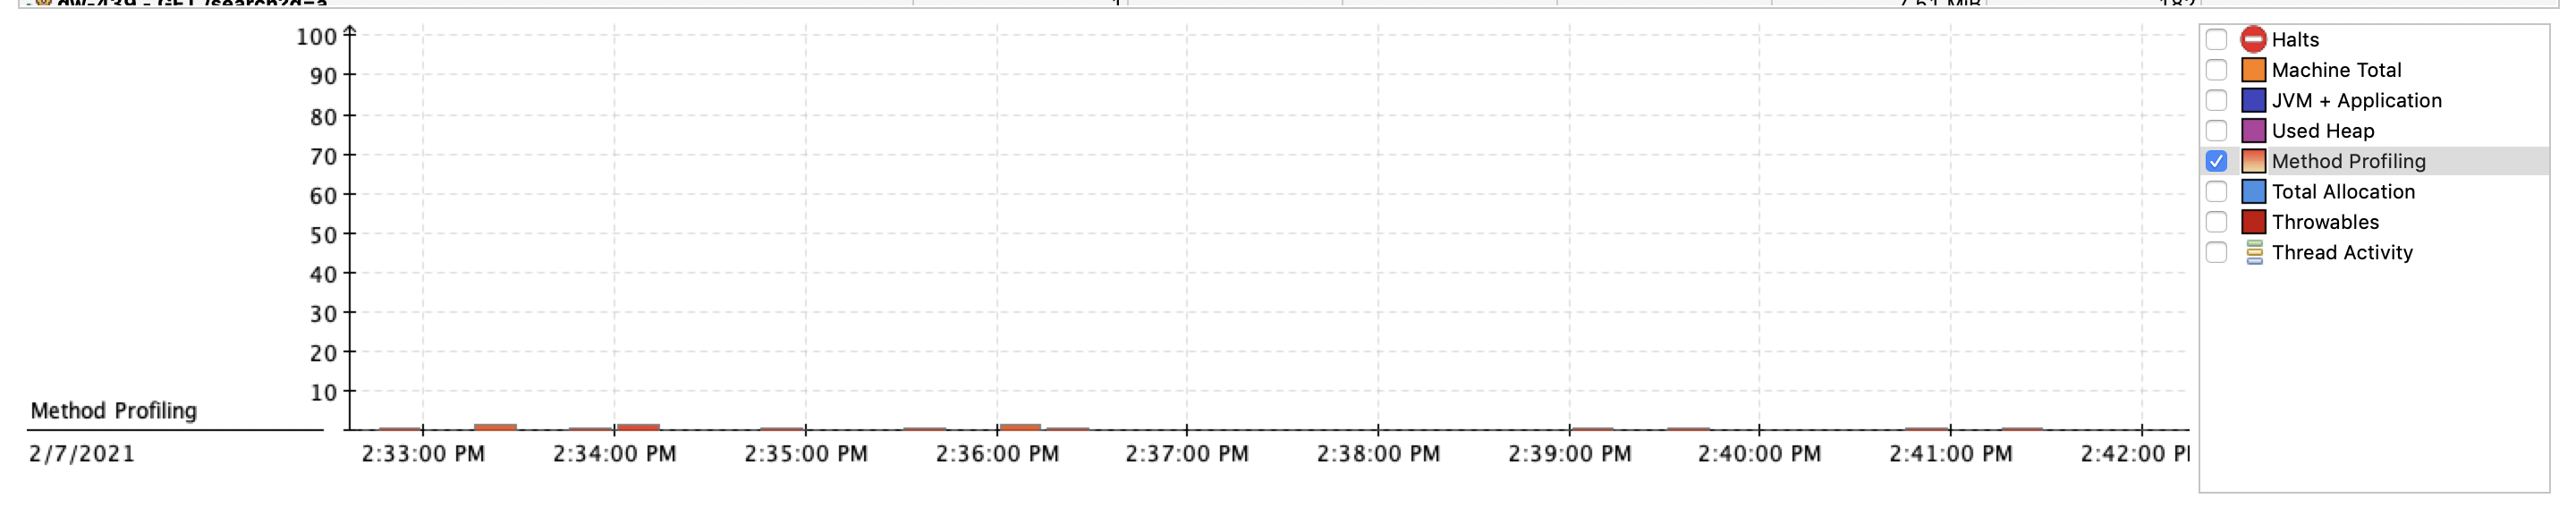
Using the checkboxes on the right of the Graph, select only Method Profiling to narrow down the set of events on the graph:
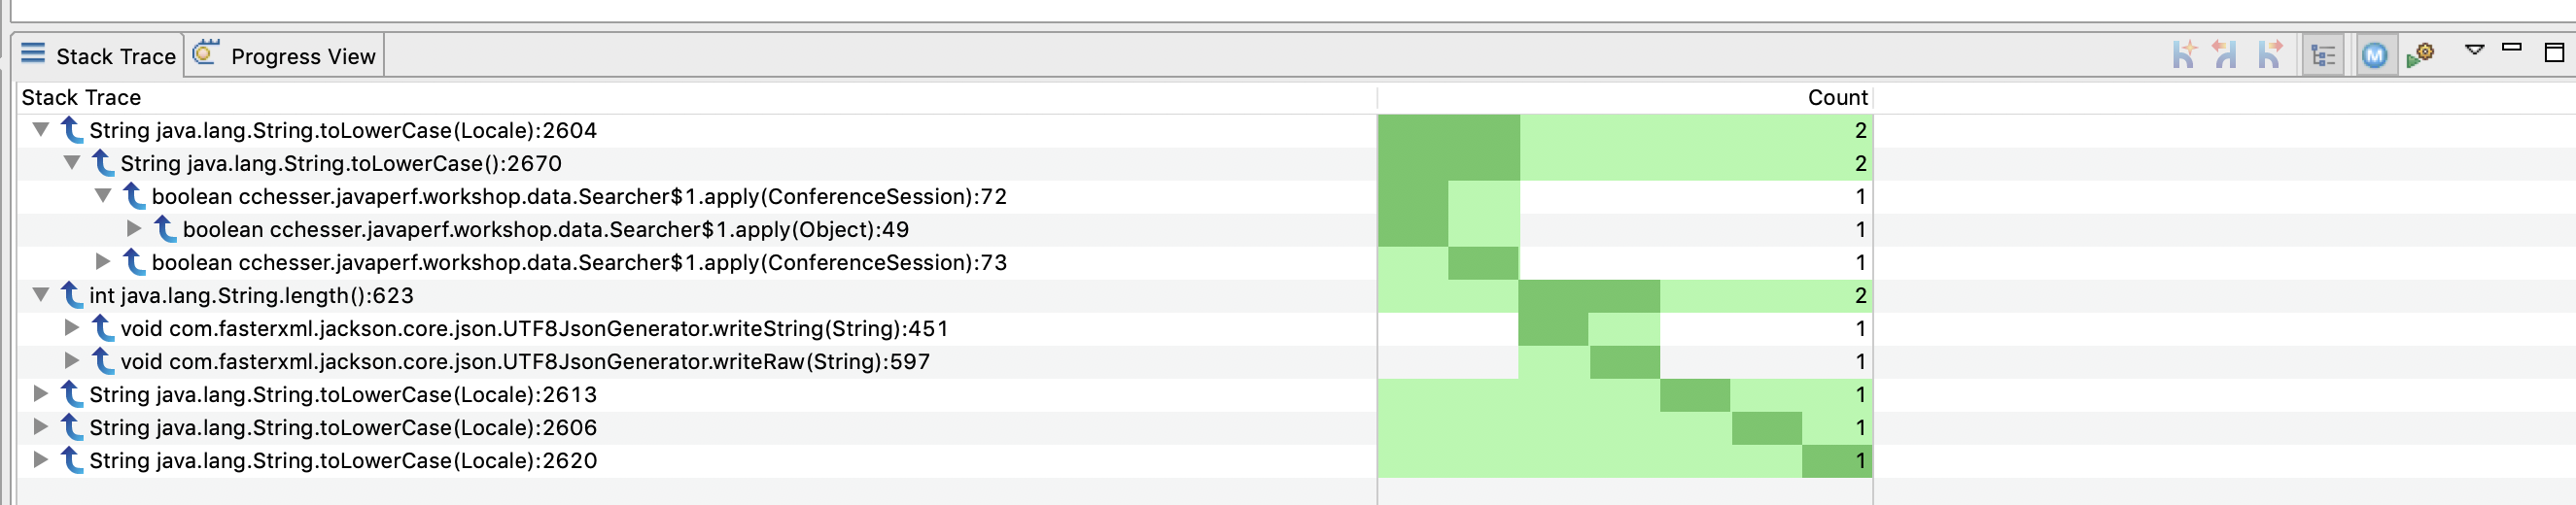
The Stack Trace view from this page can give you a better count of sampled methods (not just the ones from a specific Method Profiling event)
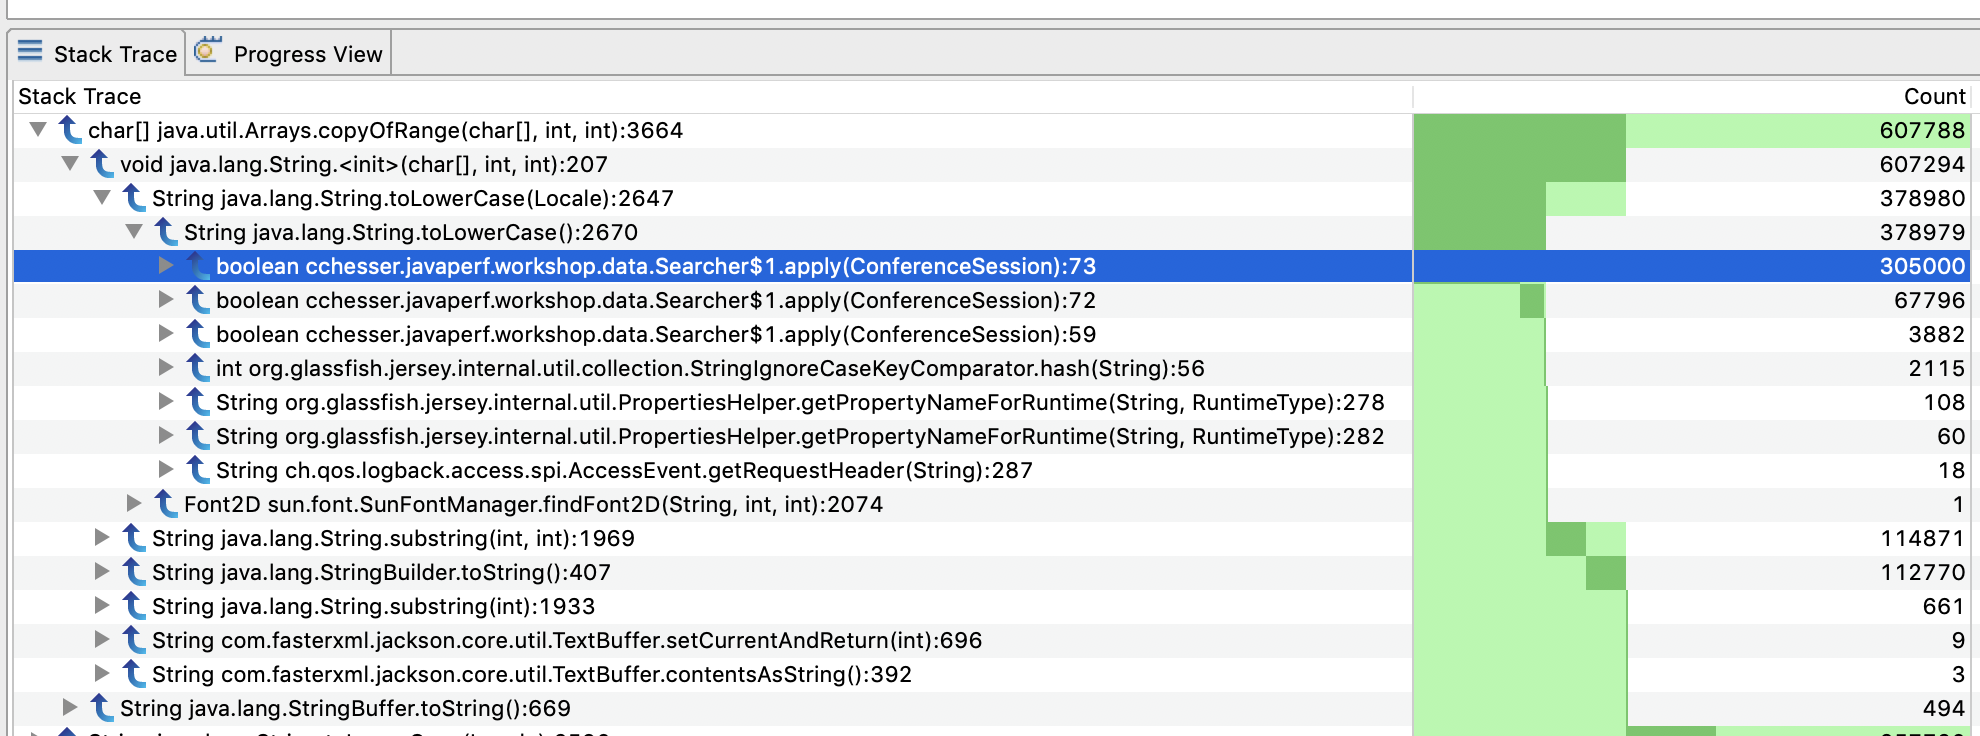
This information is the equivalent of the Hot Methods tab in JMC 5, see forum discussion.
We can then use this information to correlate what is happening in our code:
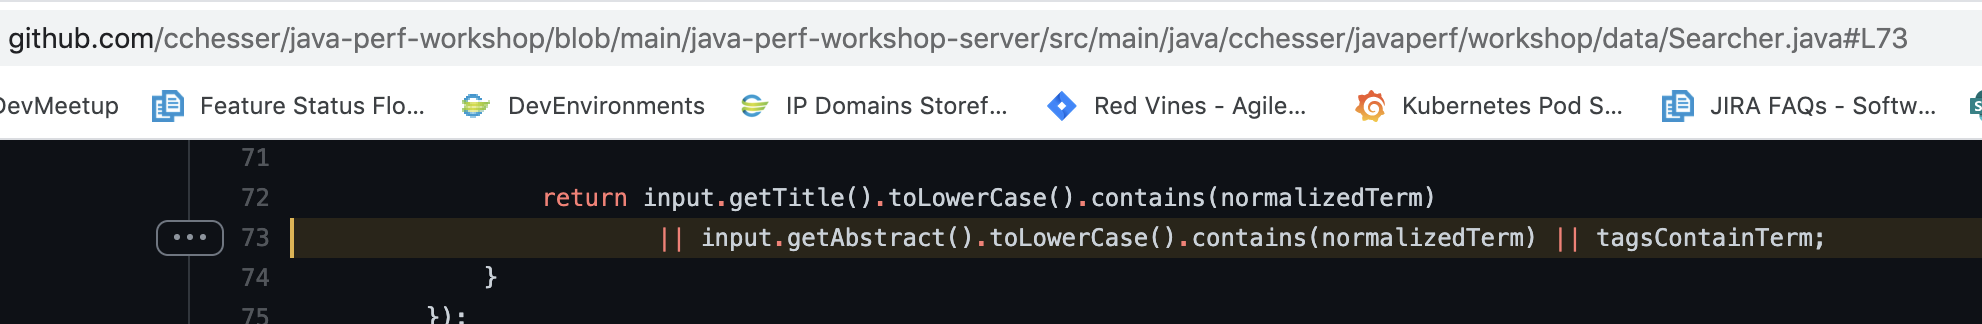
Explore
- Walk around to look at other areas where you are spending time in your code.
- In many cases you find that there are very expensive areas of code that you cannot change (as you may not own it), but you can dictate whether or not it should be executed (or executed as frequently).
Follow Ups
- Is there any method that stands out to you that might be unnecessarily called?
Up Next
In the next section, we'll look at the Exceptions thrown by our application.
Exceptions3 - Exceptions
Find the exceptional cases in our application.
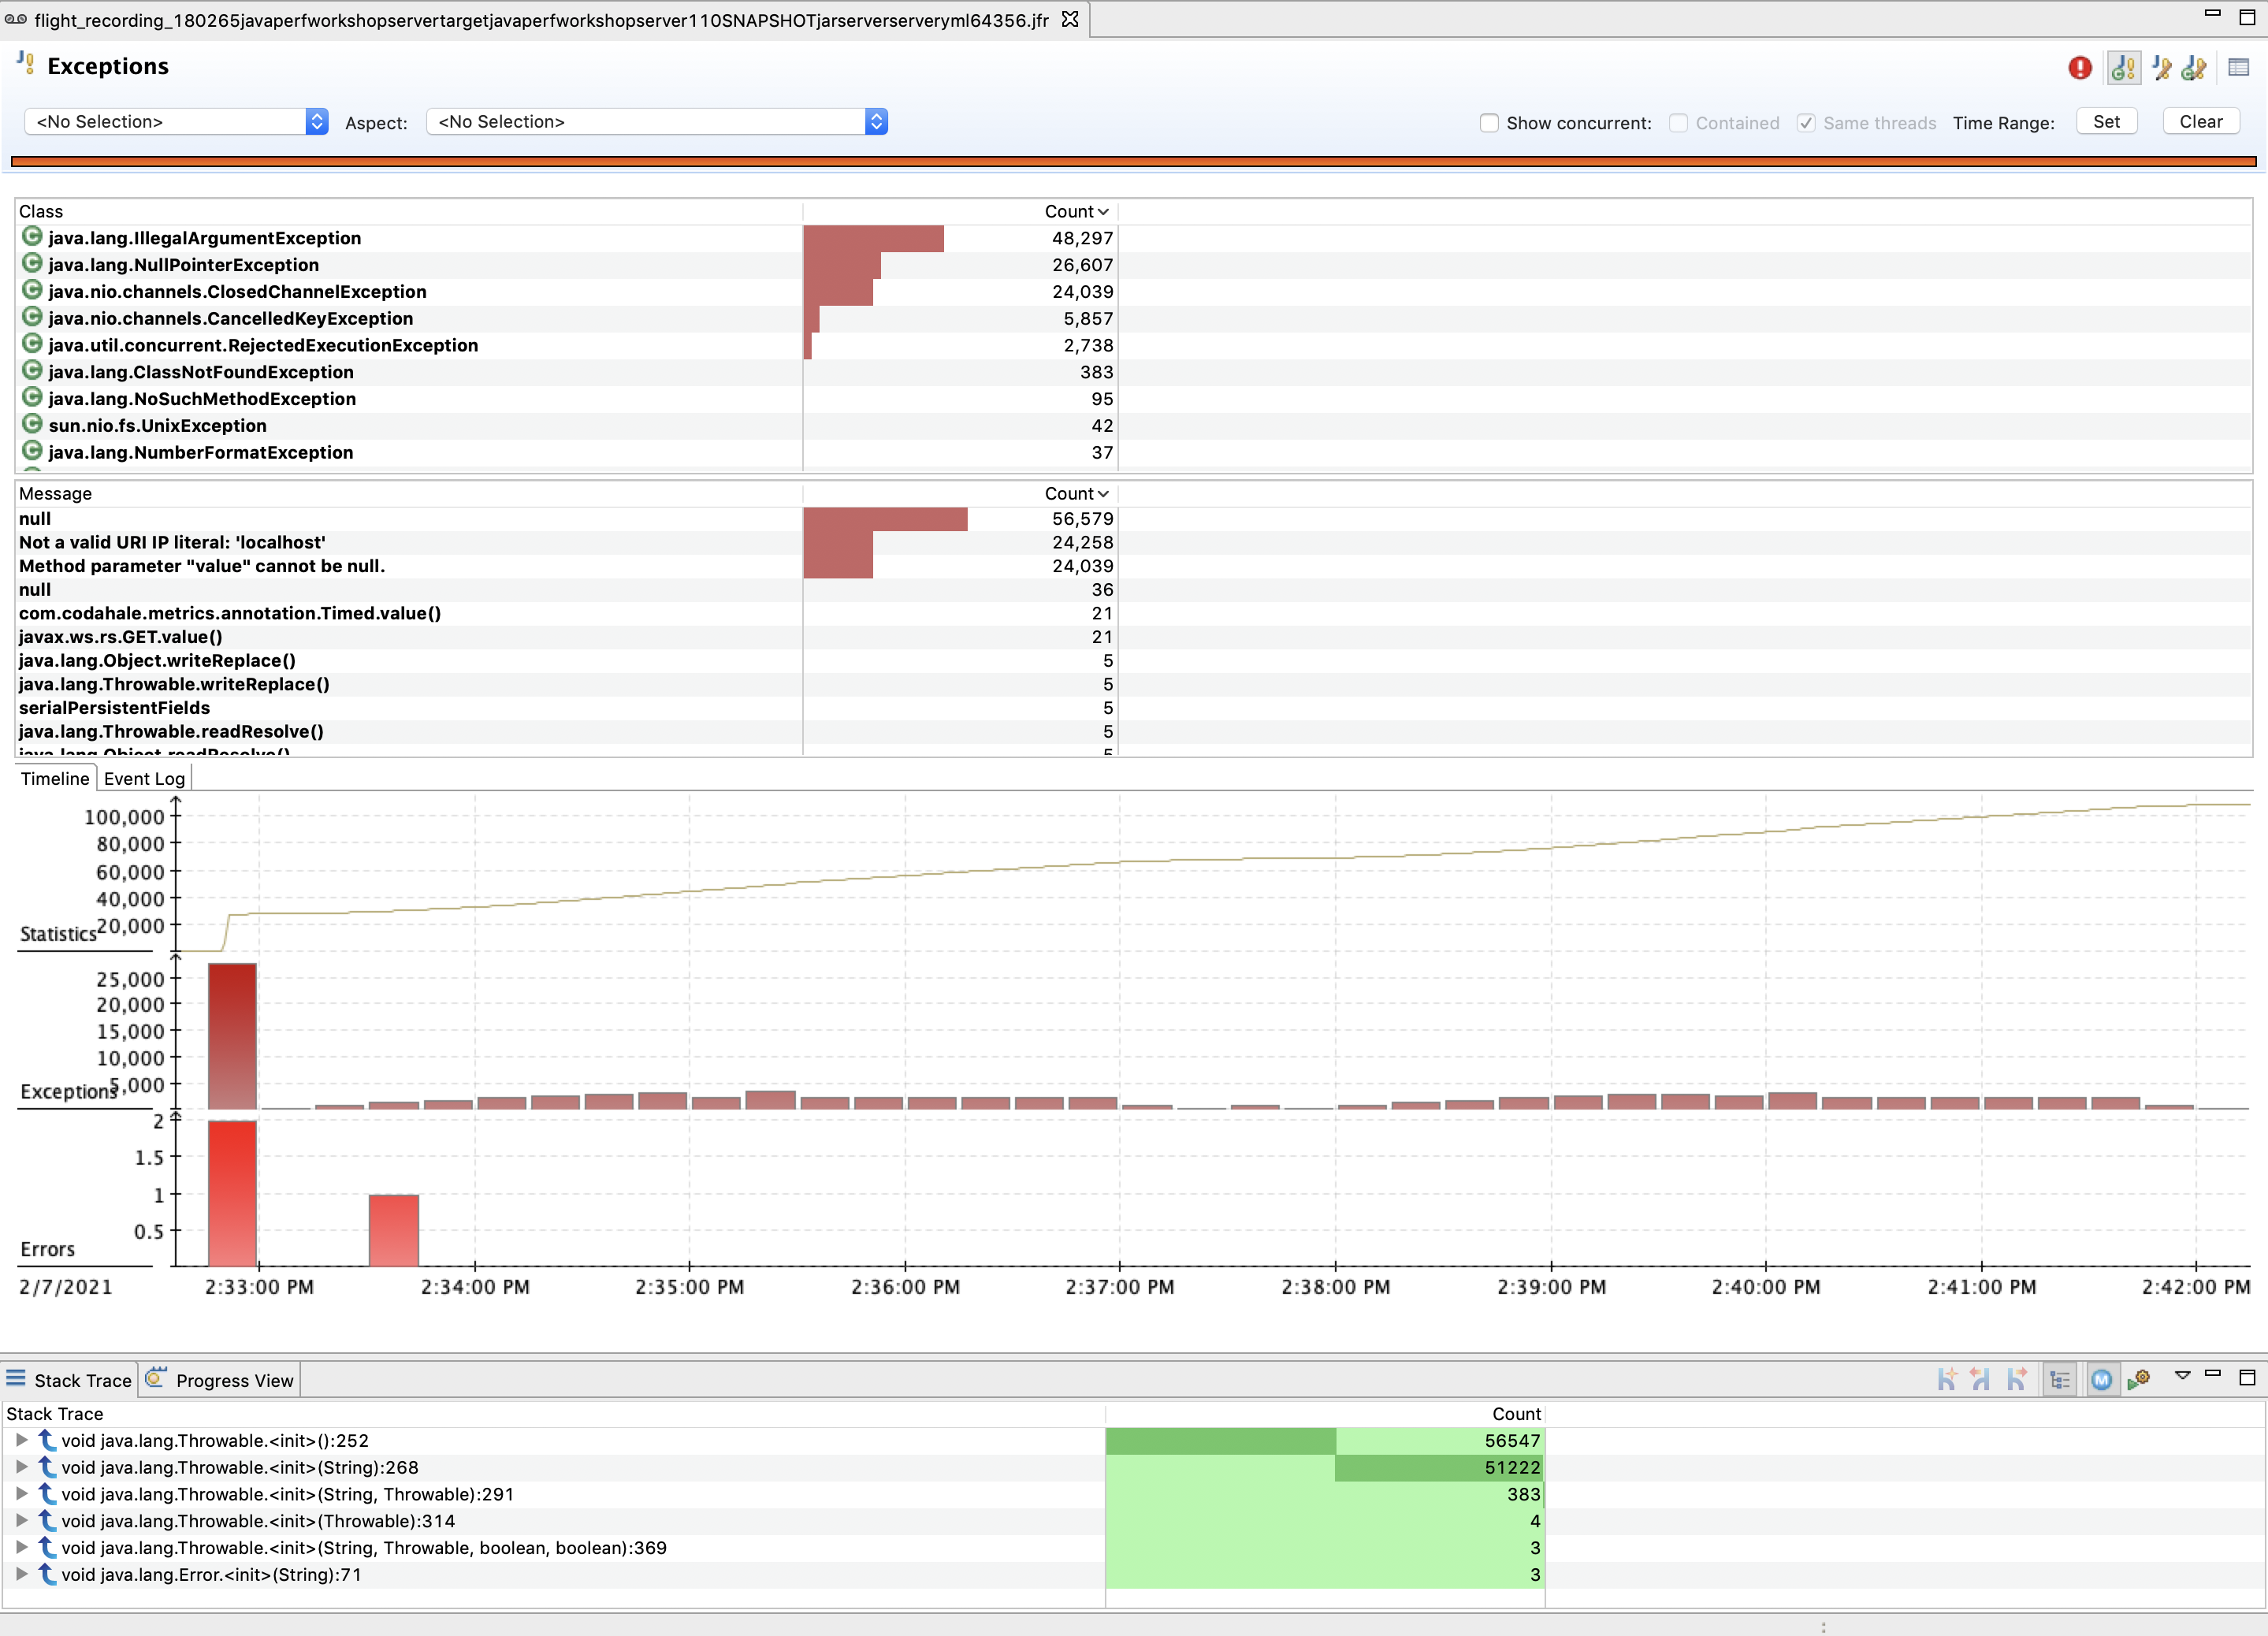
In this section we’ll dive into the Exceptions page and find out what information we can learn from it. Start by selecting the Exceptions page from the Outline.
This page offers the following sections:
- Overview: You can get Exceptions by Class and Count
- Message: View the detail messages for all exceptions and errors.
- Timeline/Event Log: View when a particular exception was thrown.
- StackTrace: Identify where the exception was thrown from.
 .
.
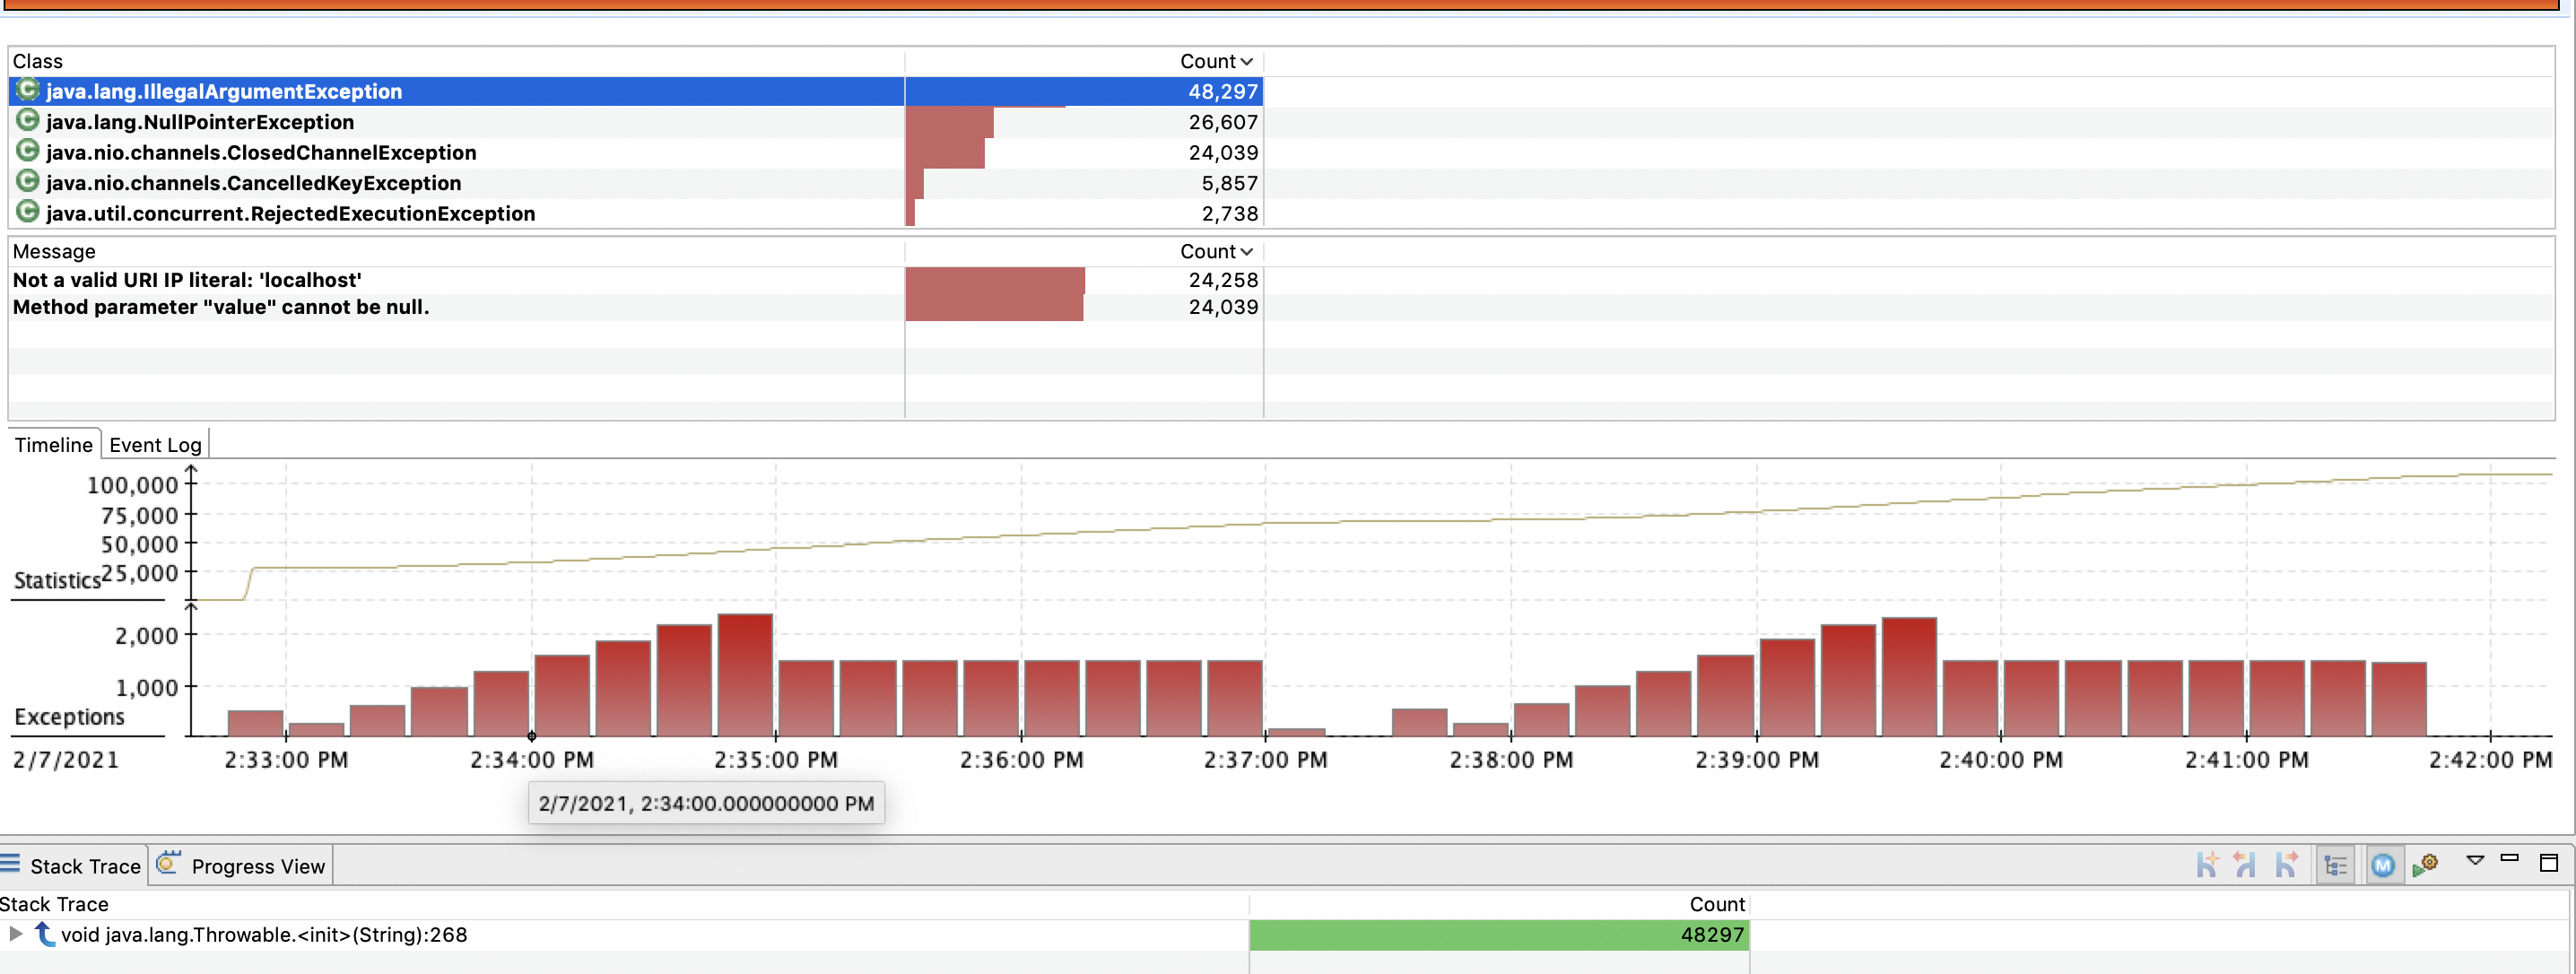
You can select an exception from the table to filter the information to that particular exception. You could also filter by a particular exception message.
Explore
NullPointerExceptions are a familiar exception you deal with in Java, and often times indicate a programming error. Other exception types often point to a common symptom.
Follow Ups
- What are the exceptions that are getting generated the most?
- What stack traces are the contributor?
- Can you find any areas in our code where we may have made an incorrect assumption regarding nullability?
- Are there any other areas in our code where we might have made an incorrect assumption based on an exception’s class?
- Are there any exceptions that might indicate a problem with our dependencies?
Up Next
In the next section, we'll look at the Threads used by our application.
Threads4 - Threads
Find the computation and latency events in your application.
The Threads page provides a snapshot of all threads in our application, and we can use it to acquire information about computation and latency events.
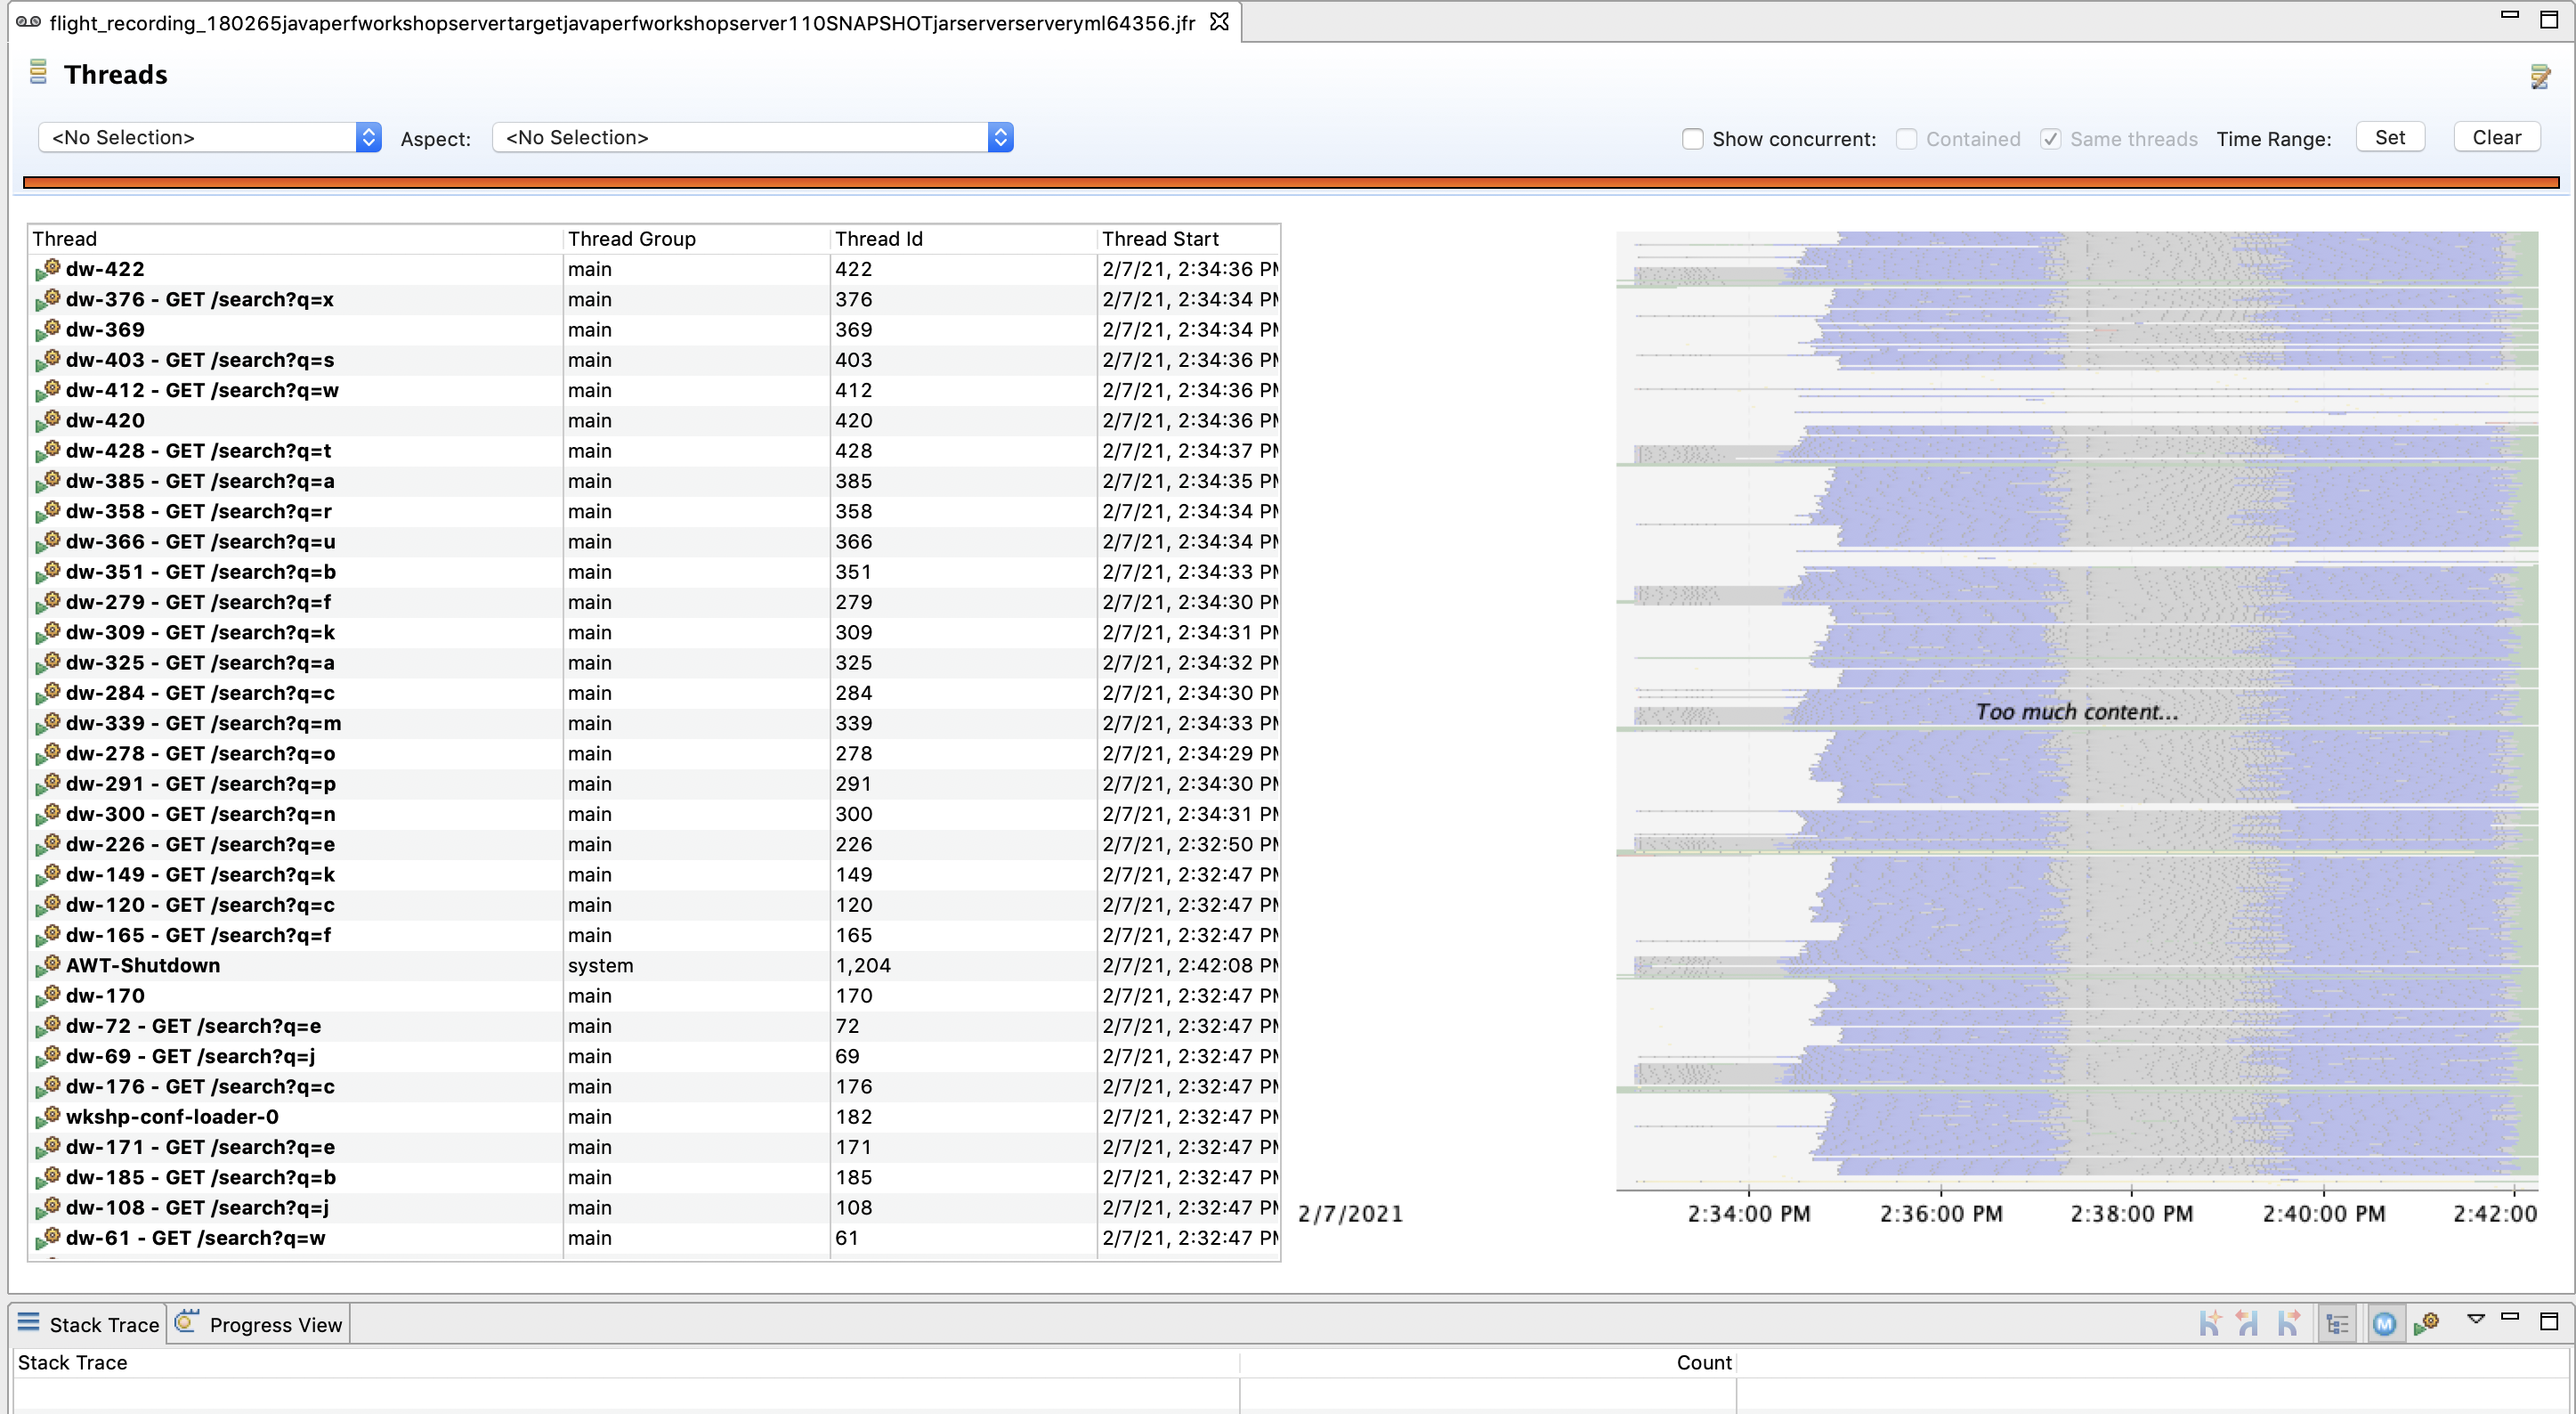
Thread Chart
We can use the Thread Chart view to select a region of time and view the state of threads and the most common stack frames for that particular time slice:
We can also edit the types of events shown by the chart. Right click on the chart, and select Edit Thread Activity Lanes
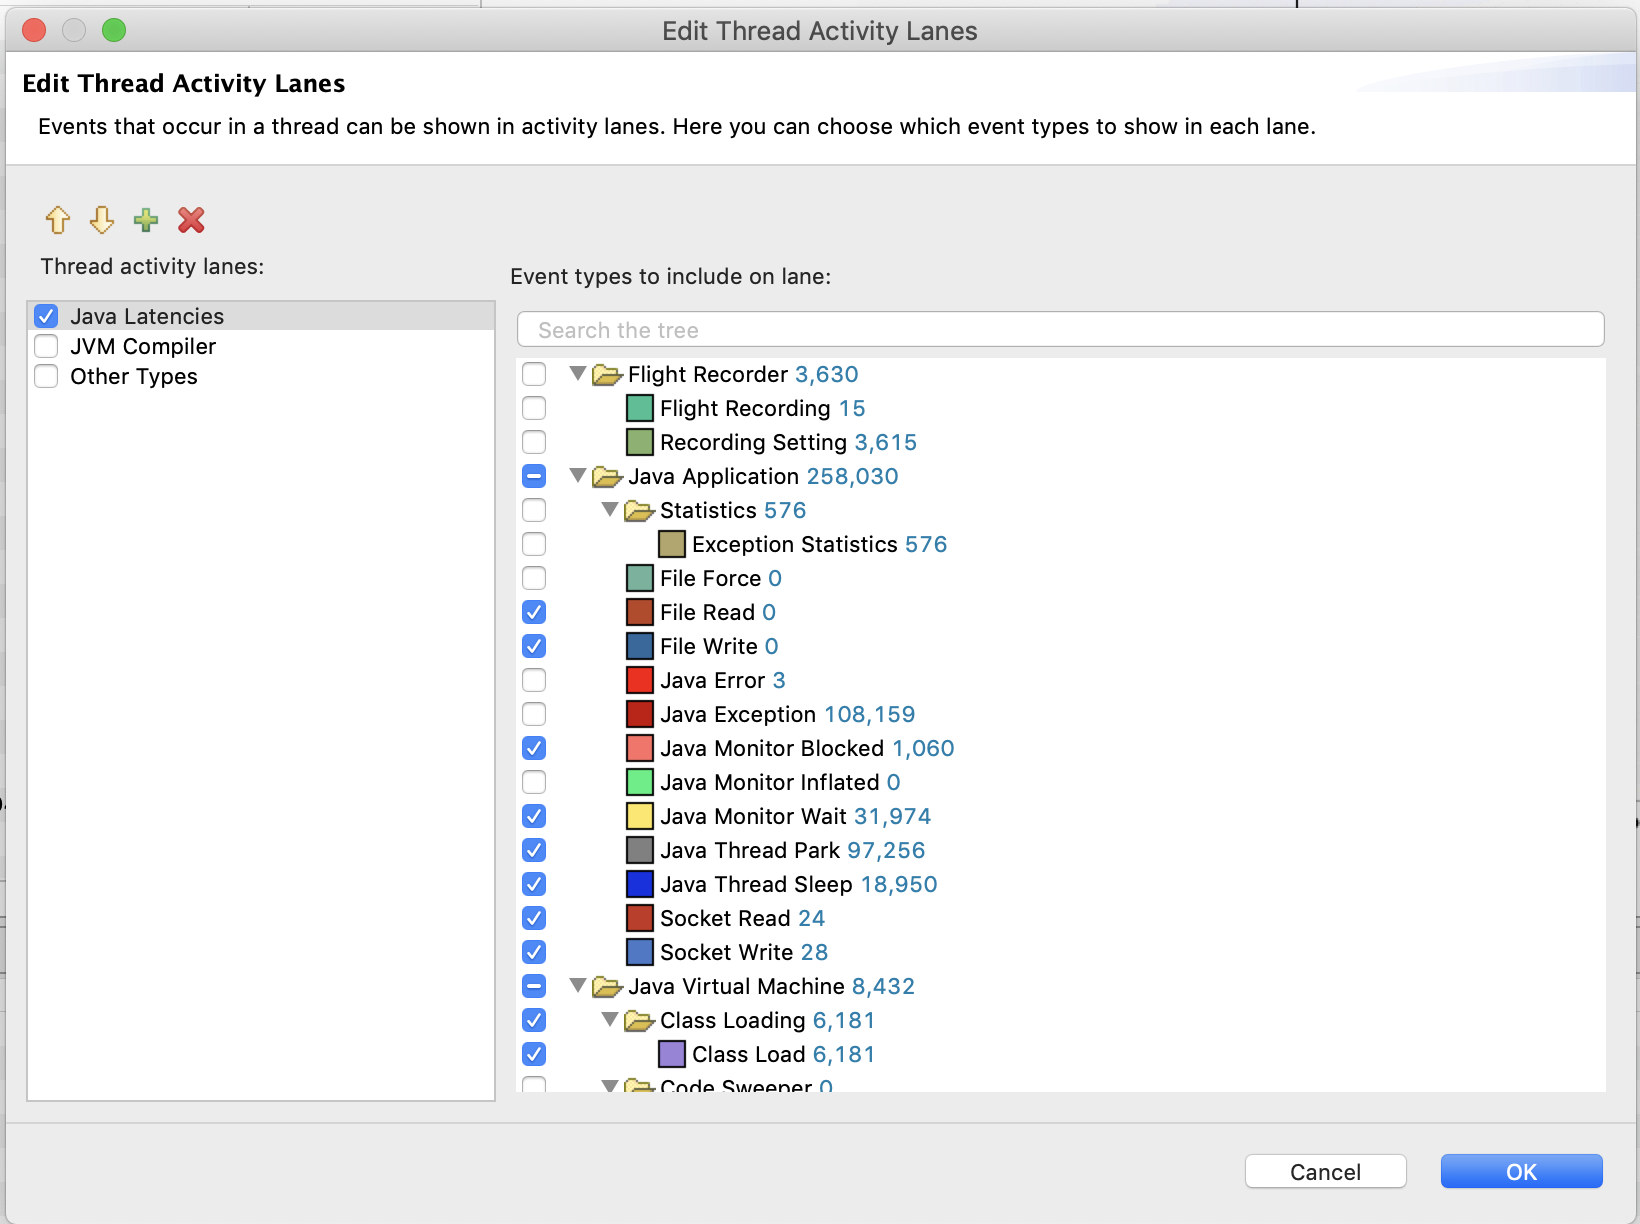
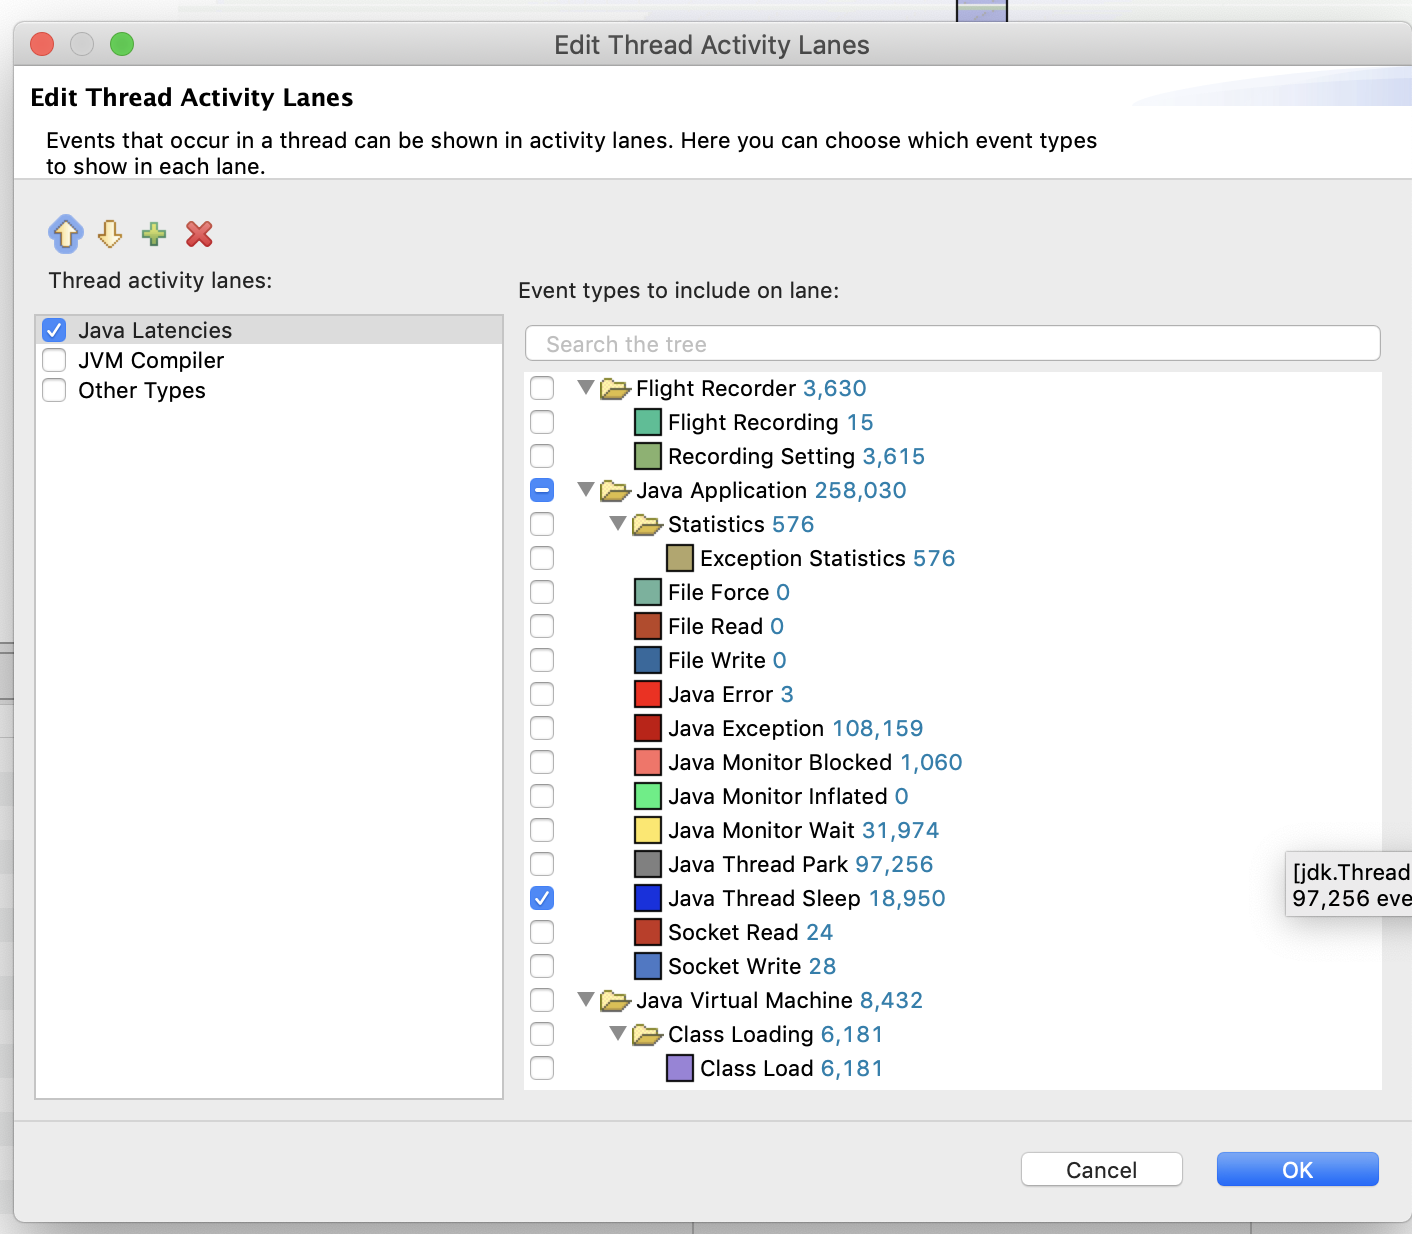
We can then narrow down on specific events.
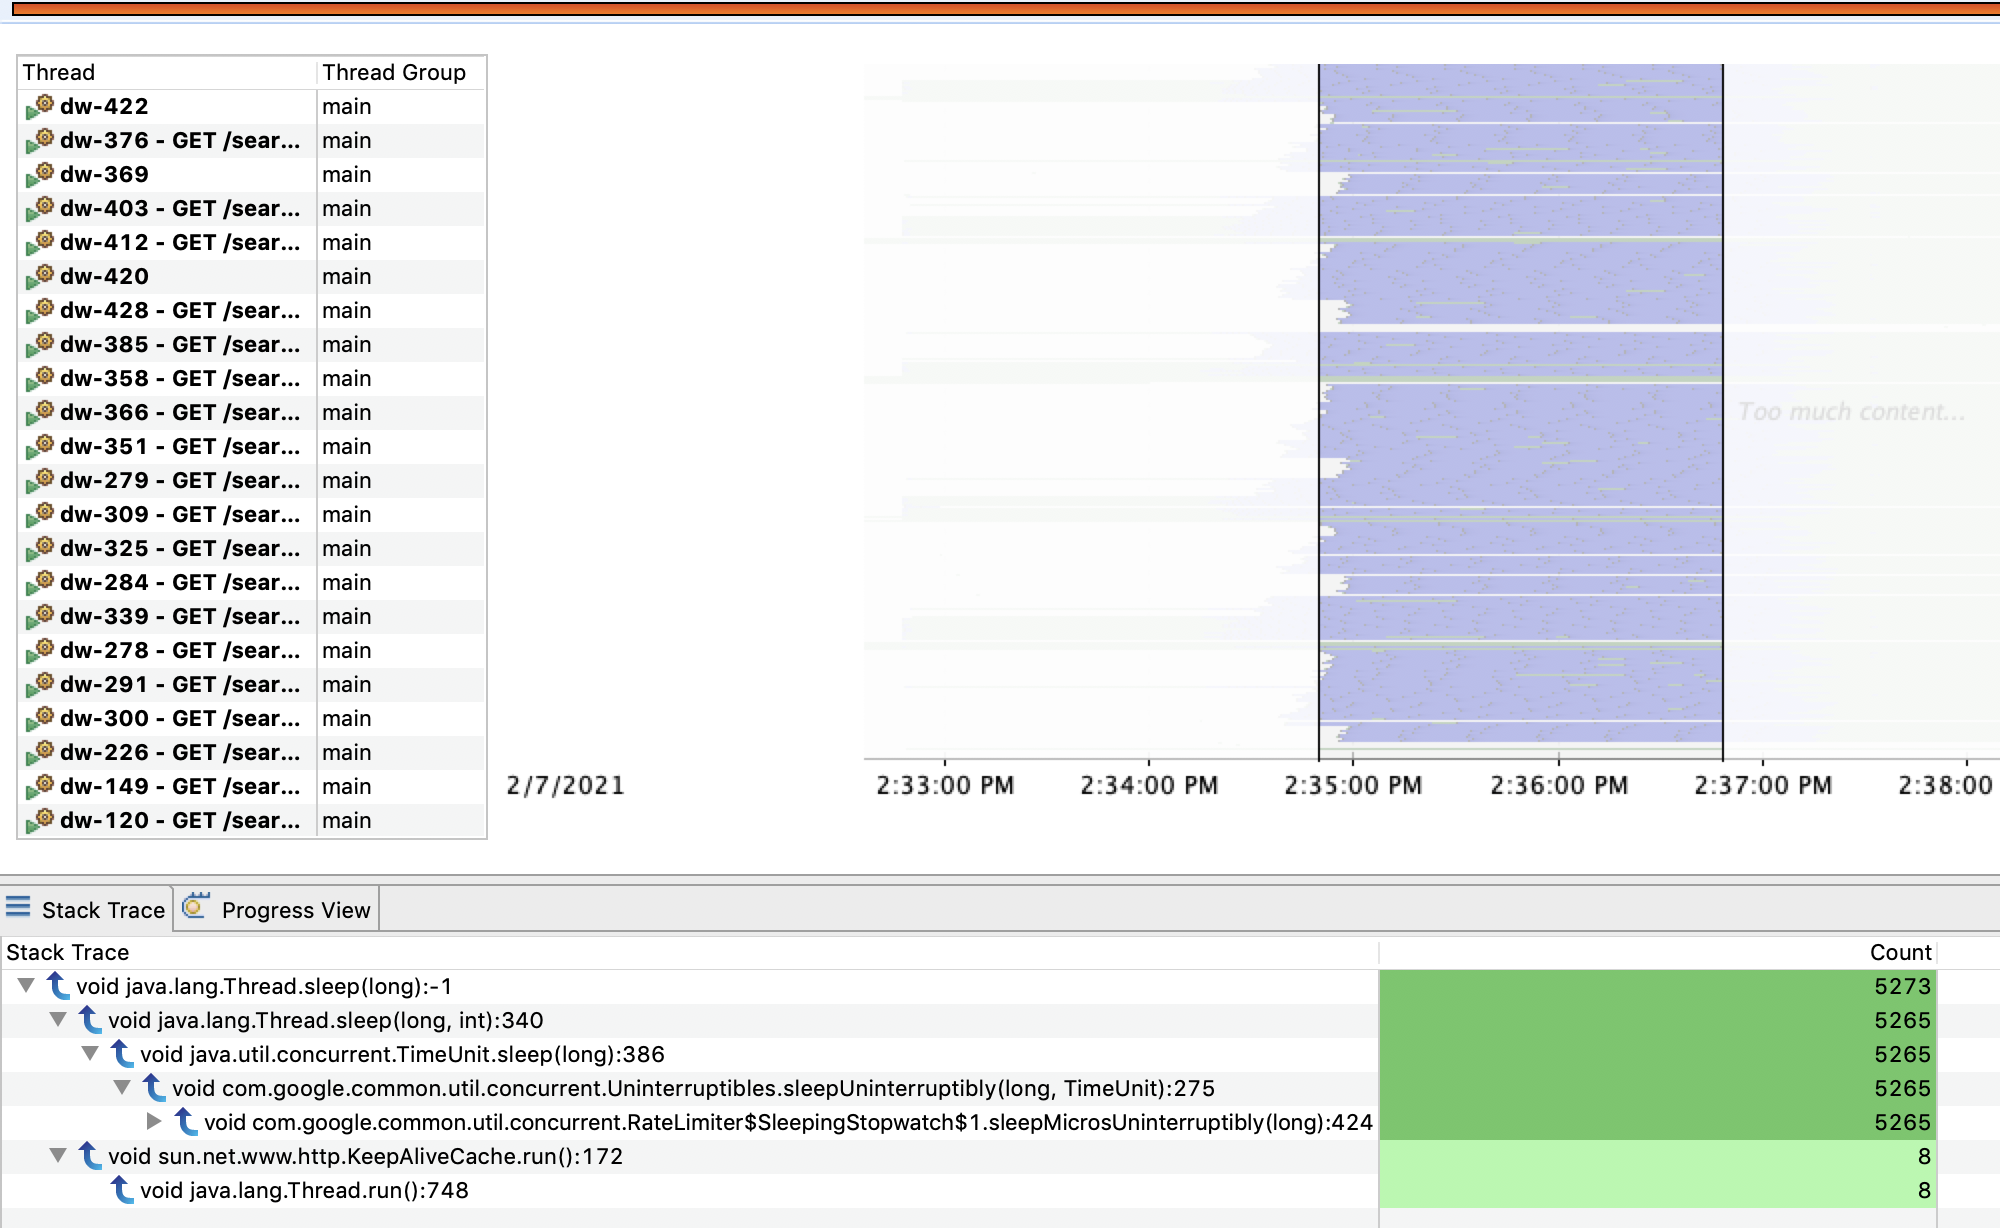
For the purpose of this section filter on only the Sleep events. Then, select a period of time and look at what has caused our threads to go to sleep for that particular period:
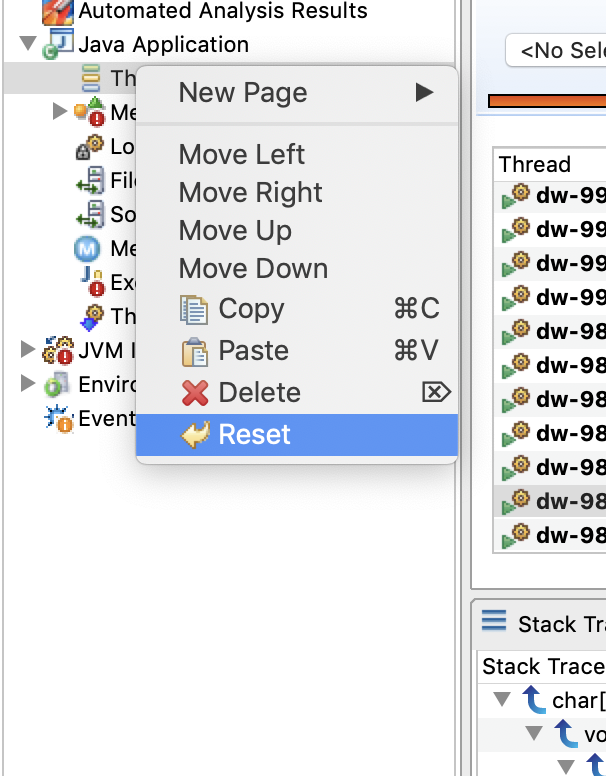
Once you’re done with the filtered view, right click on the Thread page and Reset the page (to return to the default state).
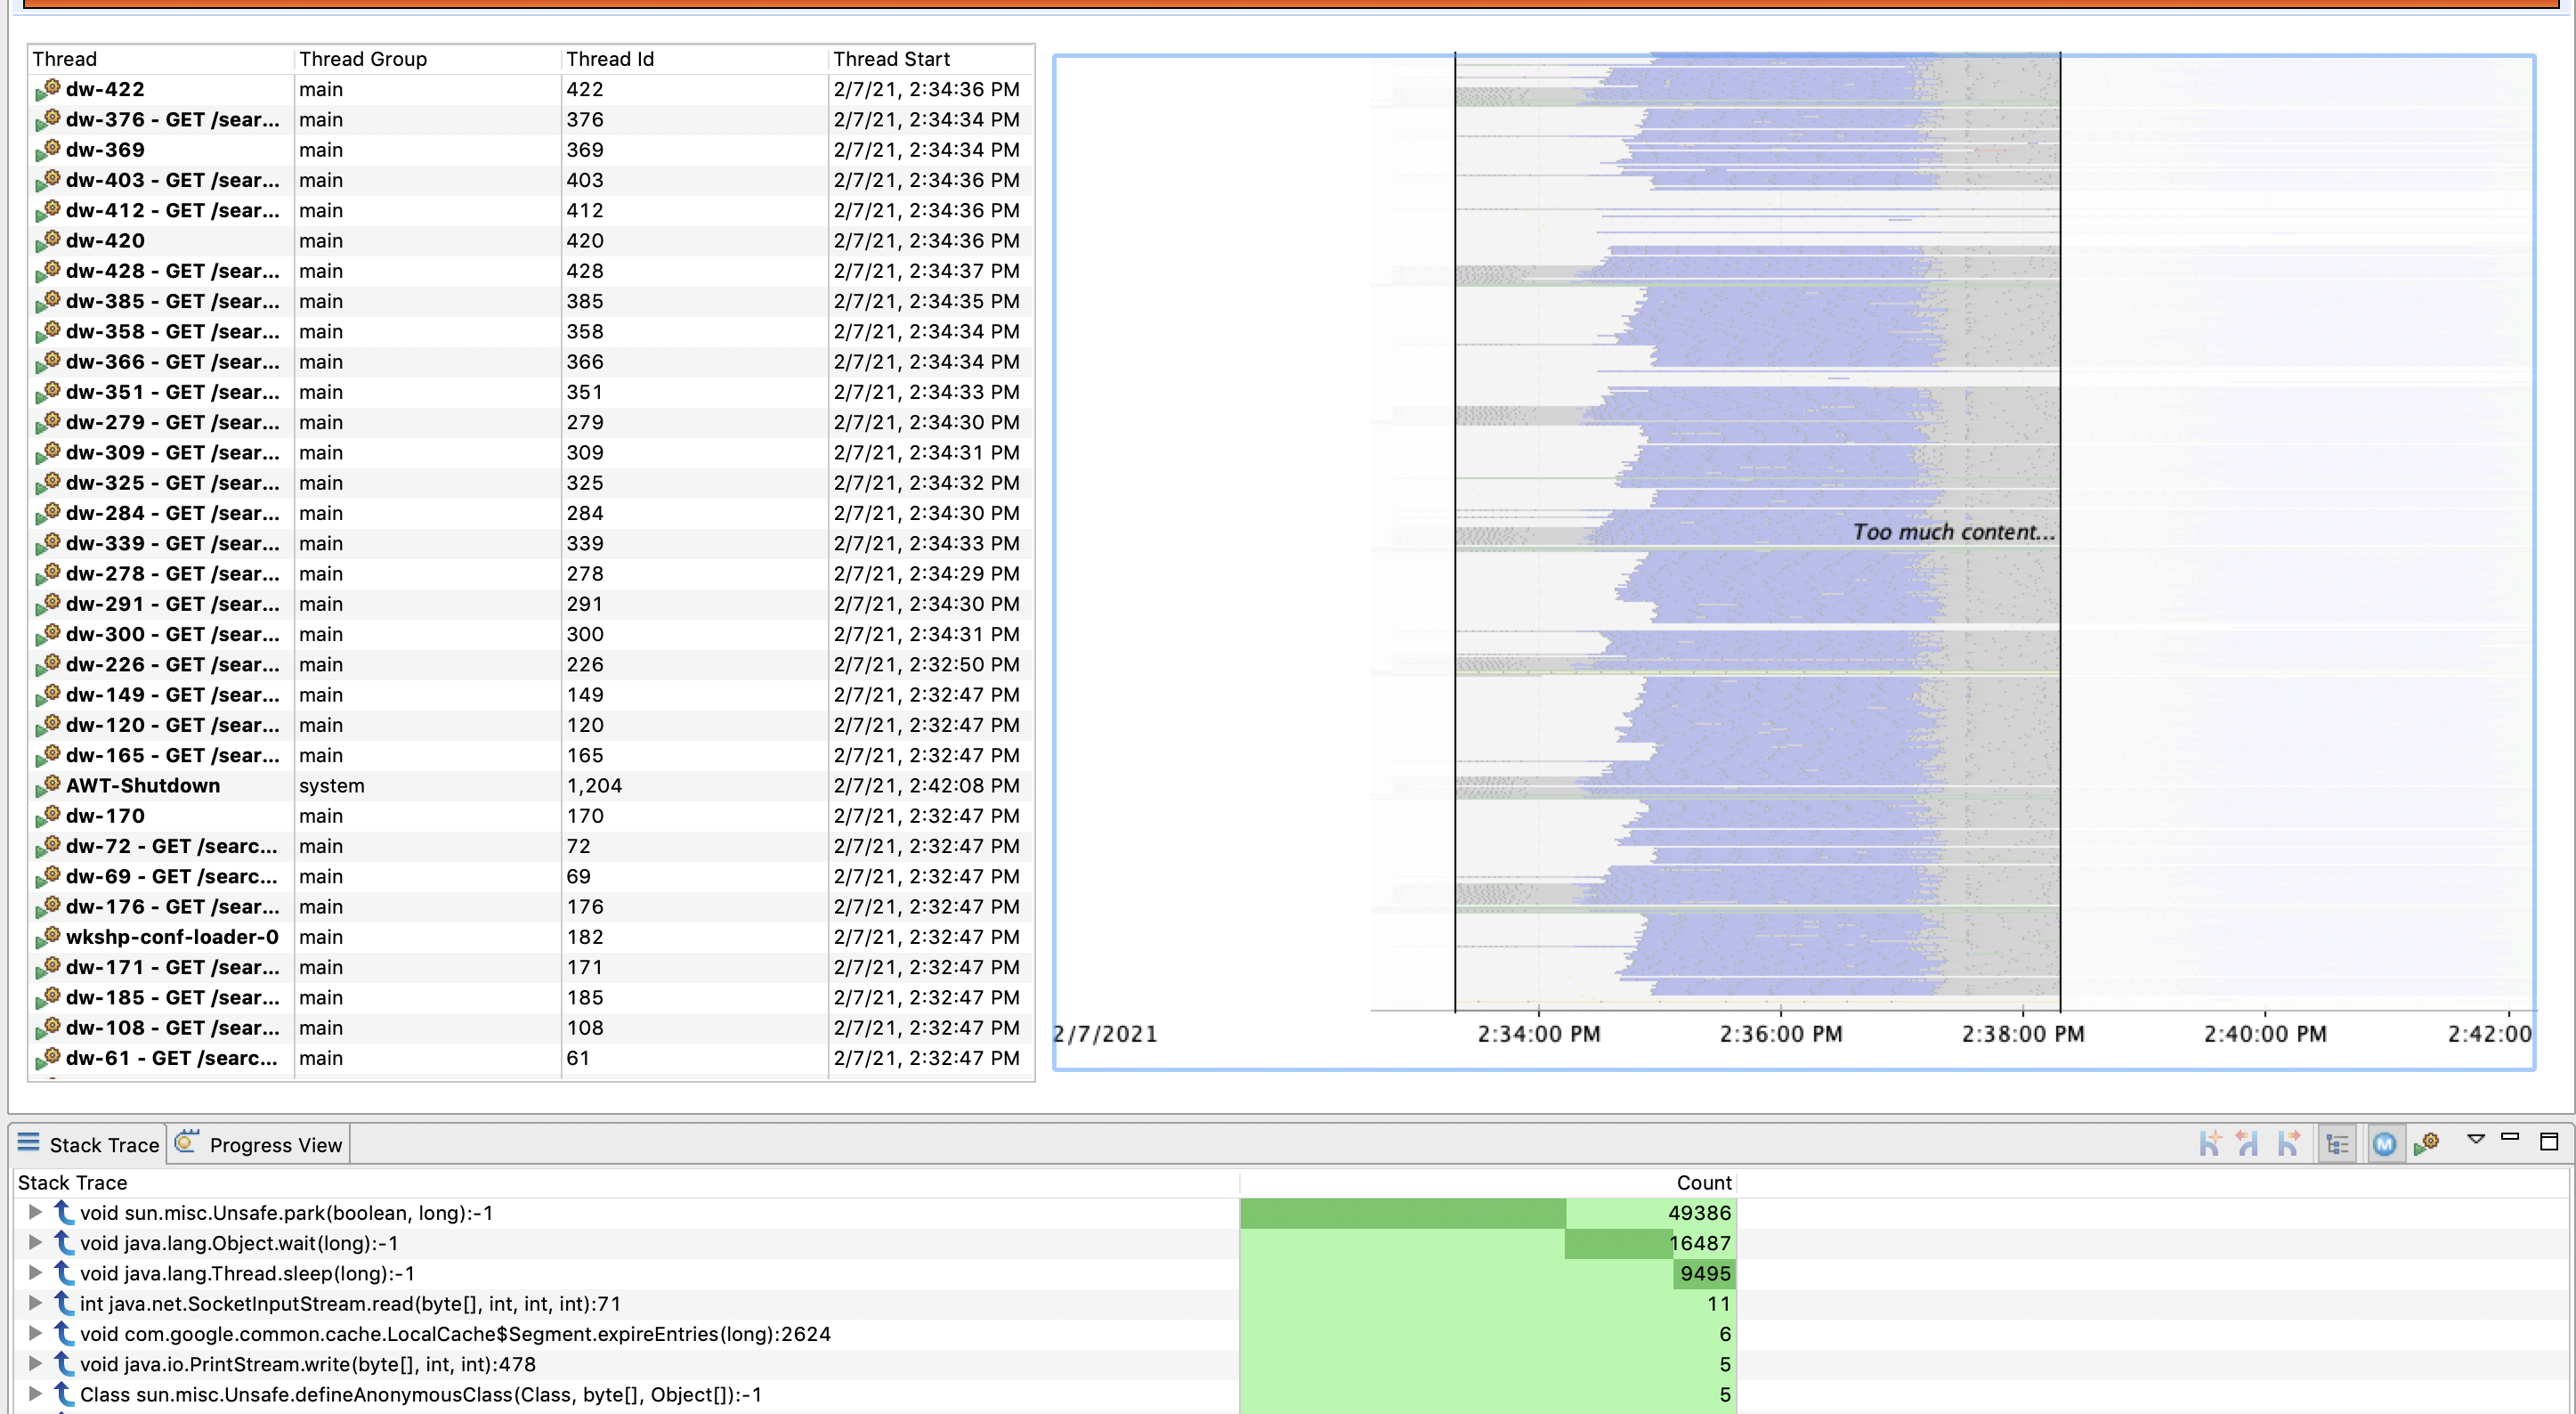
By Thread
We can select an individual thread from the Thread Table to further filter the data just for that thread. From this filtered view, we can inspect what the commonly executed methods are for a particular thread.
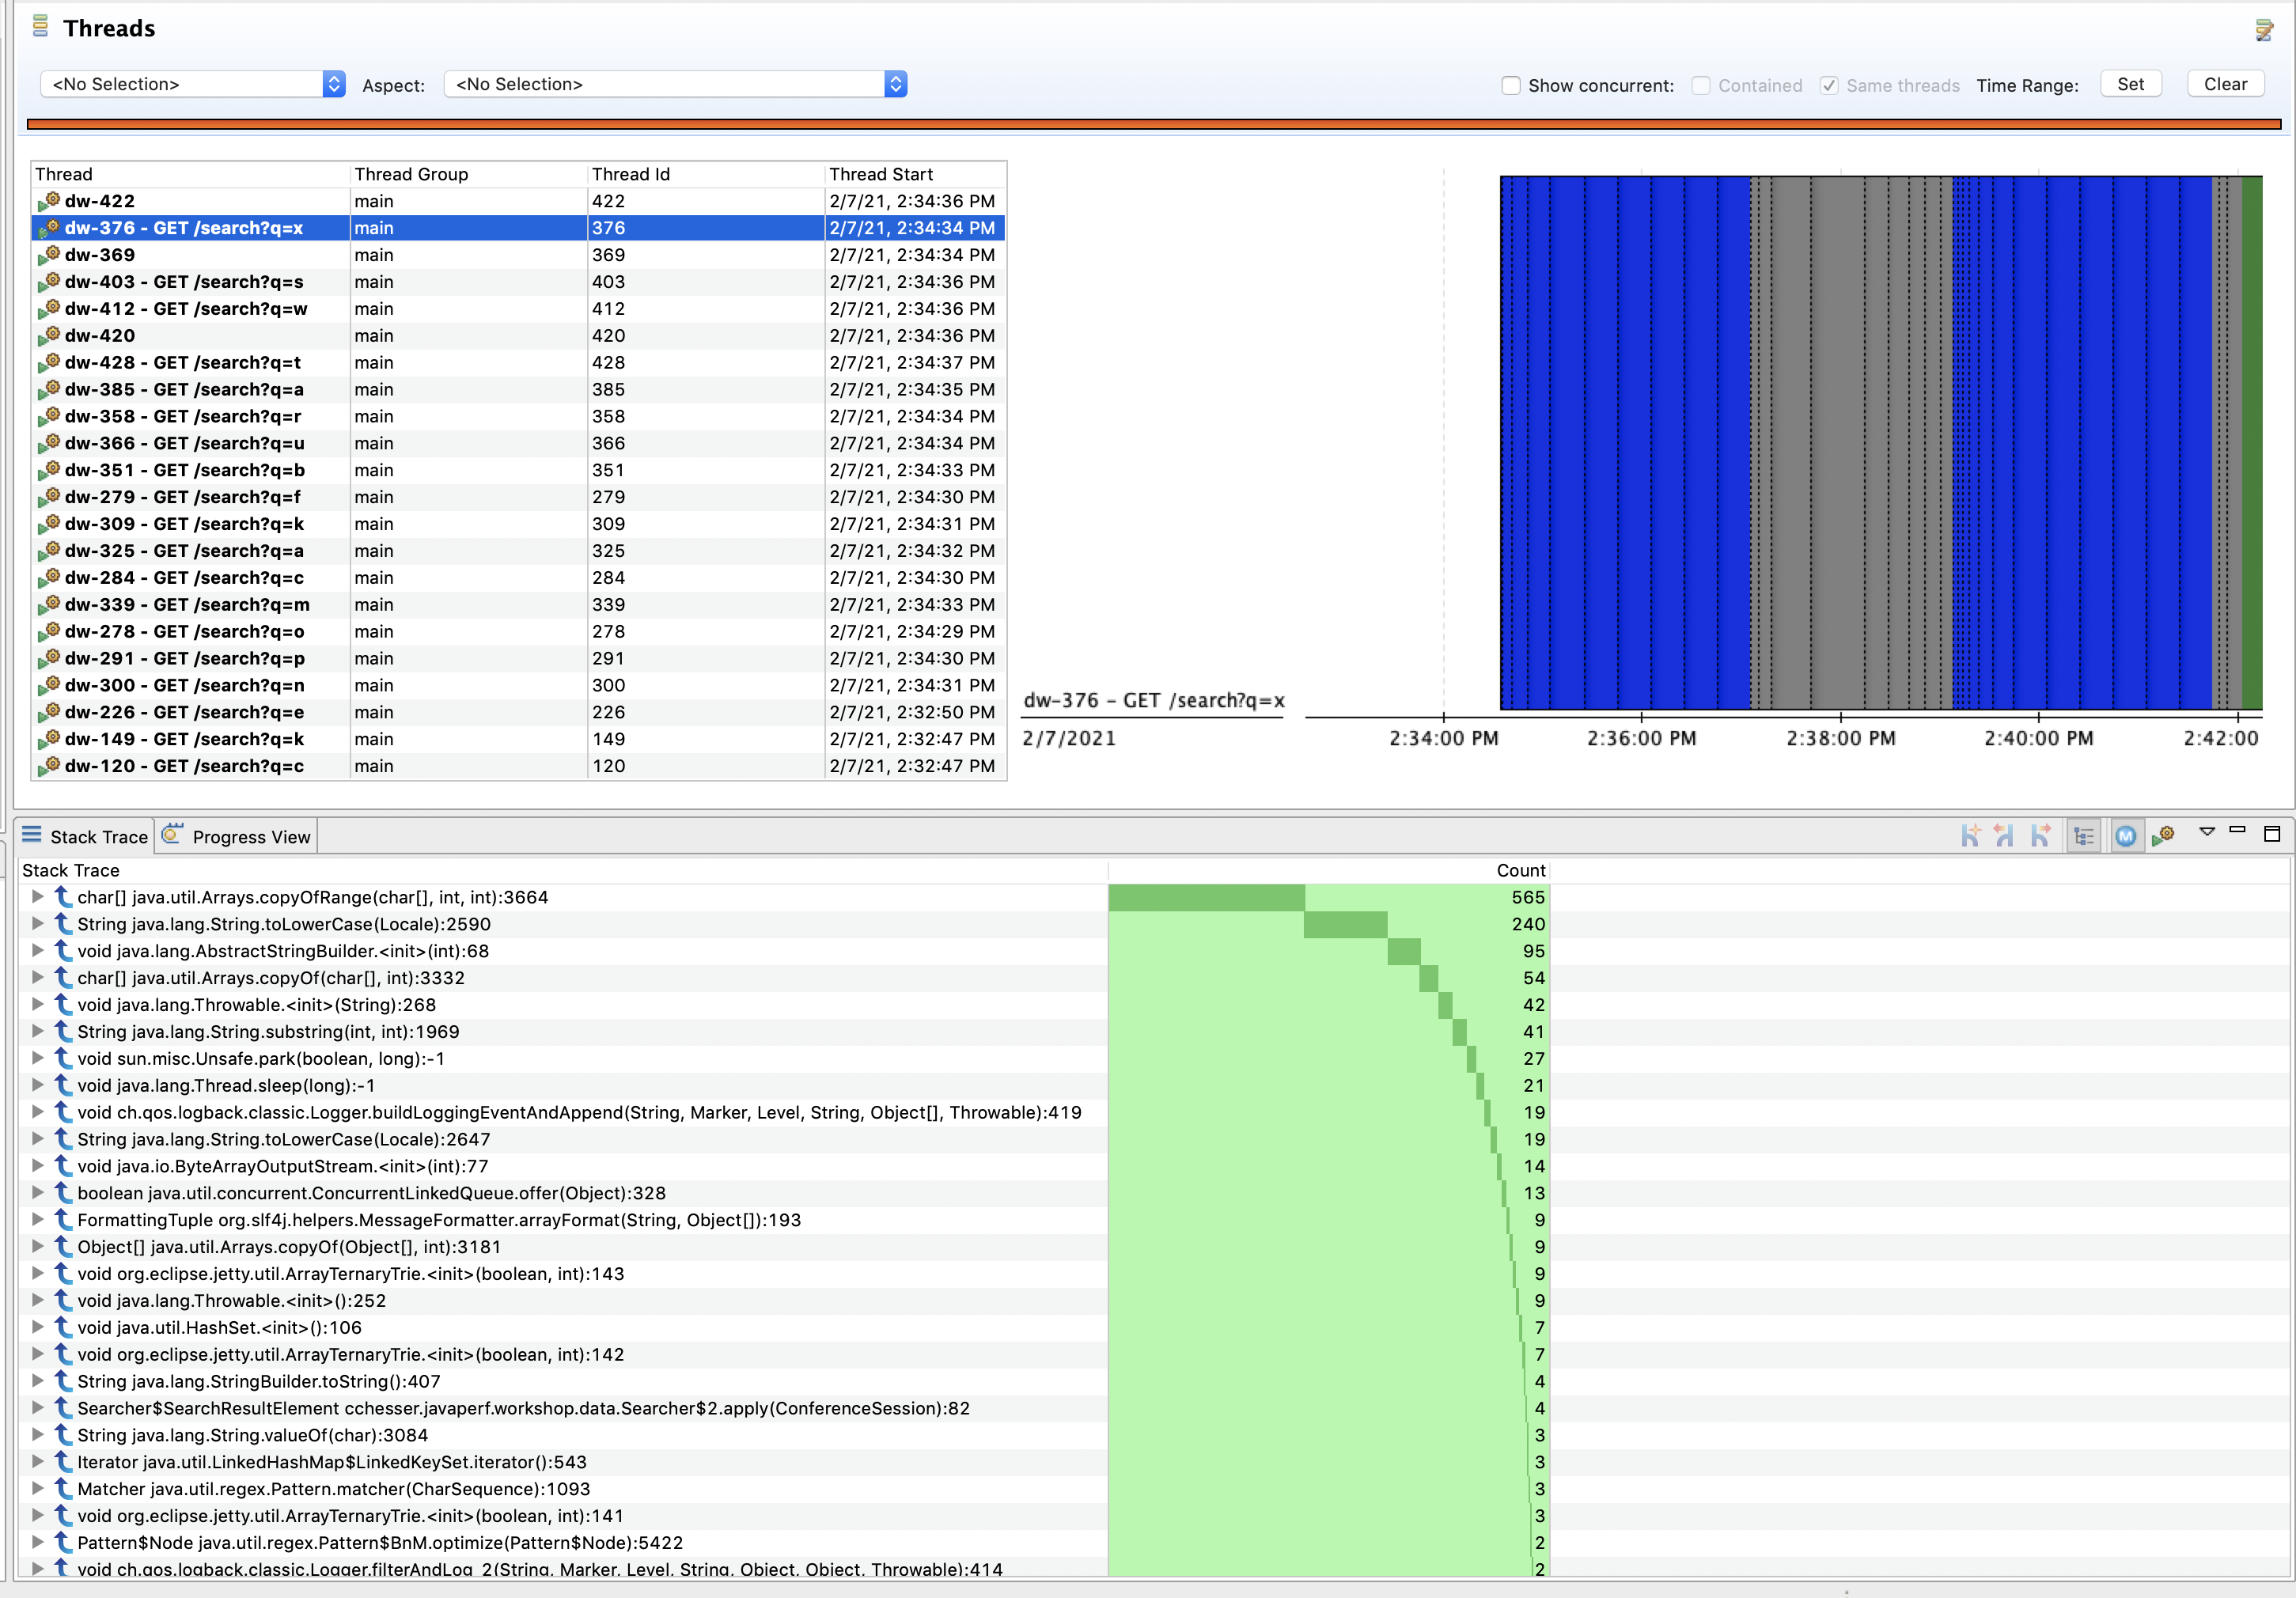
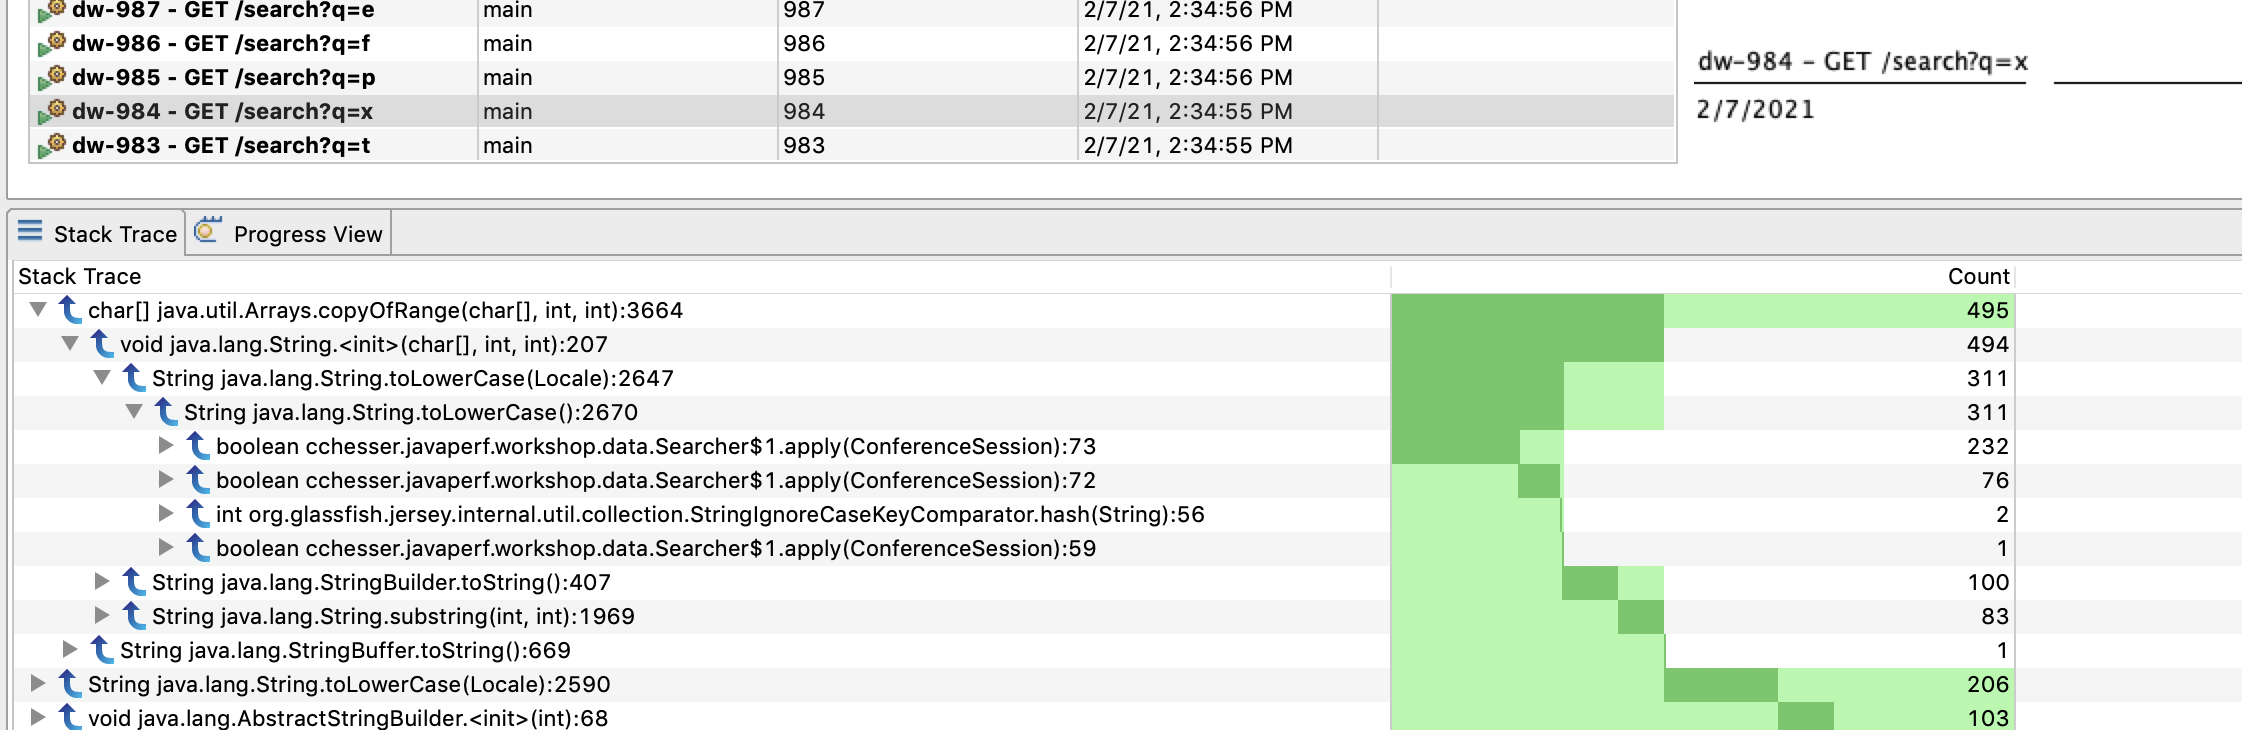
We can then use the stacktrace view to correlate what piece of code executed the most.
Explore
There’s a couple of threads specifically created by our application, these are the wkshp-conf-loader named threads. The dw-* named threads are threads created by DropWizard to handle specific requests (you might have noticed this based on the name containing a REST Resource). Explore the state of some of these threads while thinking about the follow up questions.
Follow Ups
- Where are we spending most of our time sleeping? What is causing this?
- Are there any unnecessary method invocations? Are any threads doing work that isn’t visible?
Up Next
In the next section, we'll look at the Memory state of our application.
Memory5 - Memory
Find the memory cost of events in our application.
The memory page shows us the overall memory usage and garbage collection events for our recording.
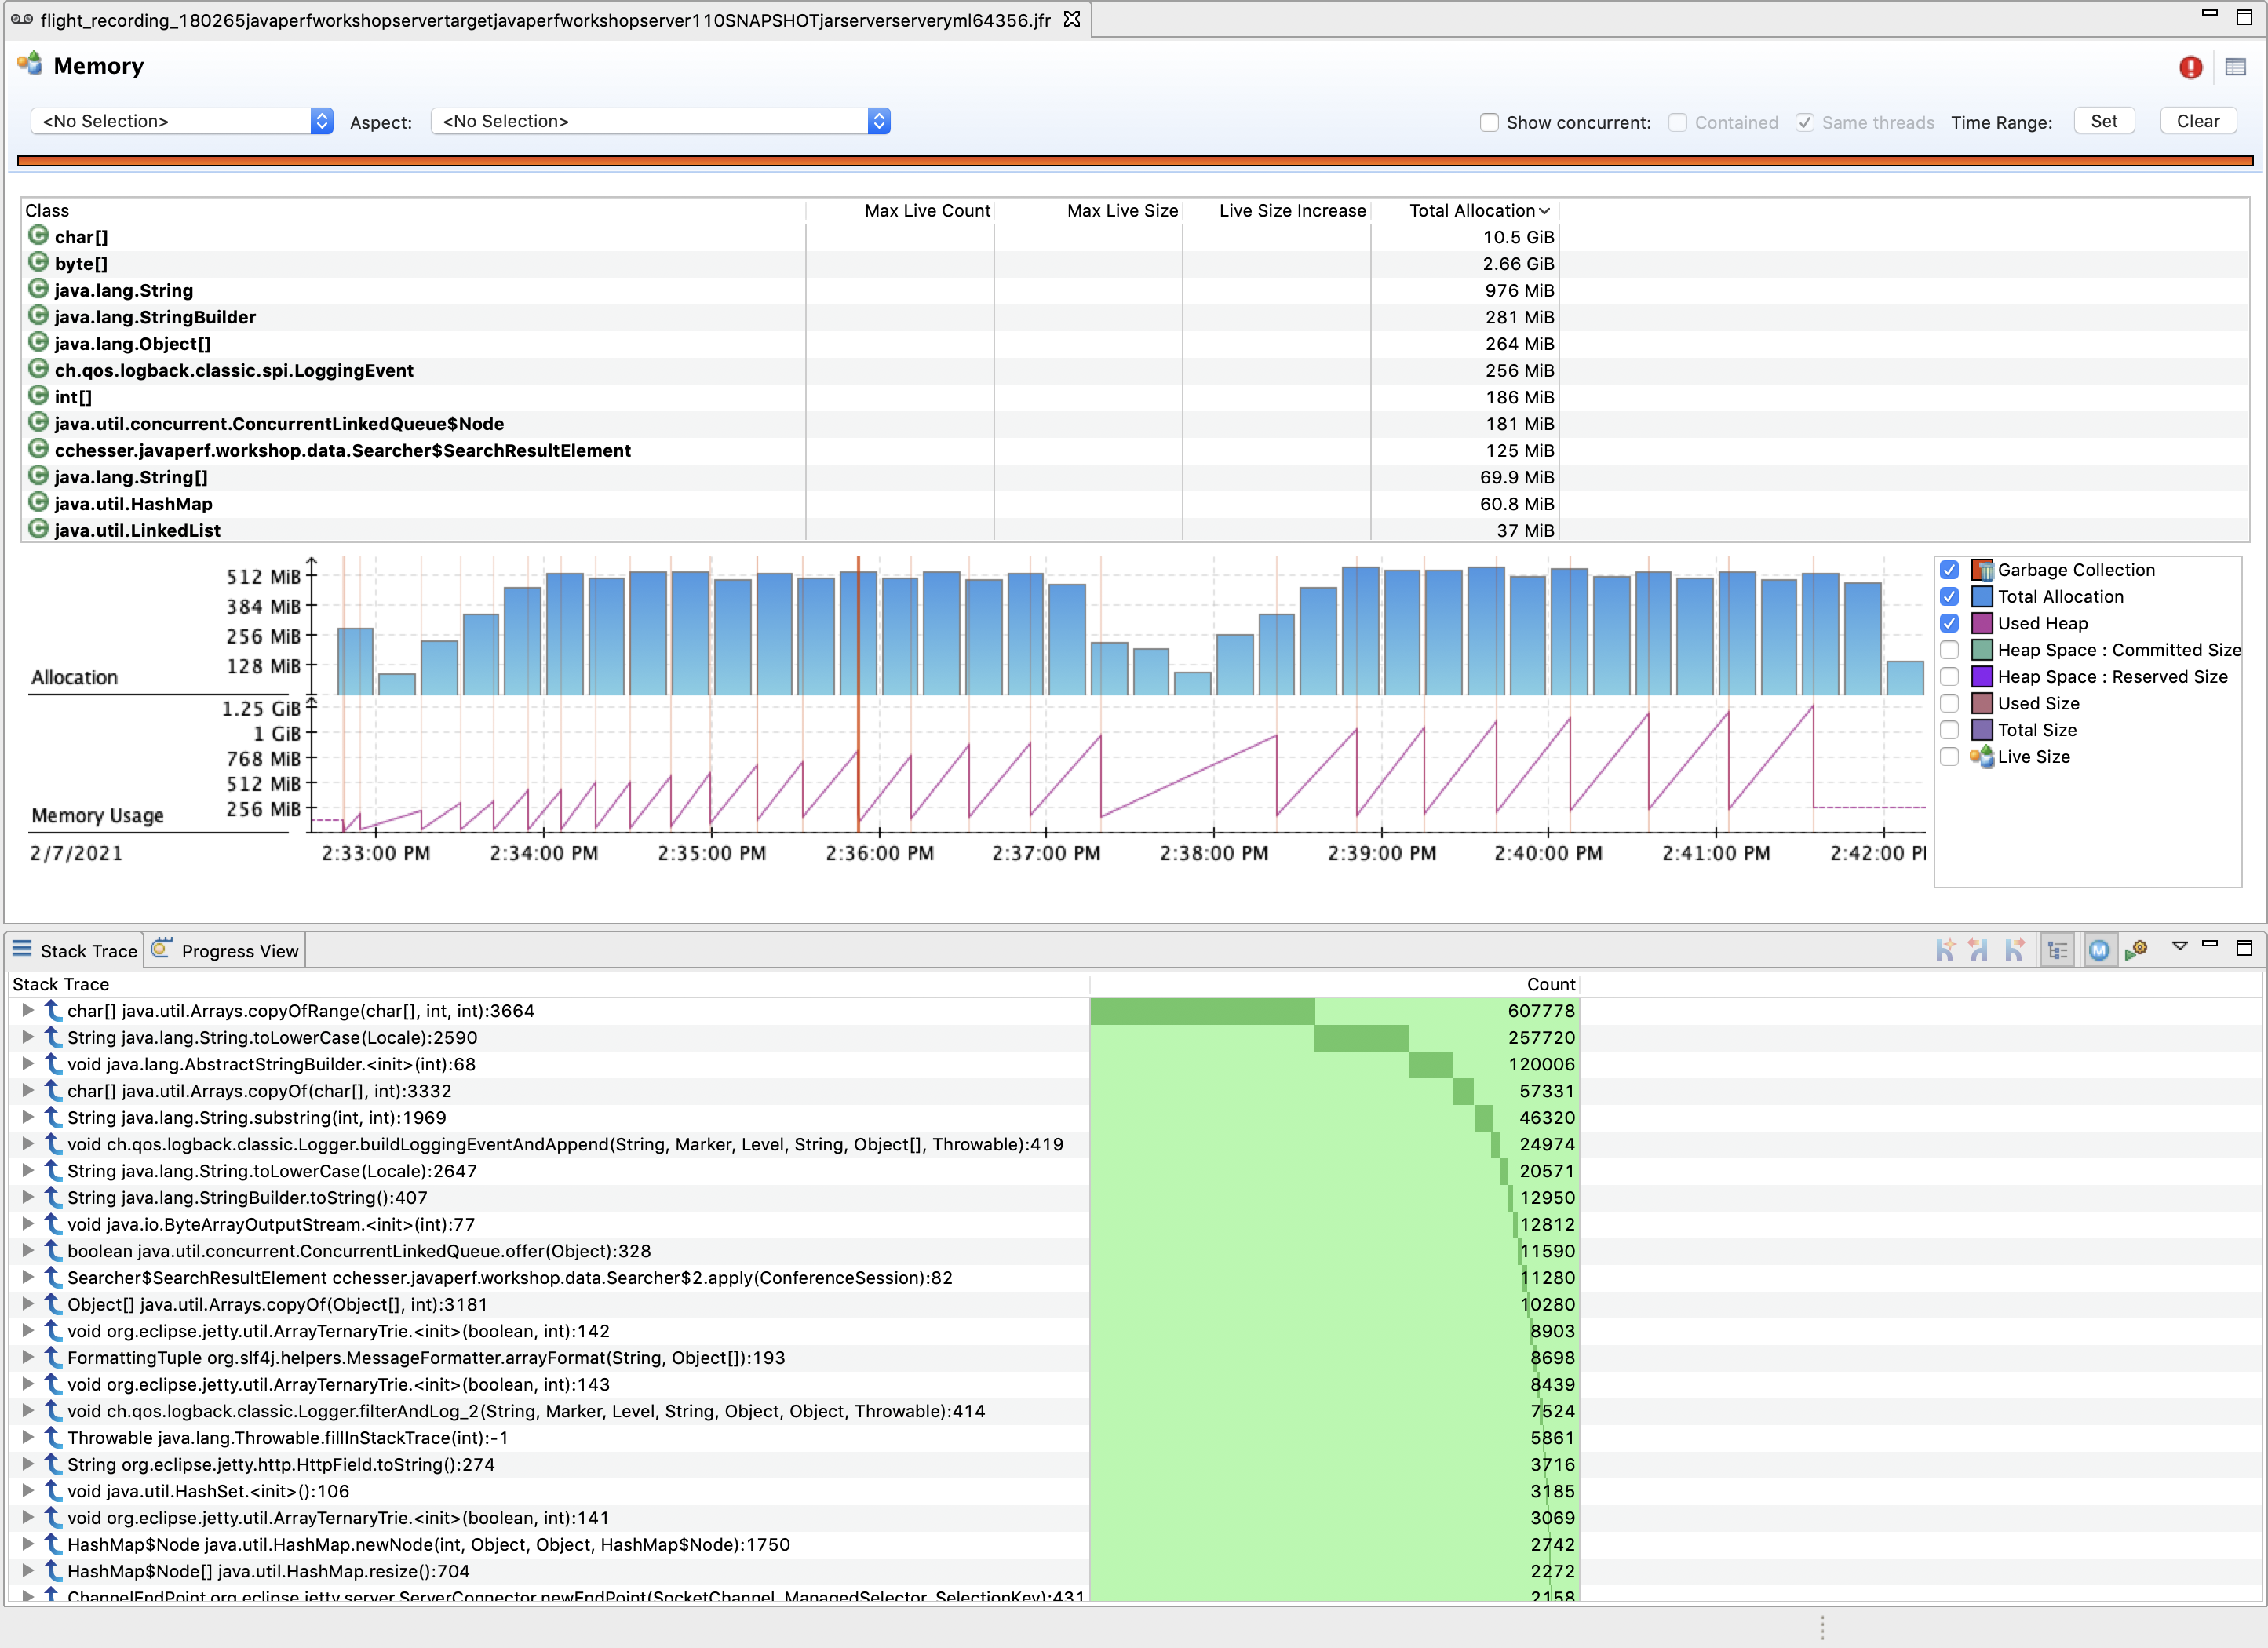
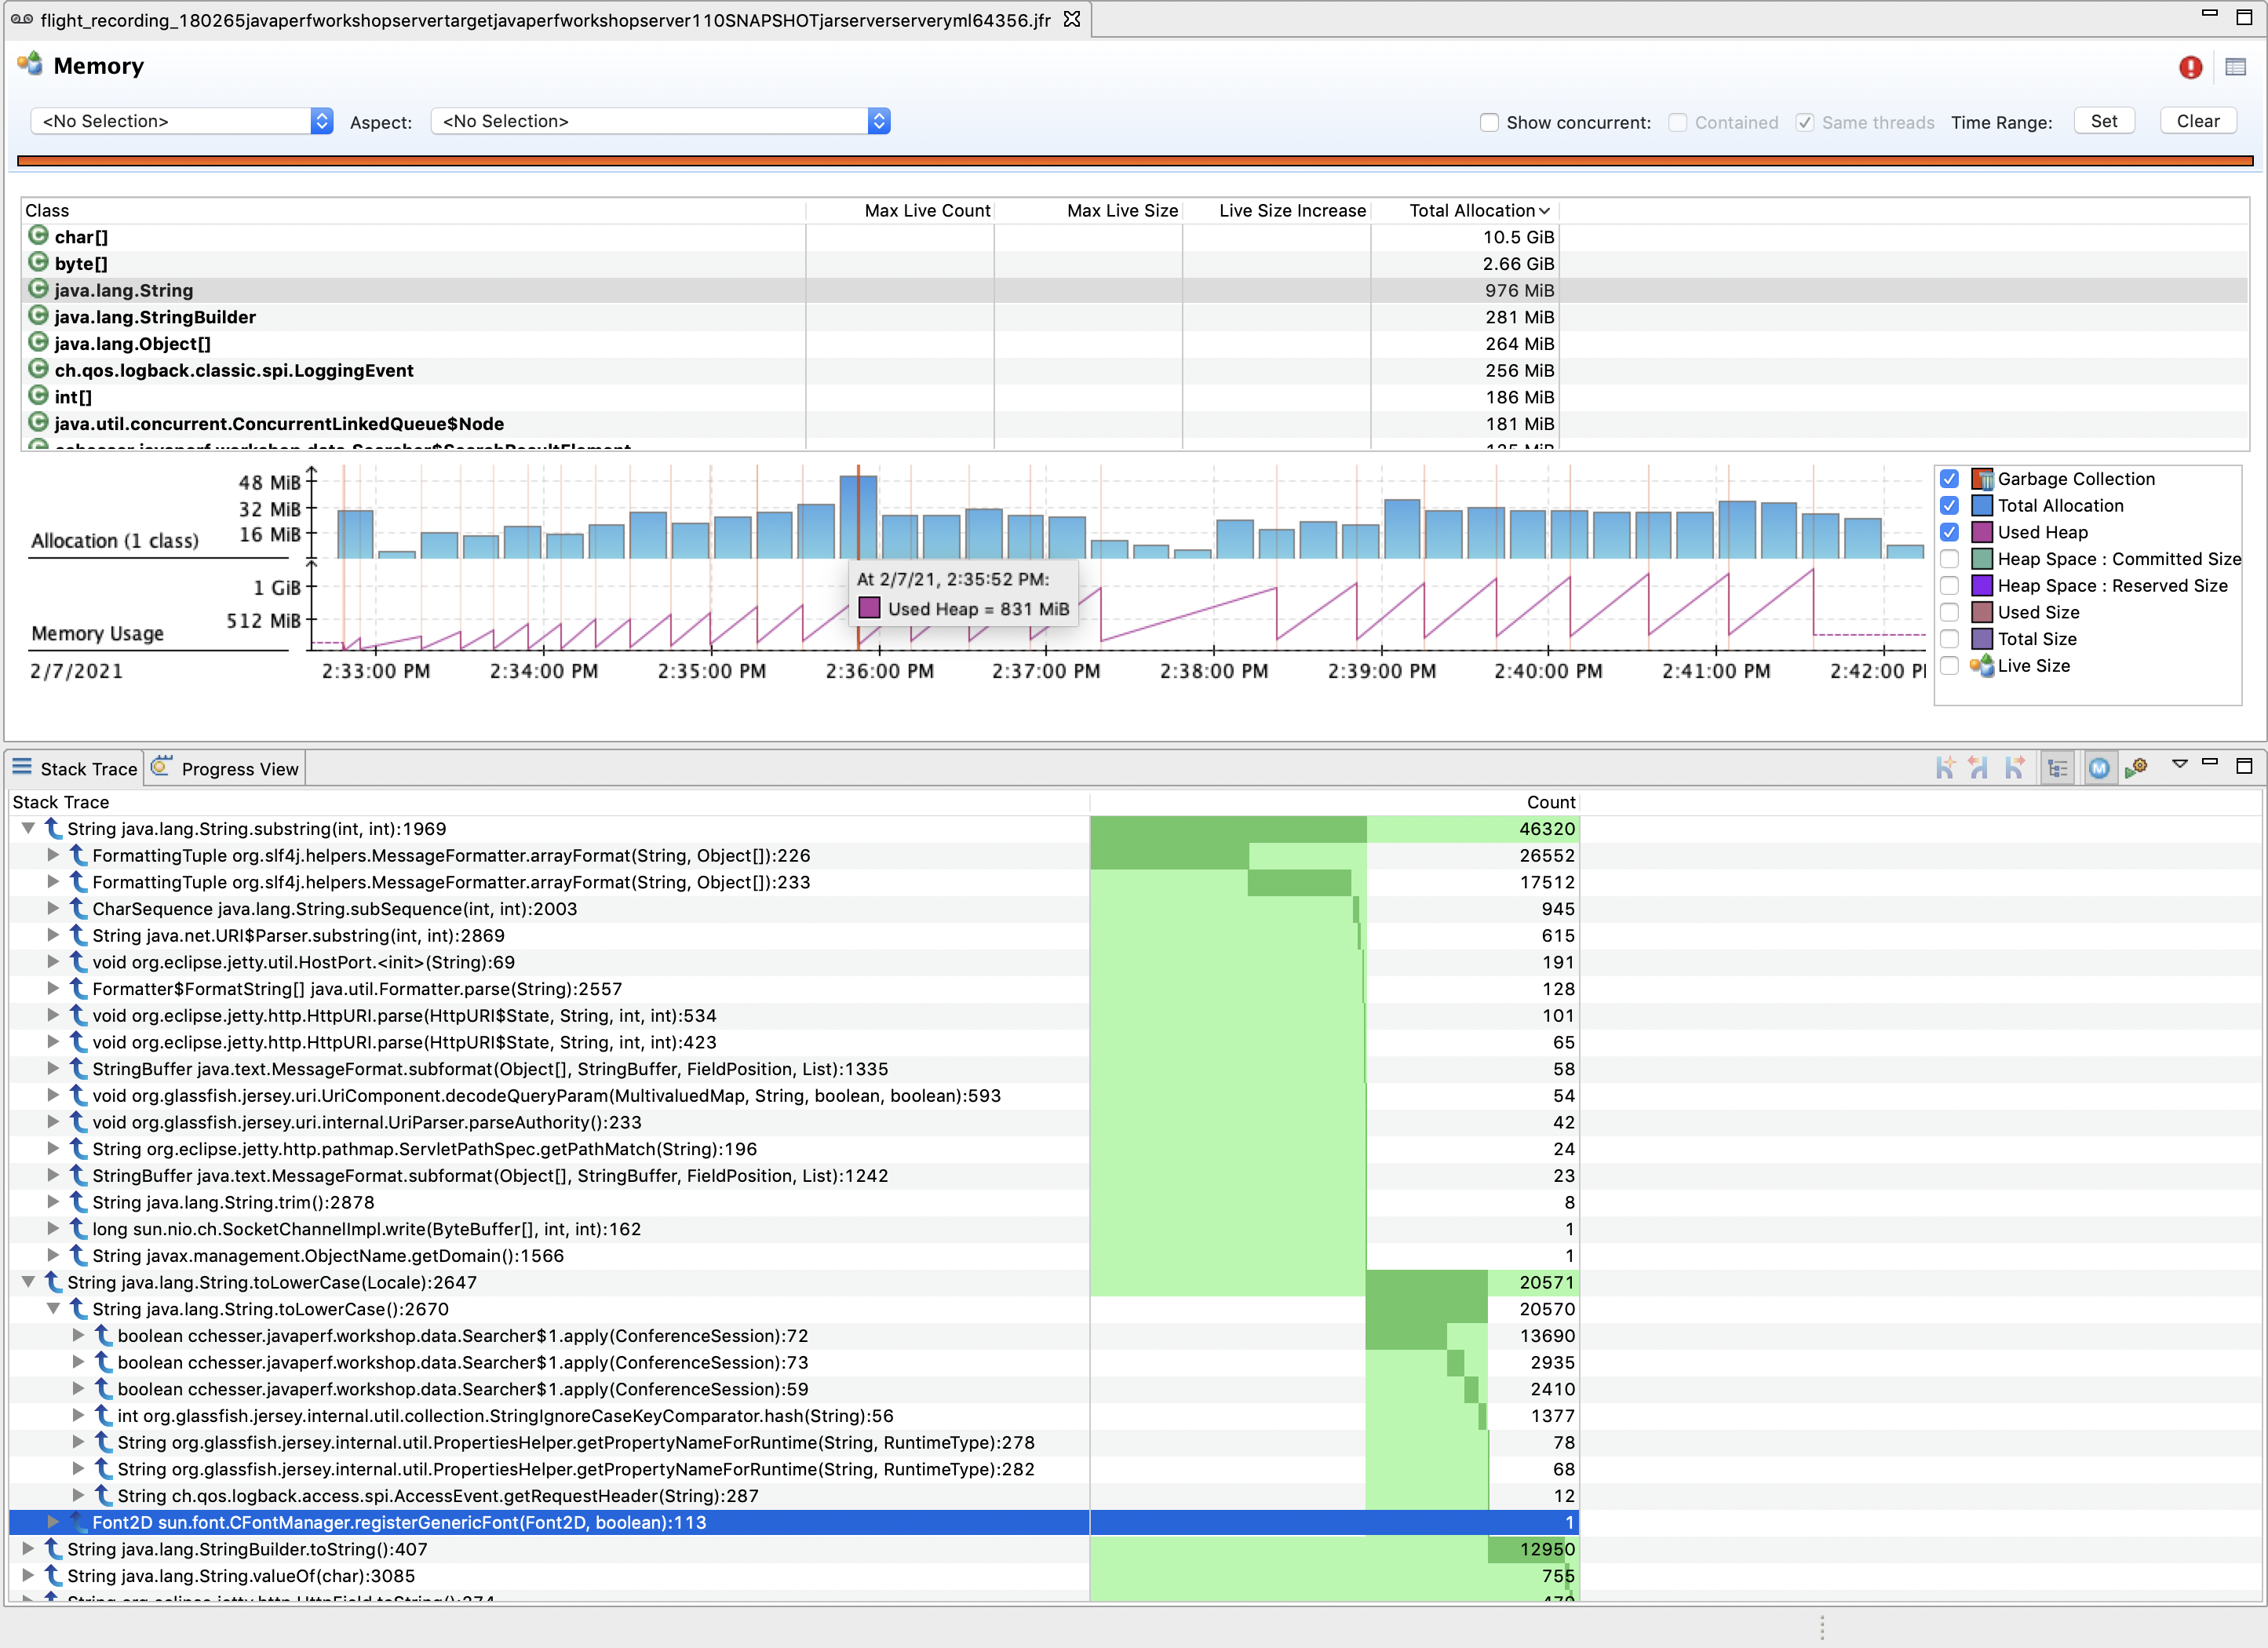
The Class Table lets us view the total memory allocation dedicated to particular instances of that class. Selecting a particular class will allow us to view what code paths are responsible for creating those objects.
We can also filter this view to a particular range in time, for example a range where we went from low to high heap usage:
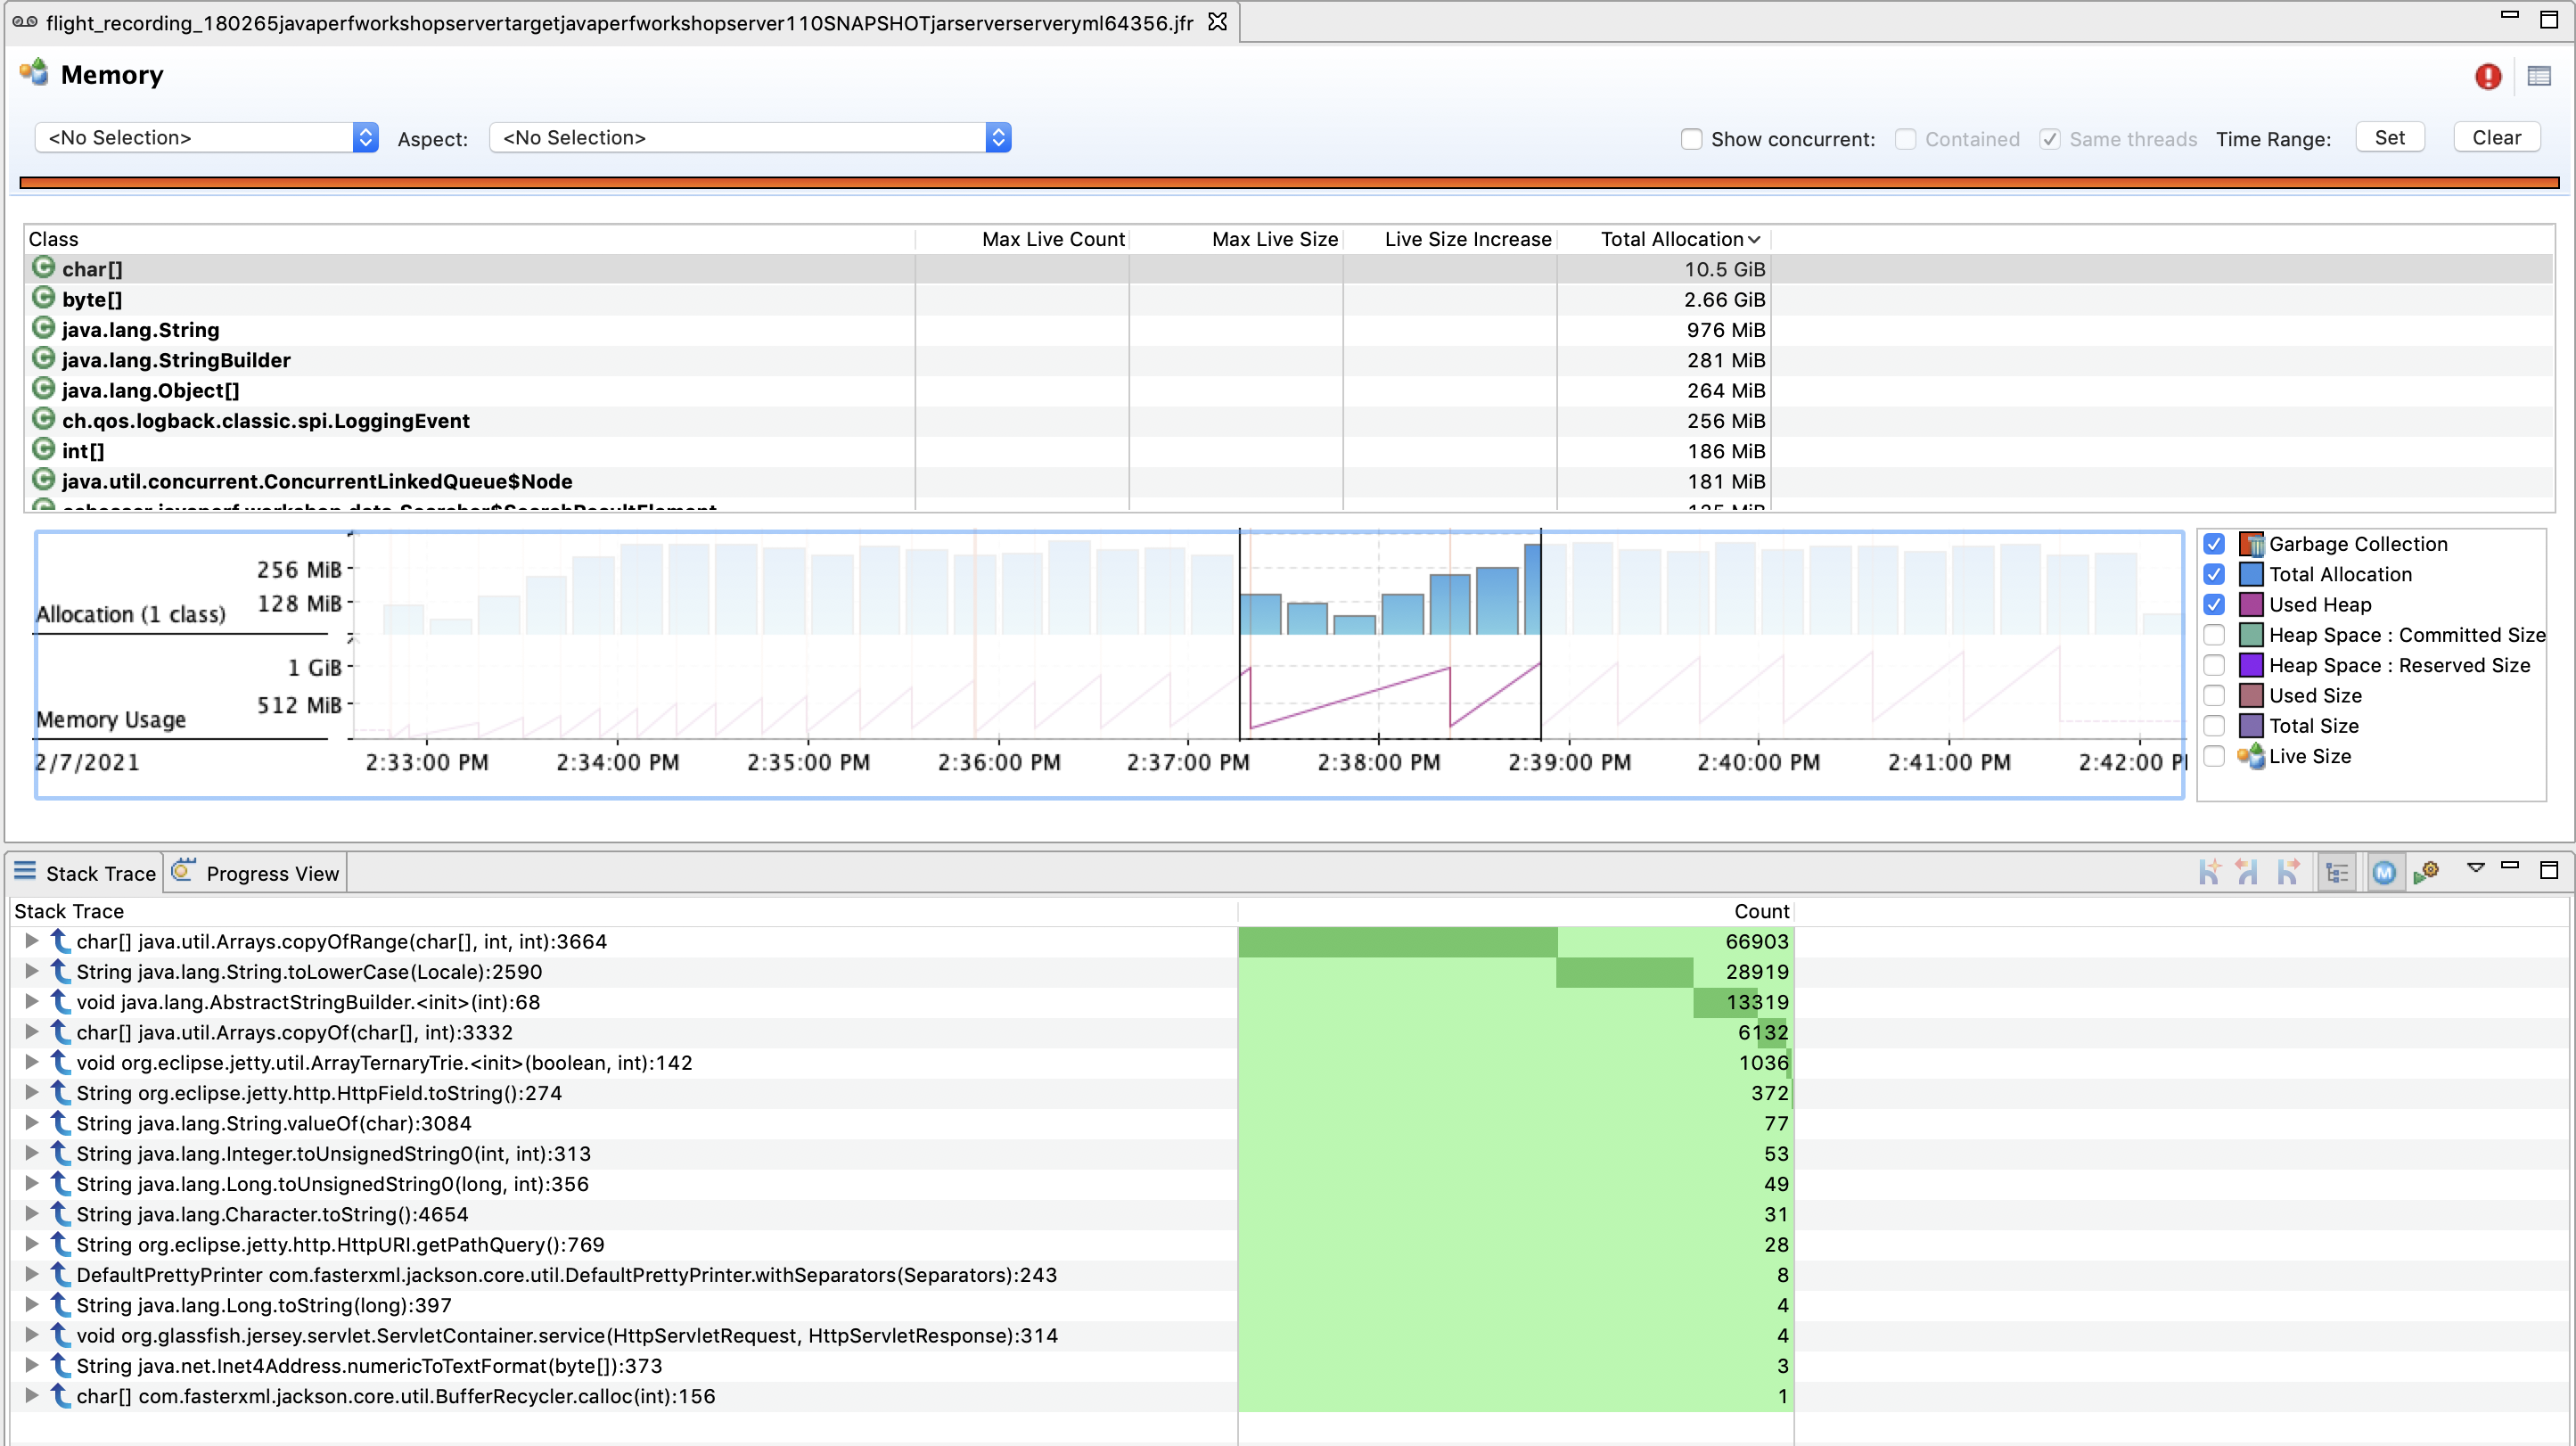
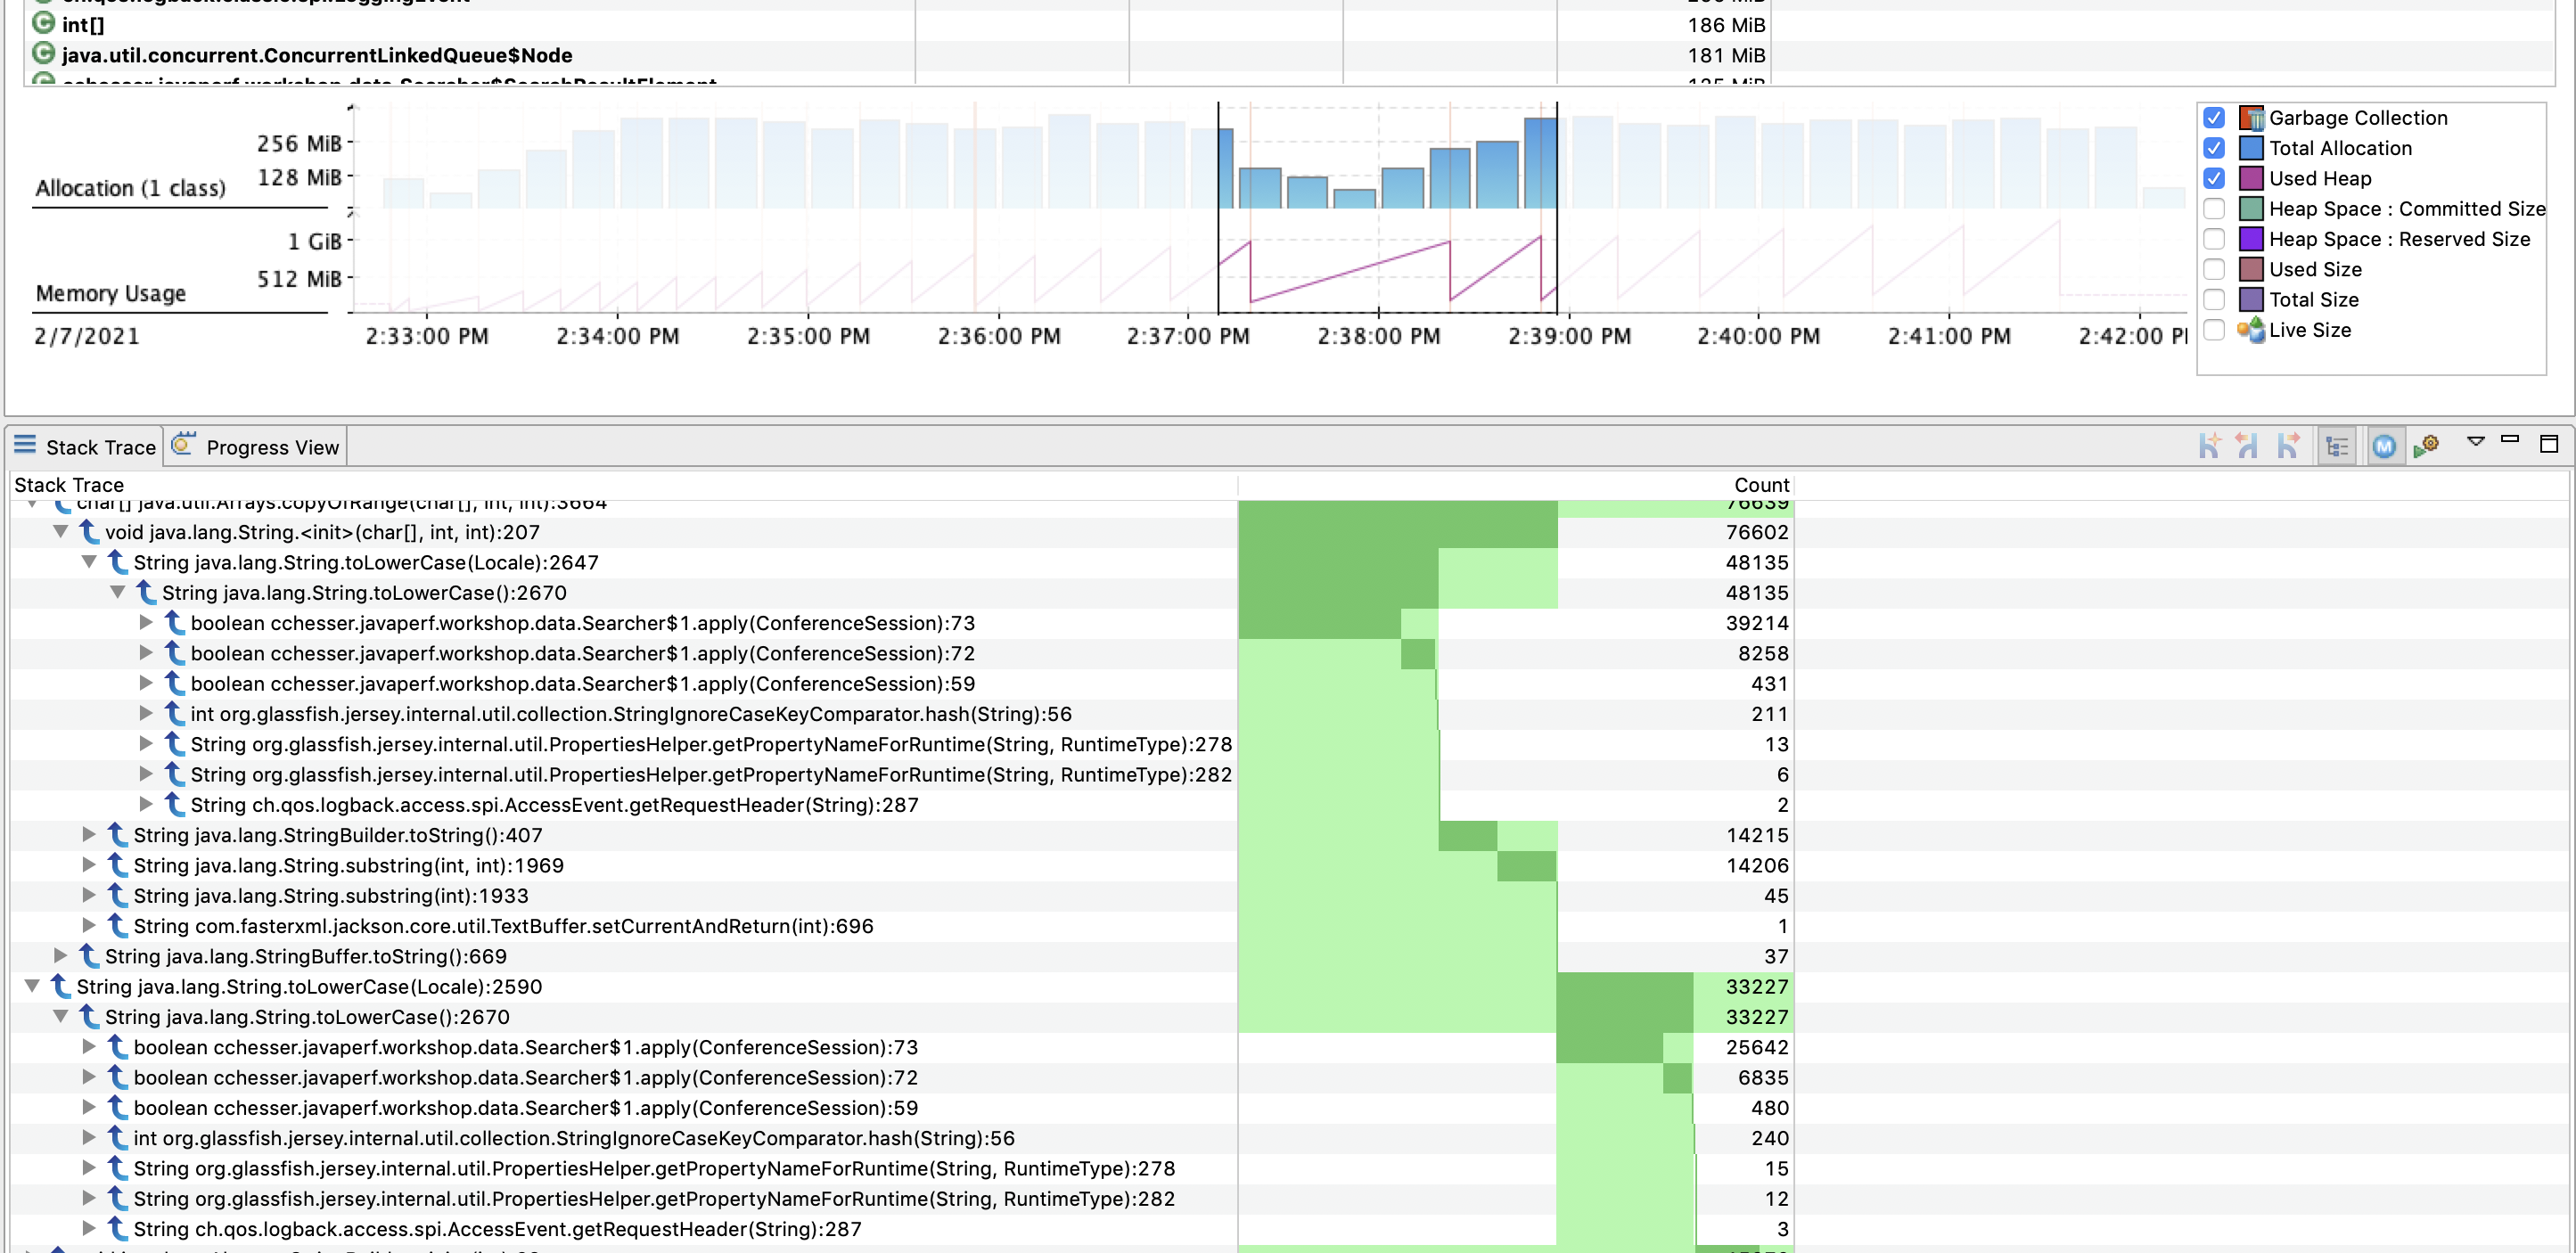
We can then use this filtered view and drill down through the stack trace to find methods of interest:
Explore
Narrow down through some periods of time where our heap rose quickly and then was collected. Look at the memory reclaimed after each collection.
Follow Ups
- What are the most commonly allocated classes? Where do they come from?
- Are there any classes we own that are also high on the allocation list?
- Expand the memory usage chart and only chart the Used Heap, do you notice a pattern?
- What do you think caused the flat line at the end of the chart?
Up Next
In the next section, we'll look at the I/O used by our application.
I/O Operations6 - I/O Operations
Find the interactions with external resources.
The I/O pages can provide context of what external resources you are utilizing from you code base, and relate it to other latency events.
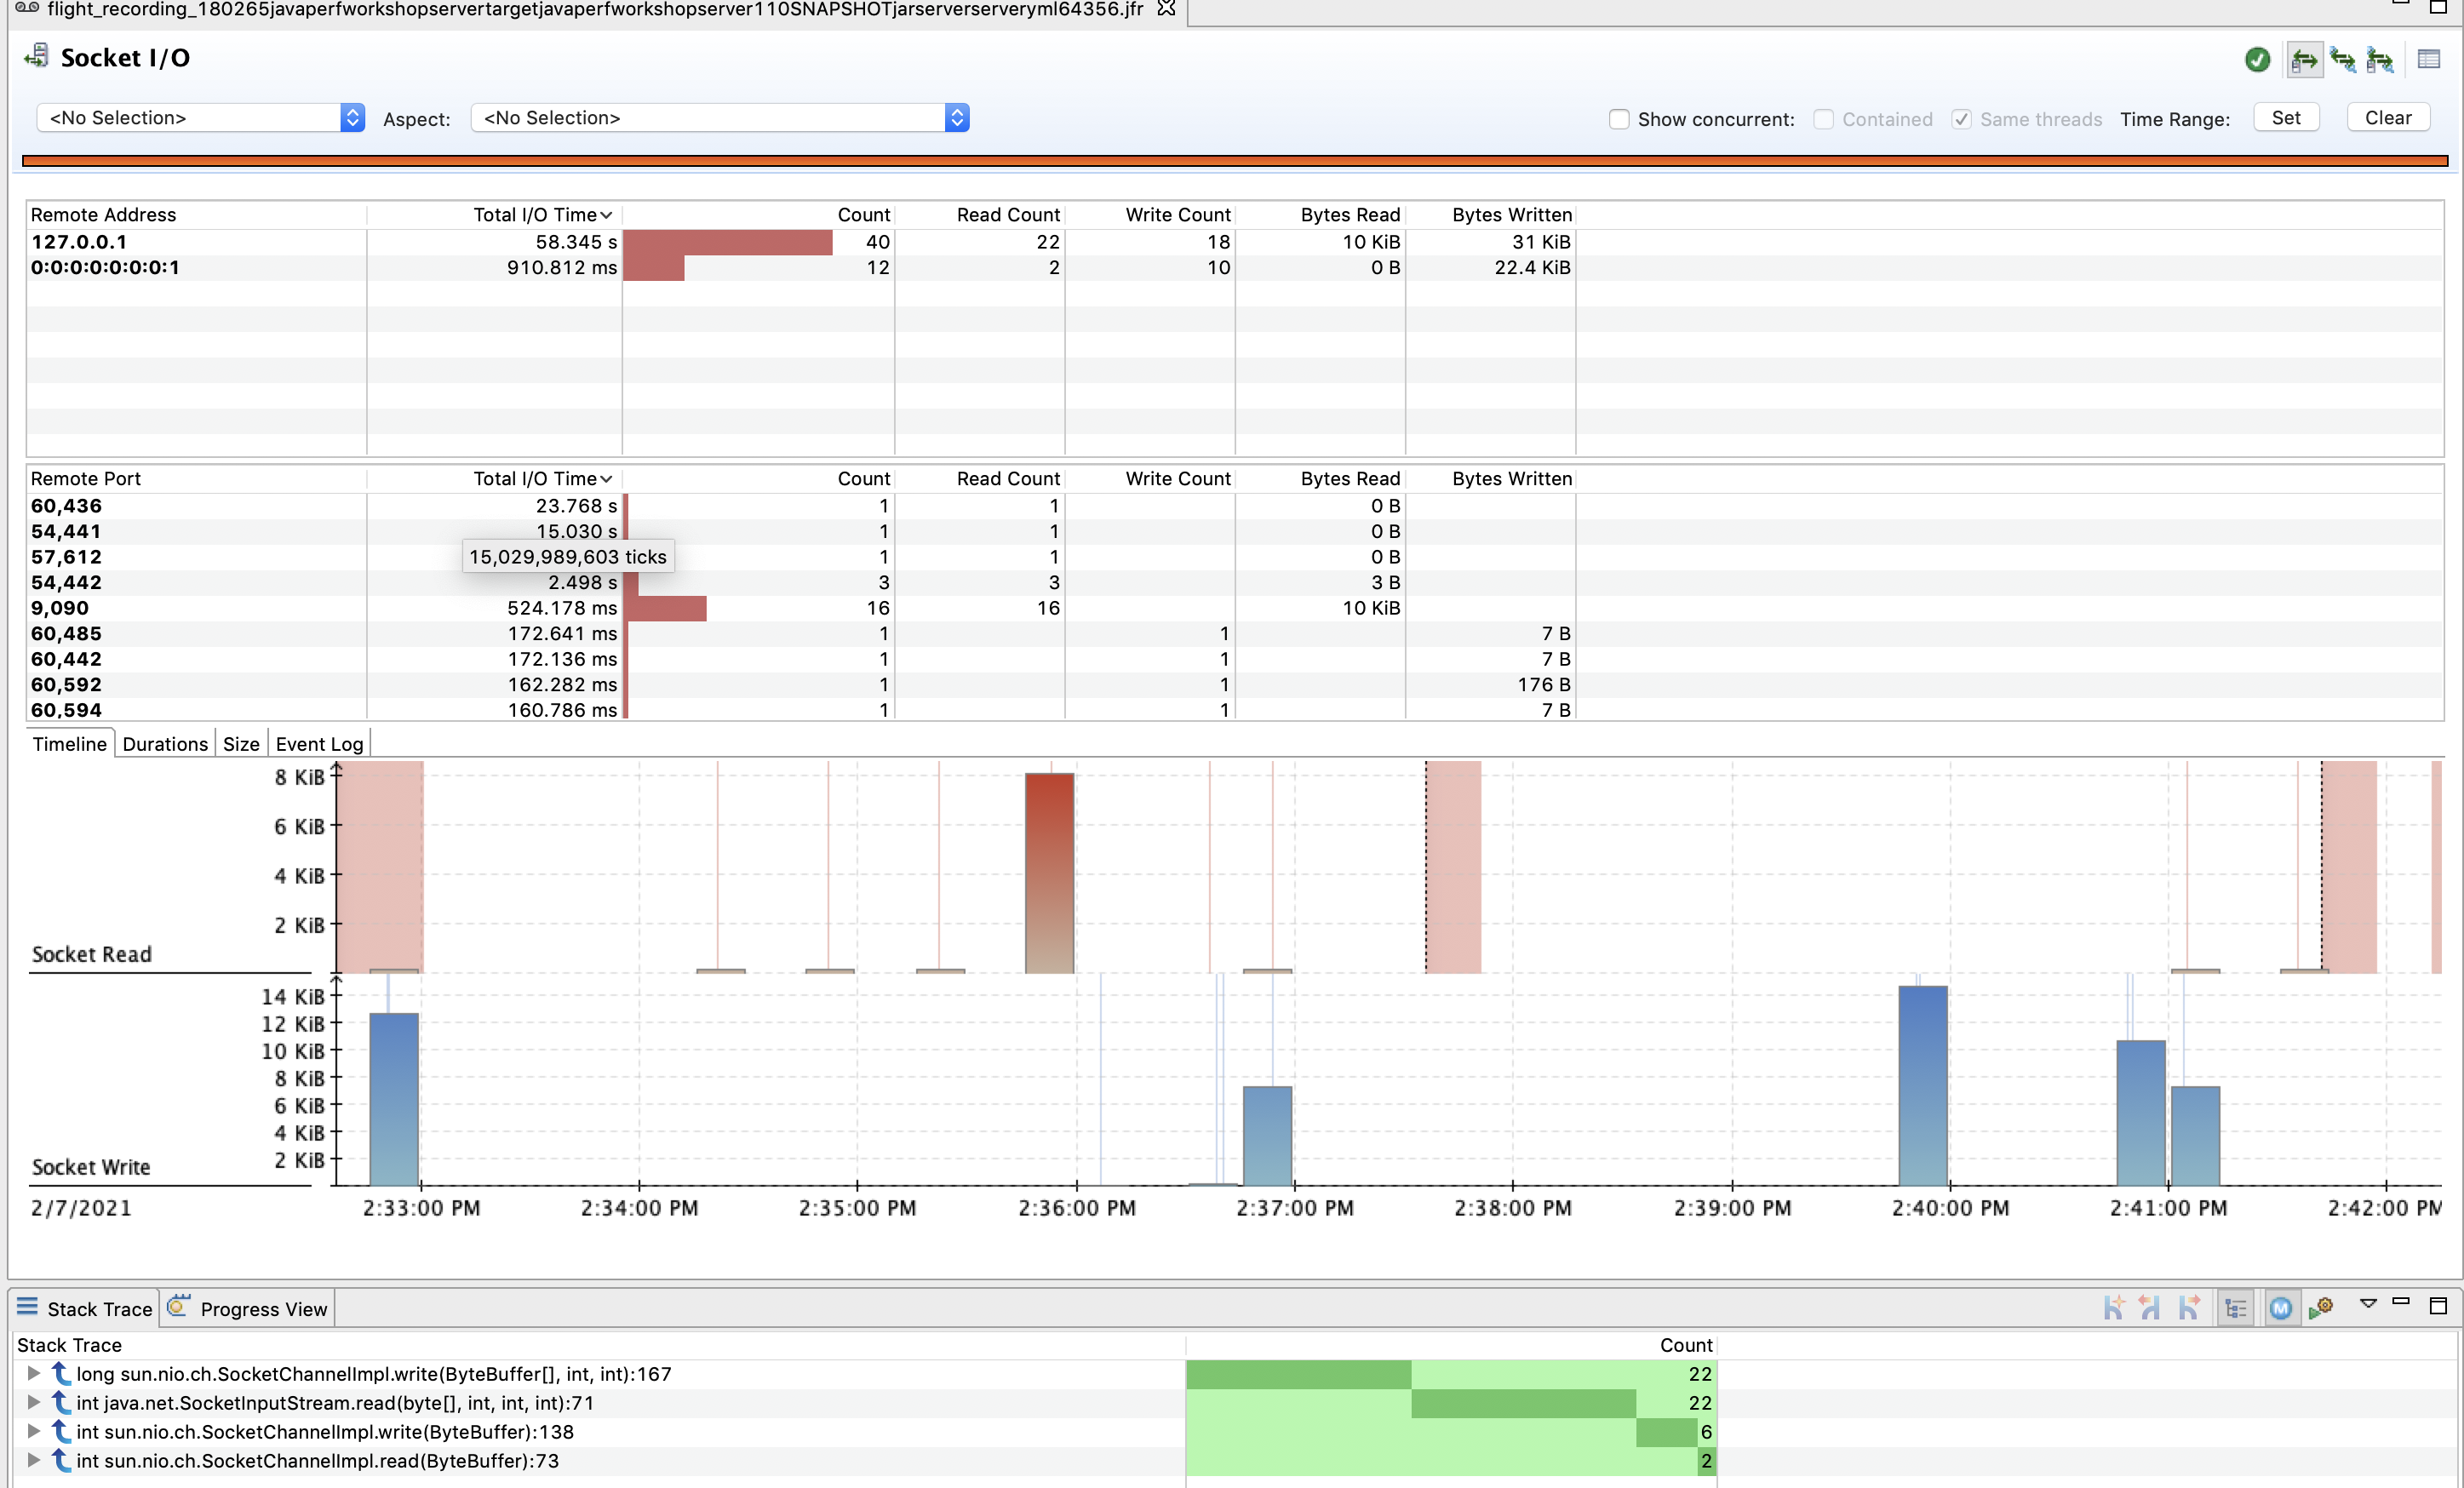
For the purpose of our workshop service, we are doing network I/O, and therefore will look at the Socket I/O page.
From this page, we can gain context of what host(s) we are calling, with what frequency, and the cost associated with those calls:
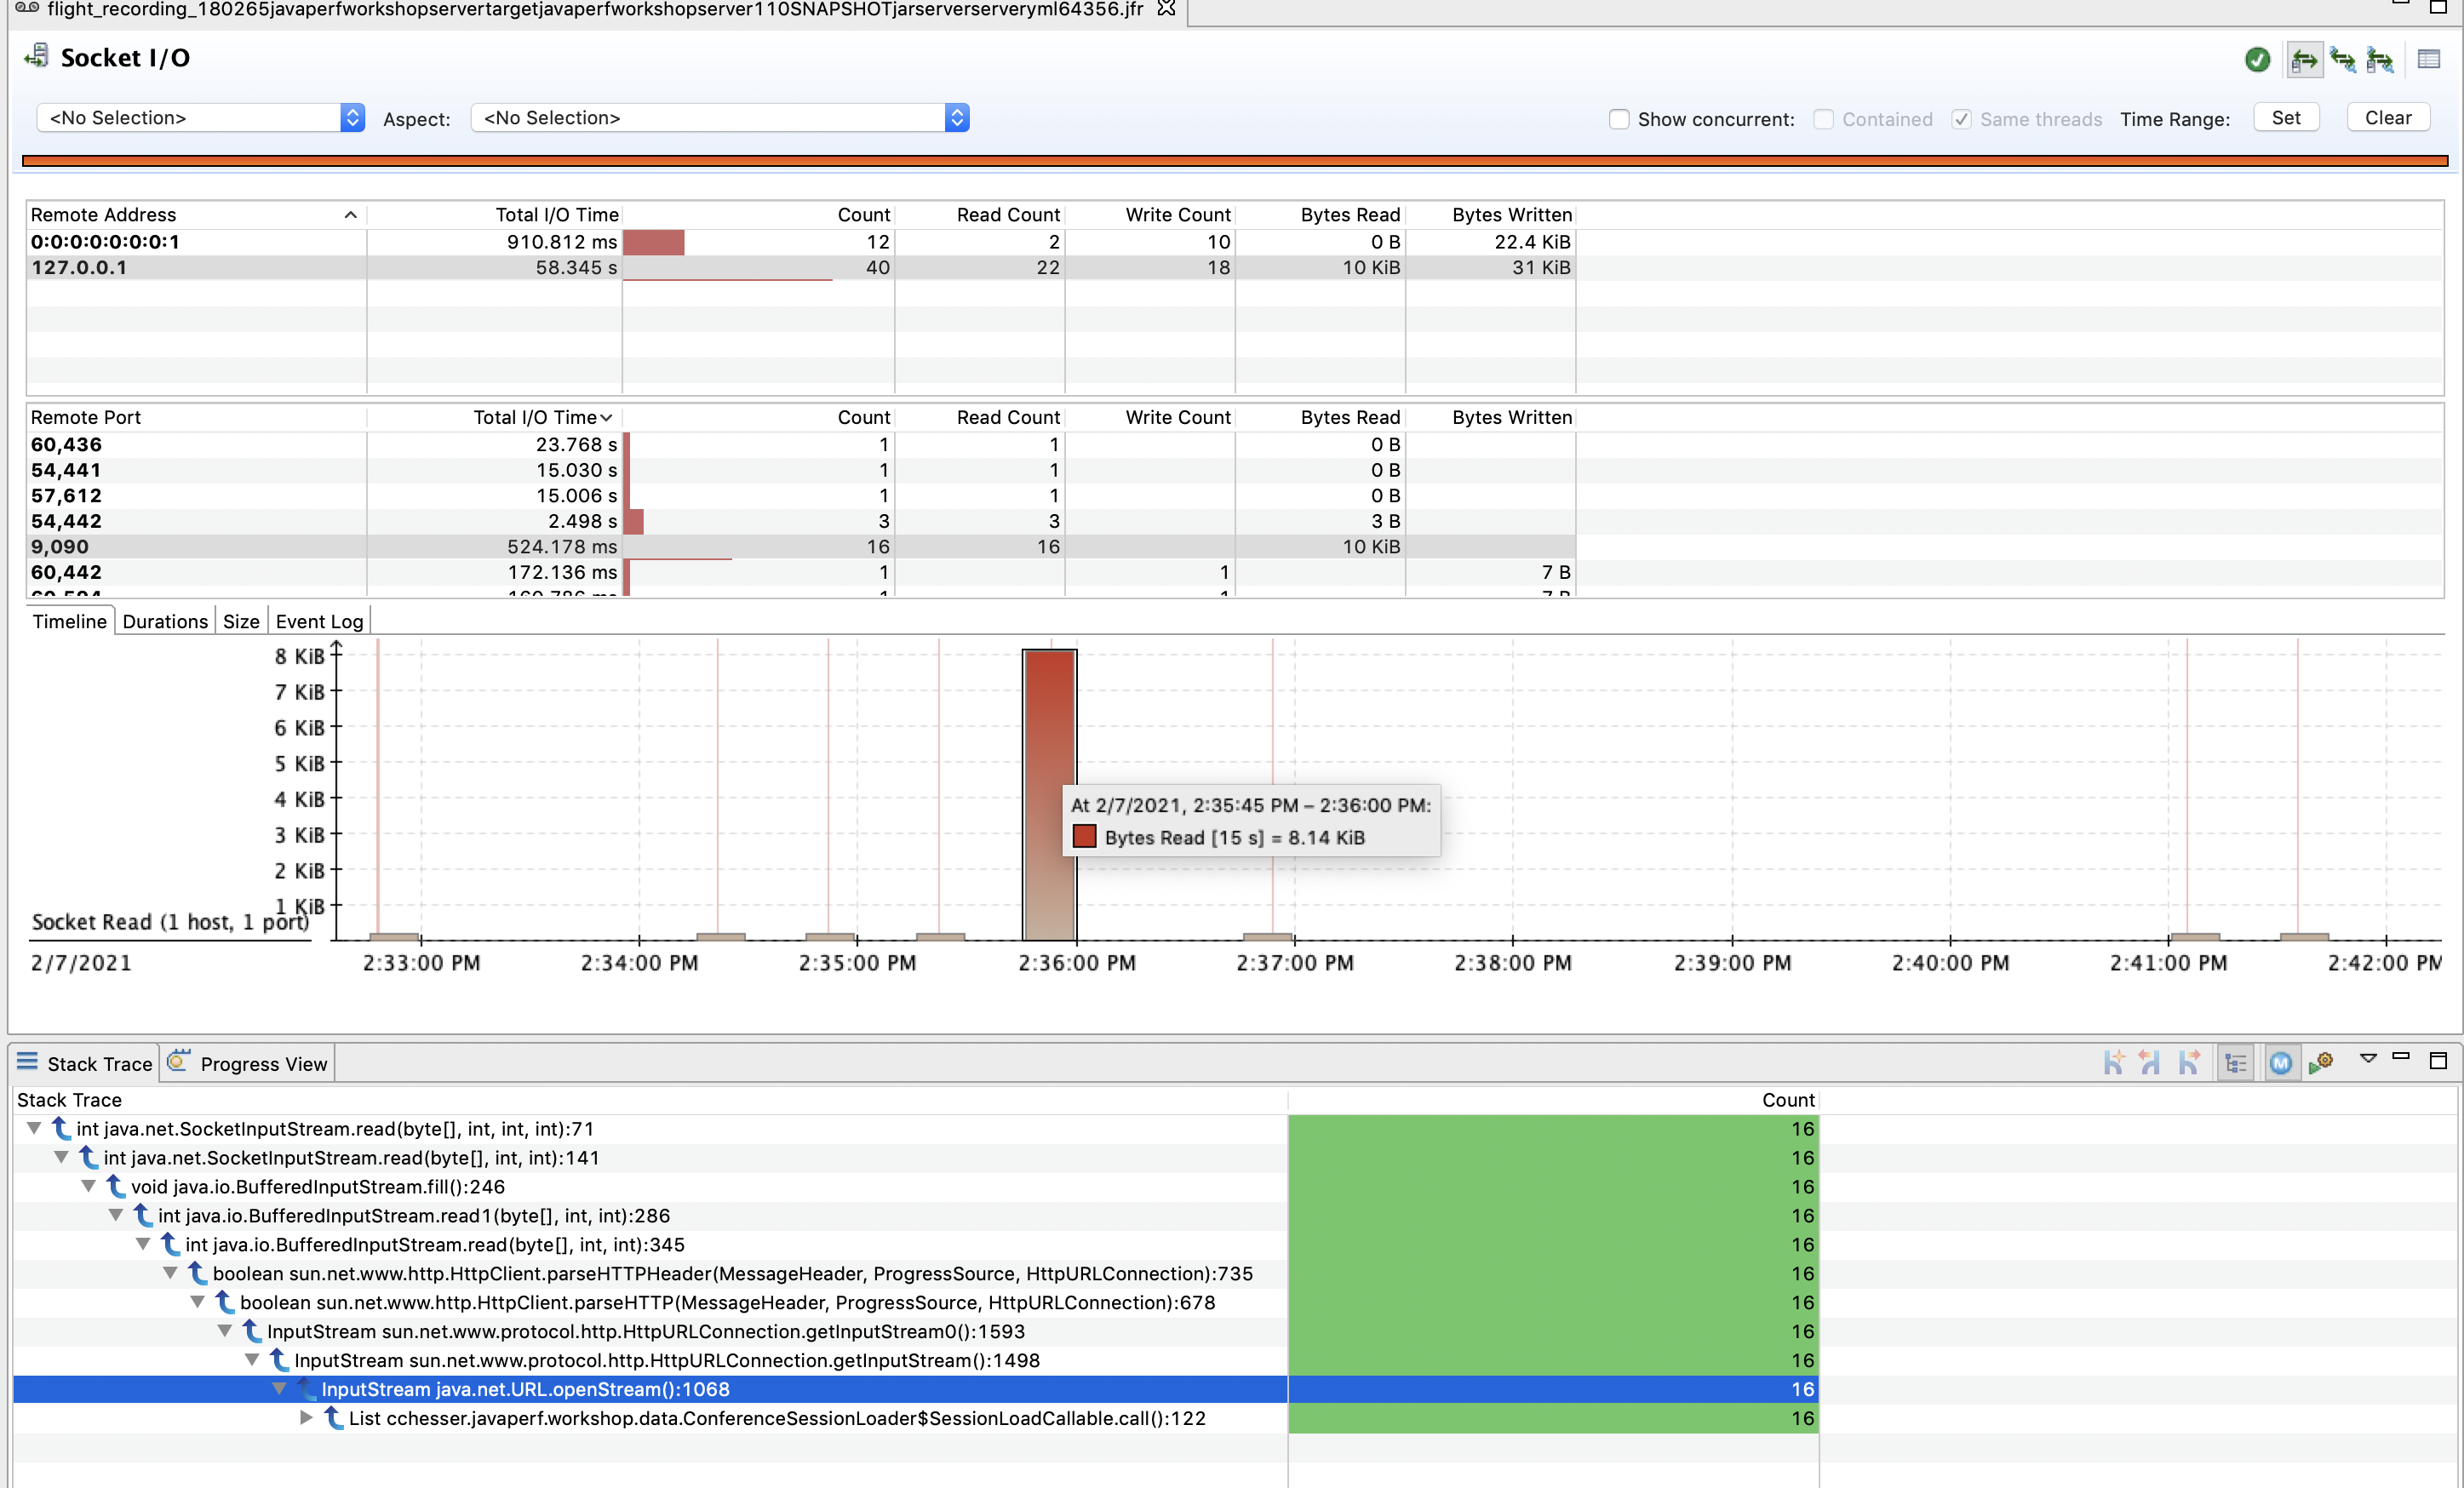
We can then filter on a particular host and port and drill down into a particular piece of code responsible for that call:
Explore
Filter through the total I/O time and explore a couple of events with high I/O.
Follow Ups
- What remote services are we interacting with?
- How long are we interacting with them and how many invocations?
- How many times did we make calls and what threads were tied to those calls?
7 - References
Collection of useful references used to build this guide.