Memory
The memory page shows us the overall memory usage and garbage collection events for our recording.
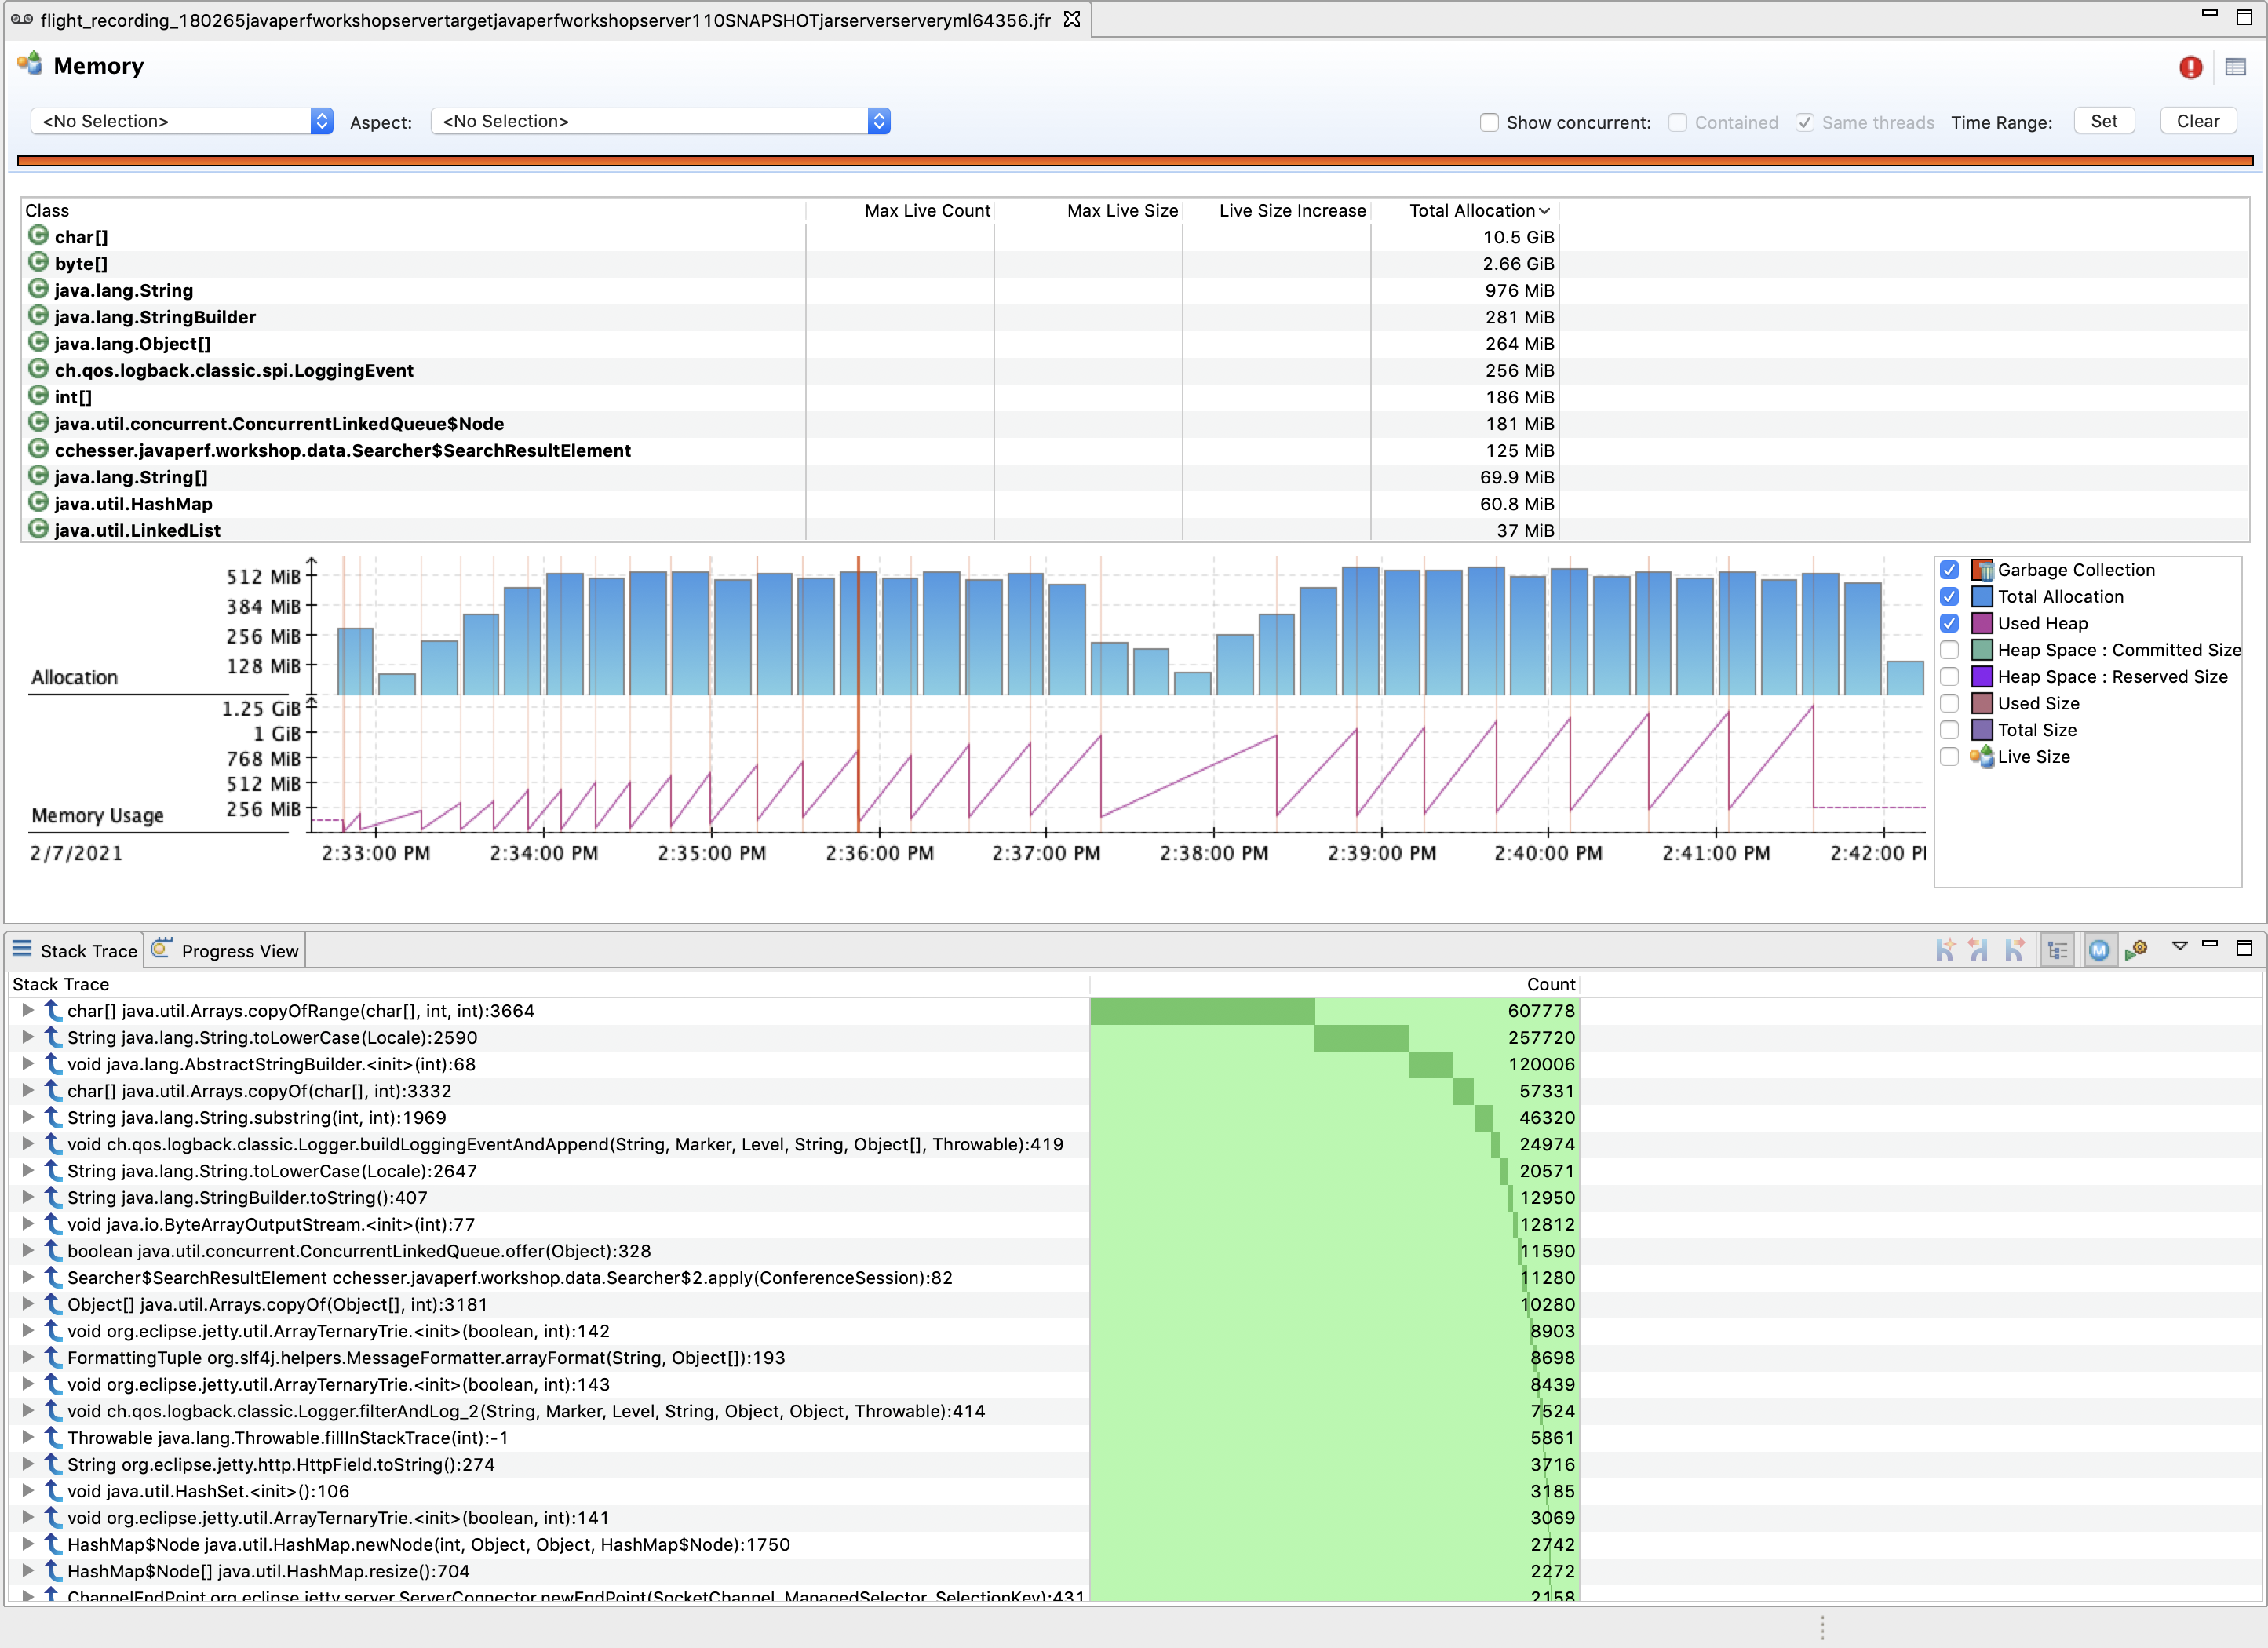
The Class Table lets us view the total memory allocation dedicated to particular instances of that class. Selecting a particular class will allow us to view what code paths are responsible for creating those objects.
We can also filter this view to a particular range in time, for example a range where we went from low to high heap usage:
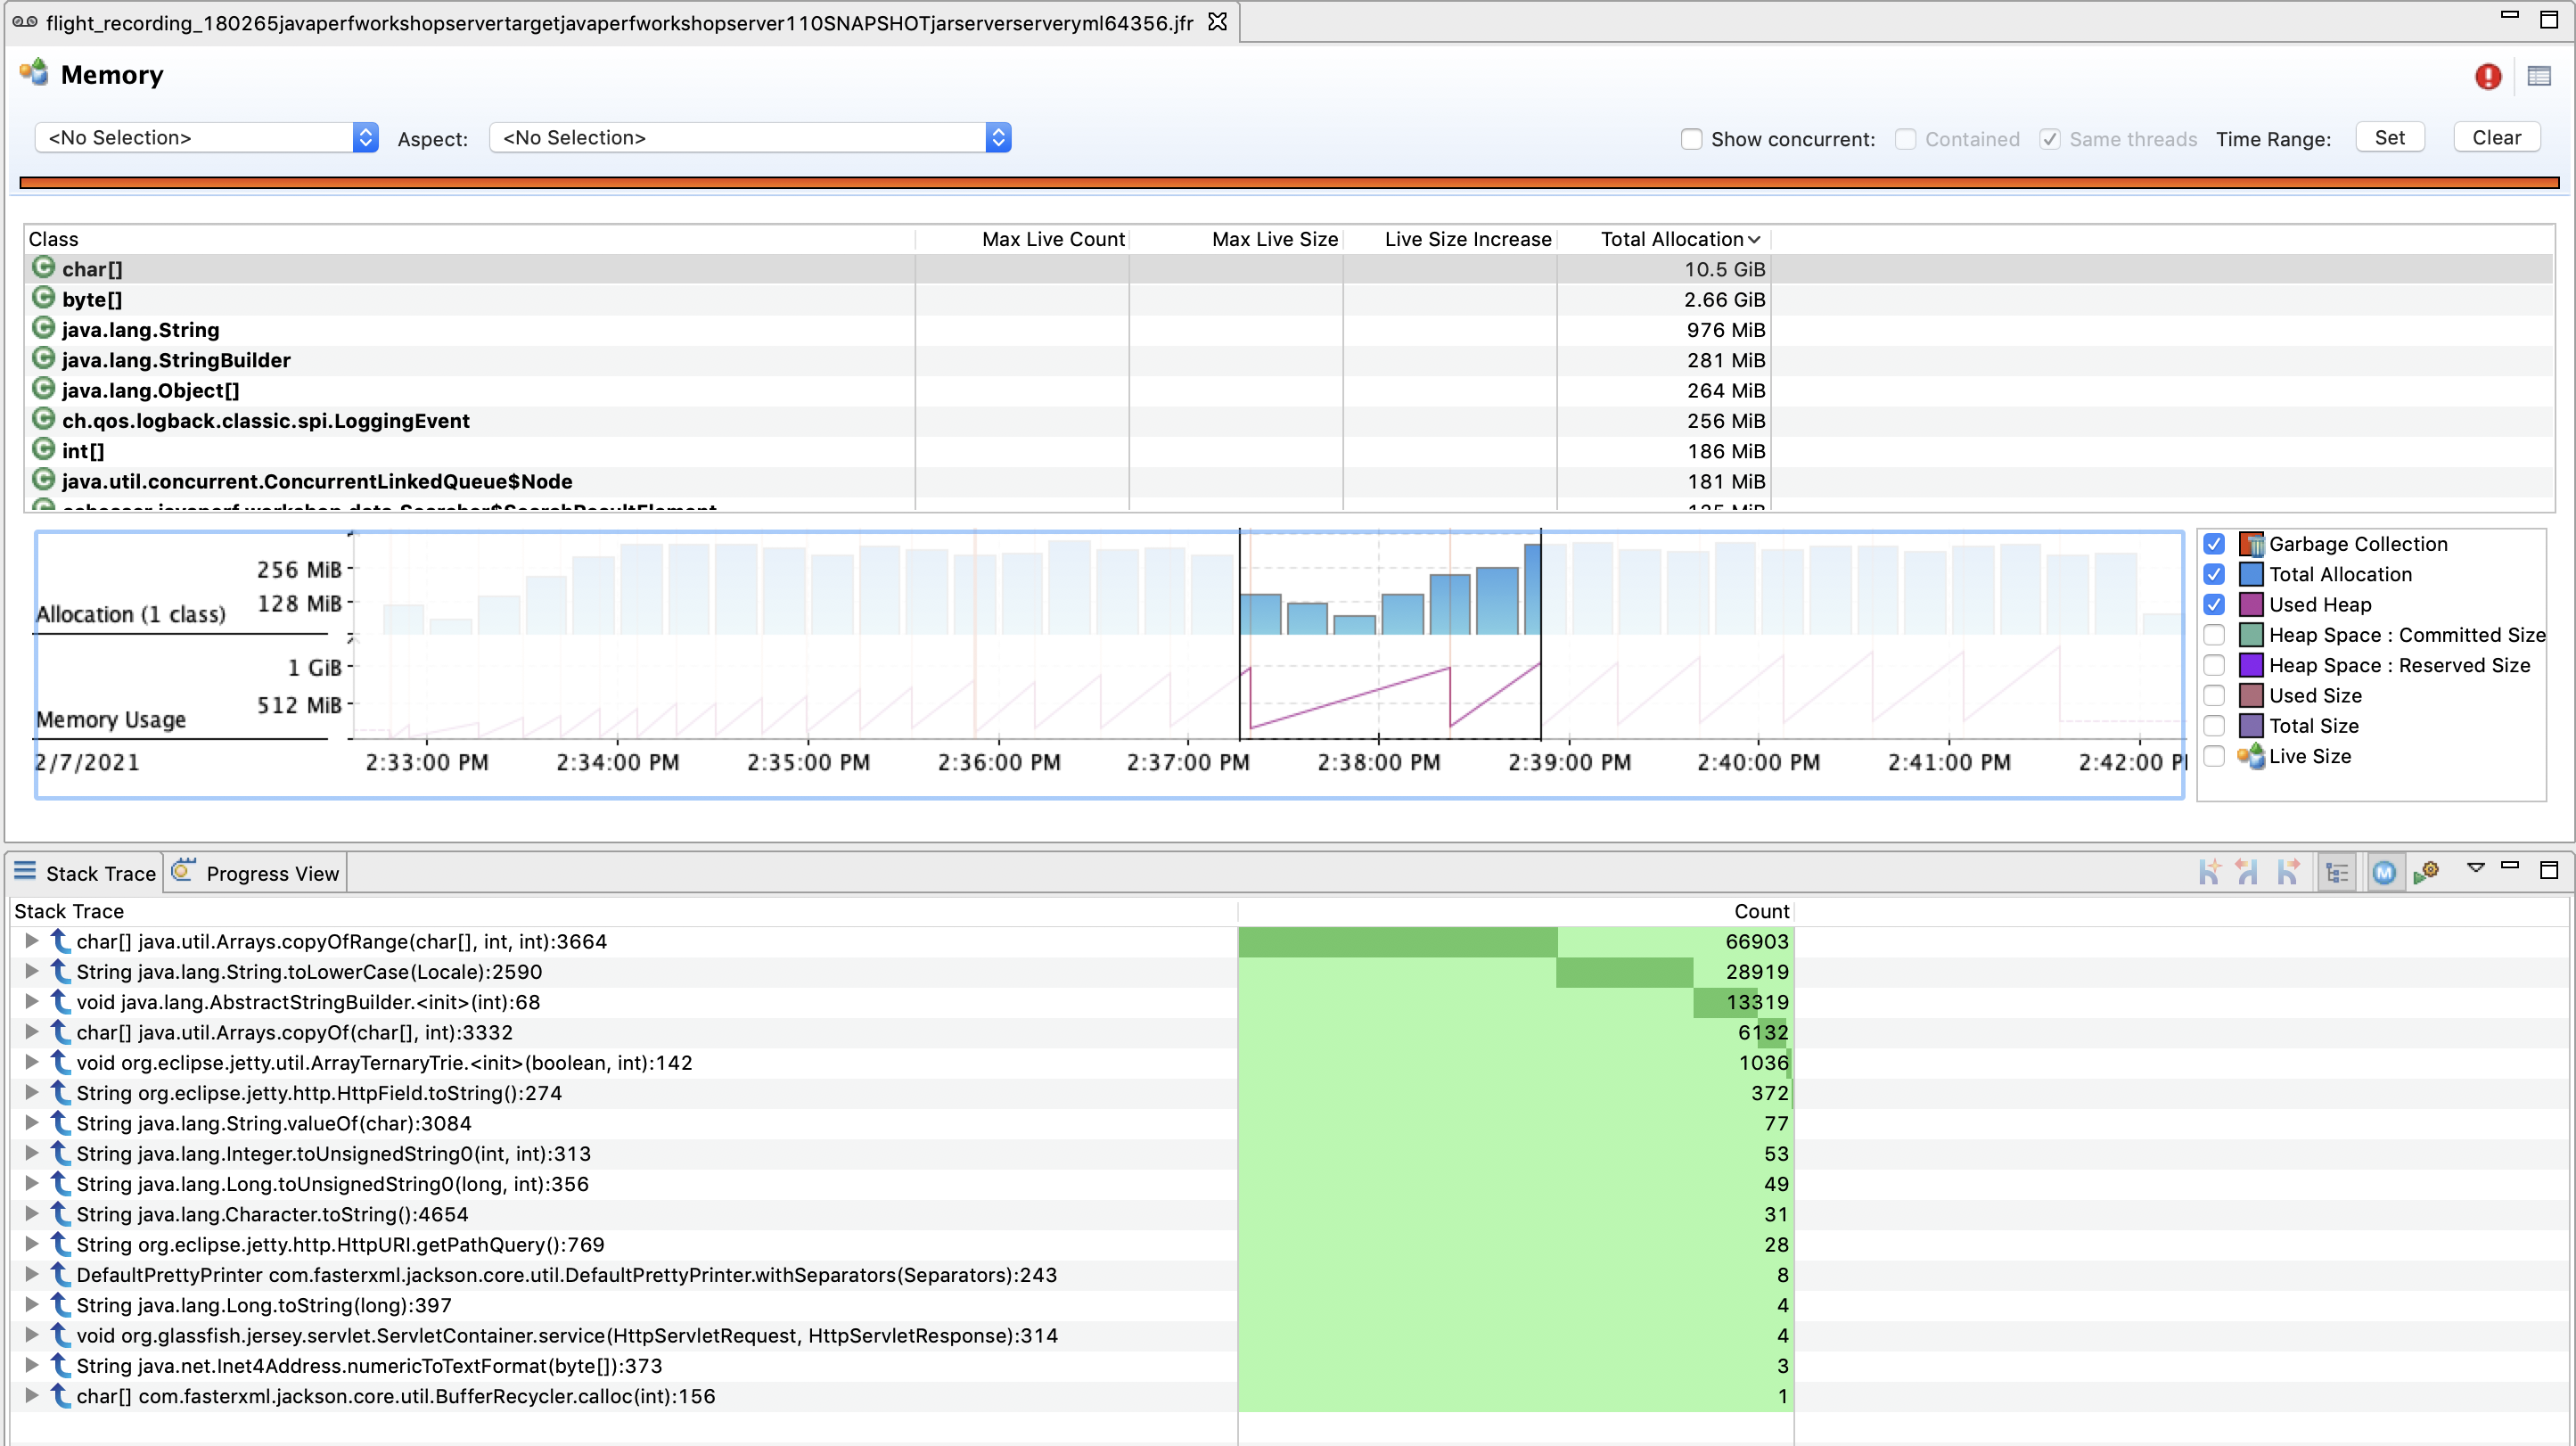
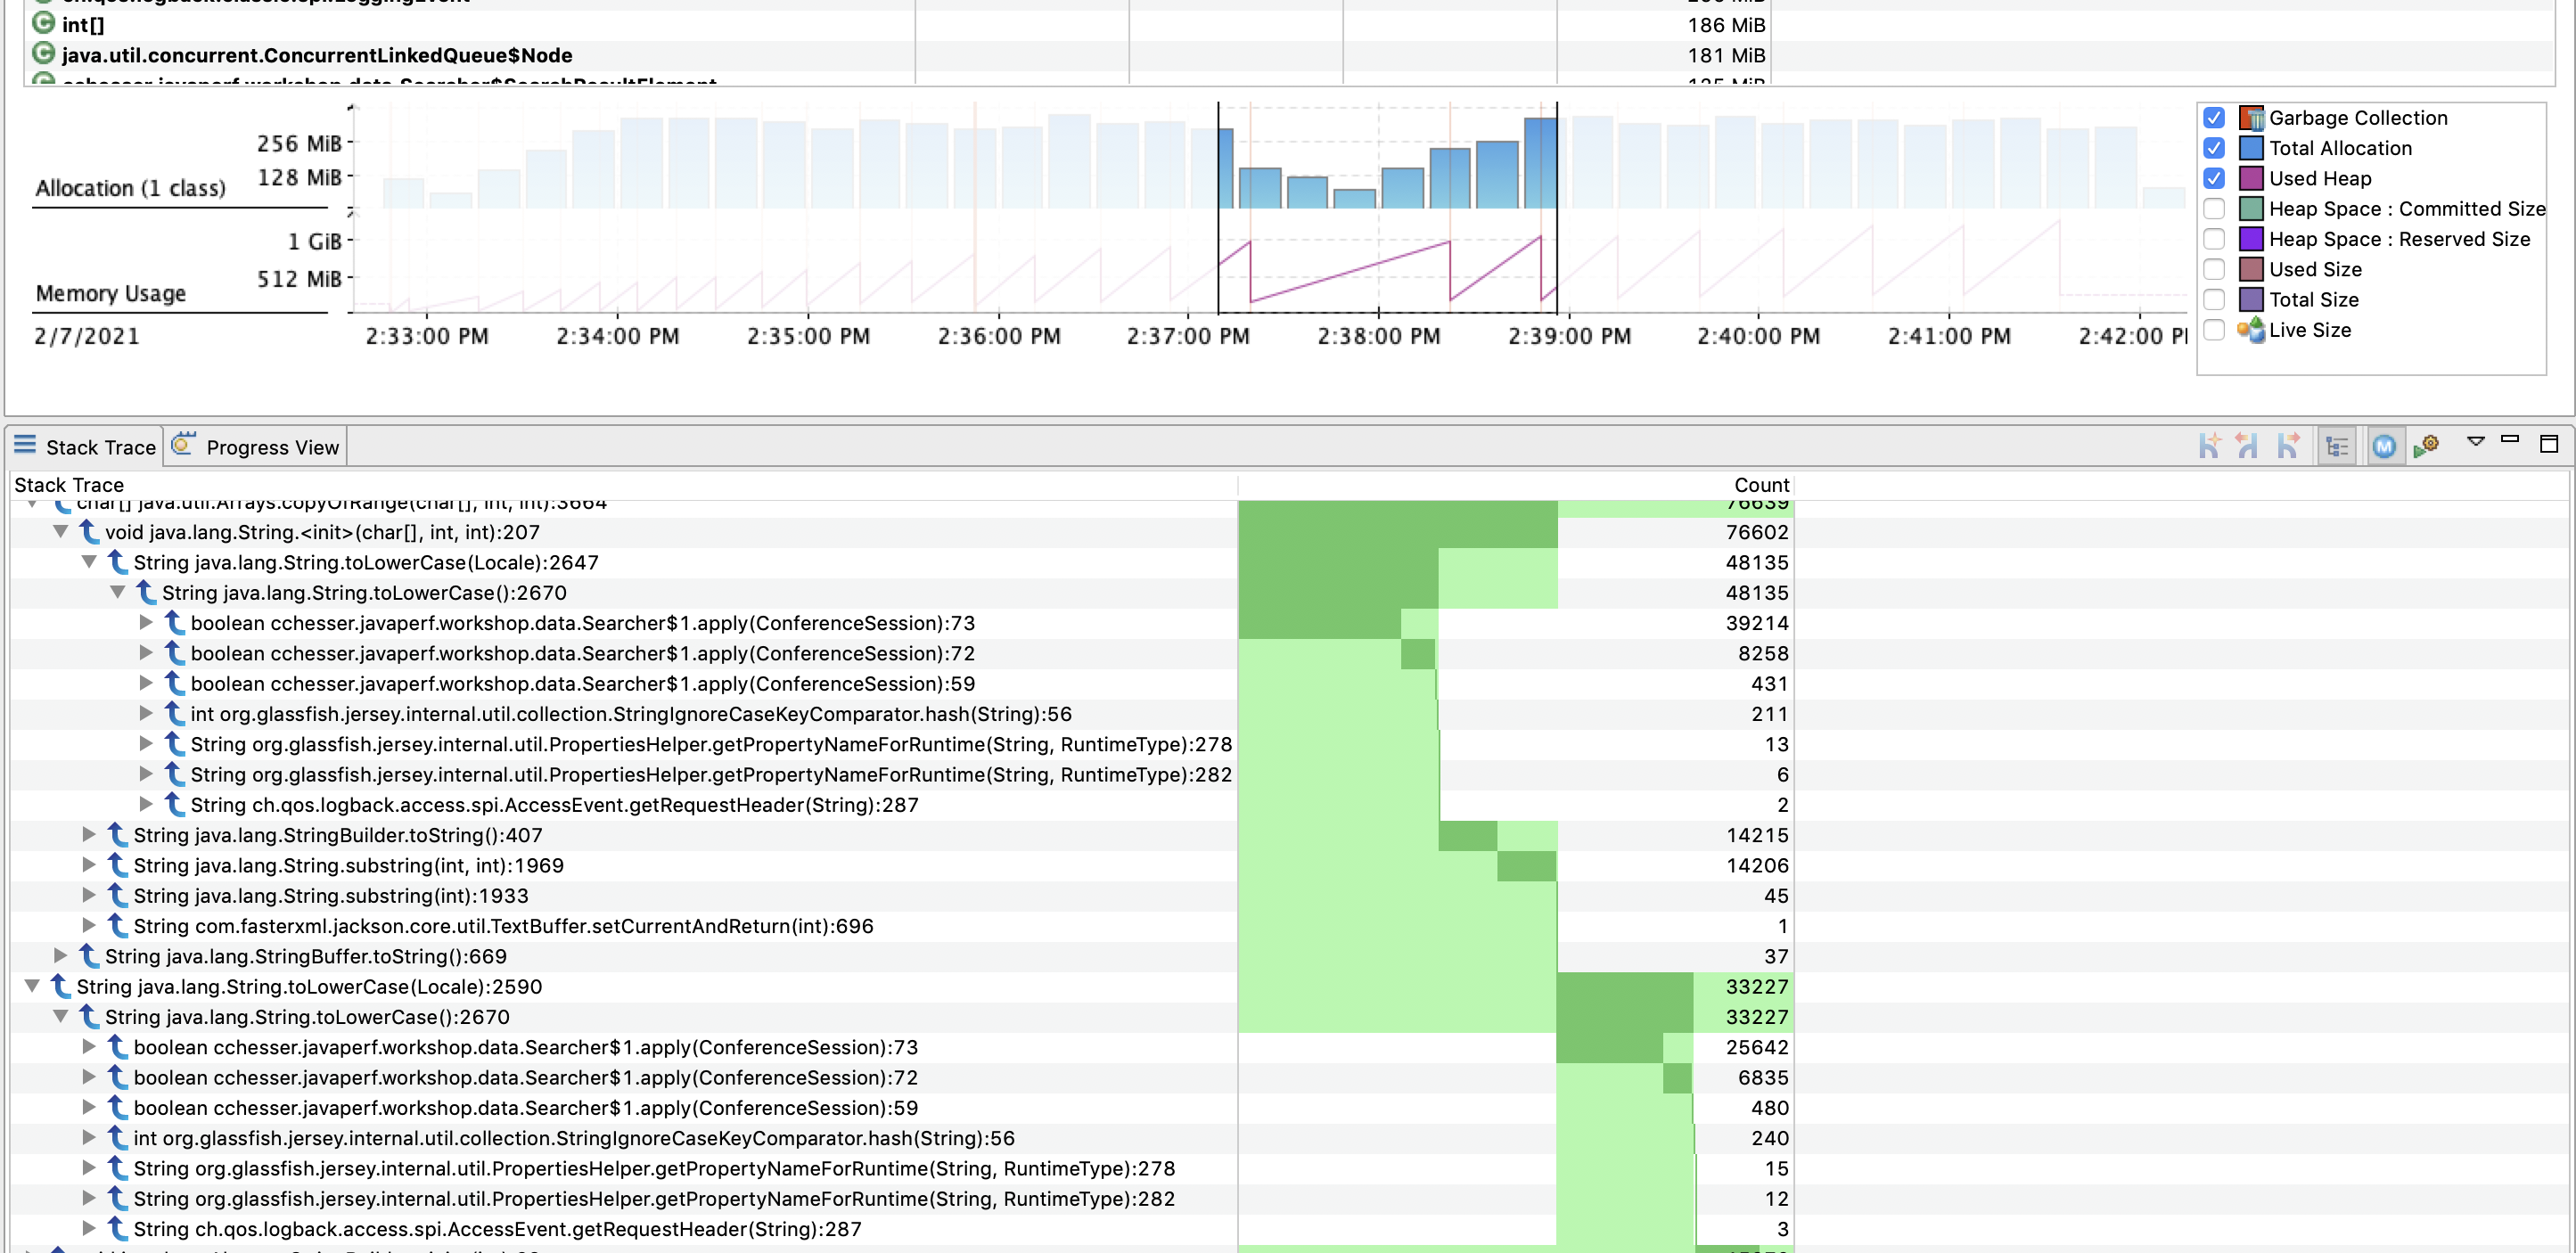
We can then use this filtered view and drill down through the stack trace to find methods of interest:
Explore
Narrow down through some periods of time where our heap rose quickly and then was collected. Look at the memory reclaimed after each collection.
Follow Ups
- What are the most commonly allocated classes? Where do they come from?
- Are there any classes we own that are also high on the allocation list?
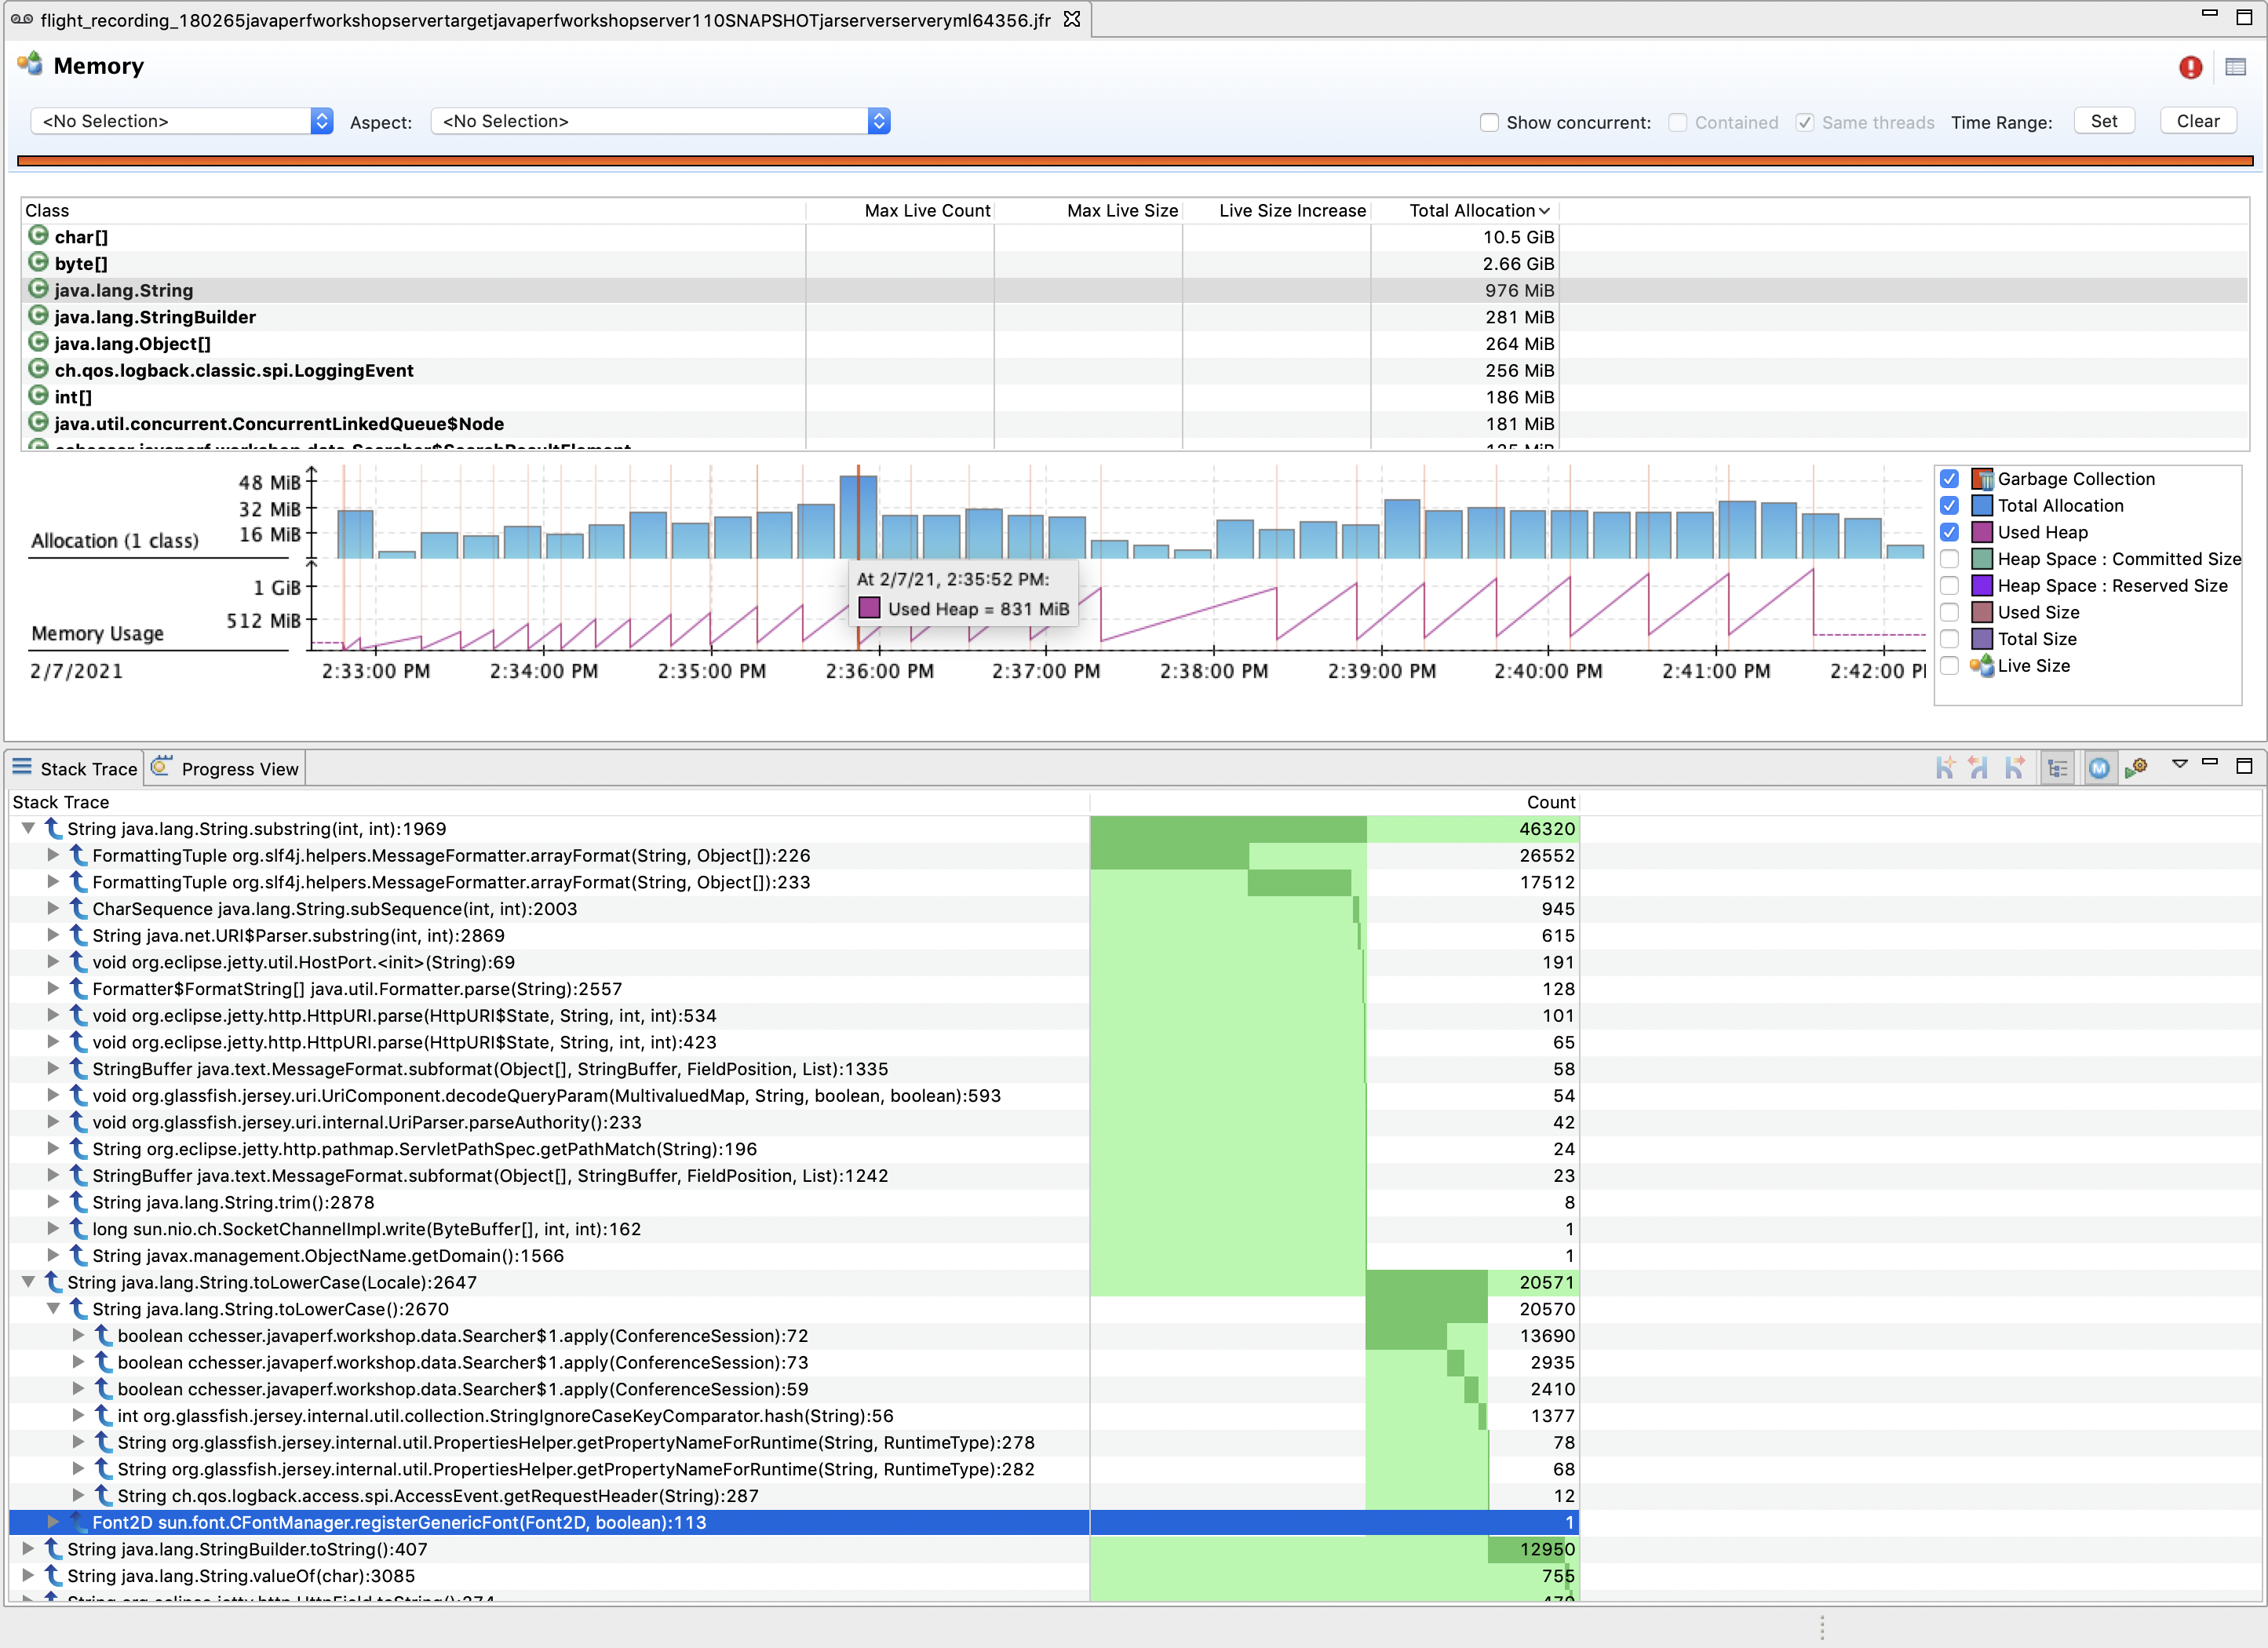
- Expand the memory usage chart and only chart the Used Heap, do you notice a pattern?
- What do you think caused the flat line at the end of the chart?
In the next section, we'll look at the I/O used by our application.
I/O Operations