Method Profiling
Our first look at the recording will start with finding out where we might be spending time with our code.
Method Profiling Page
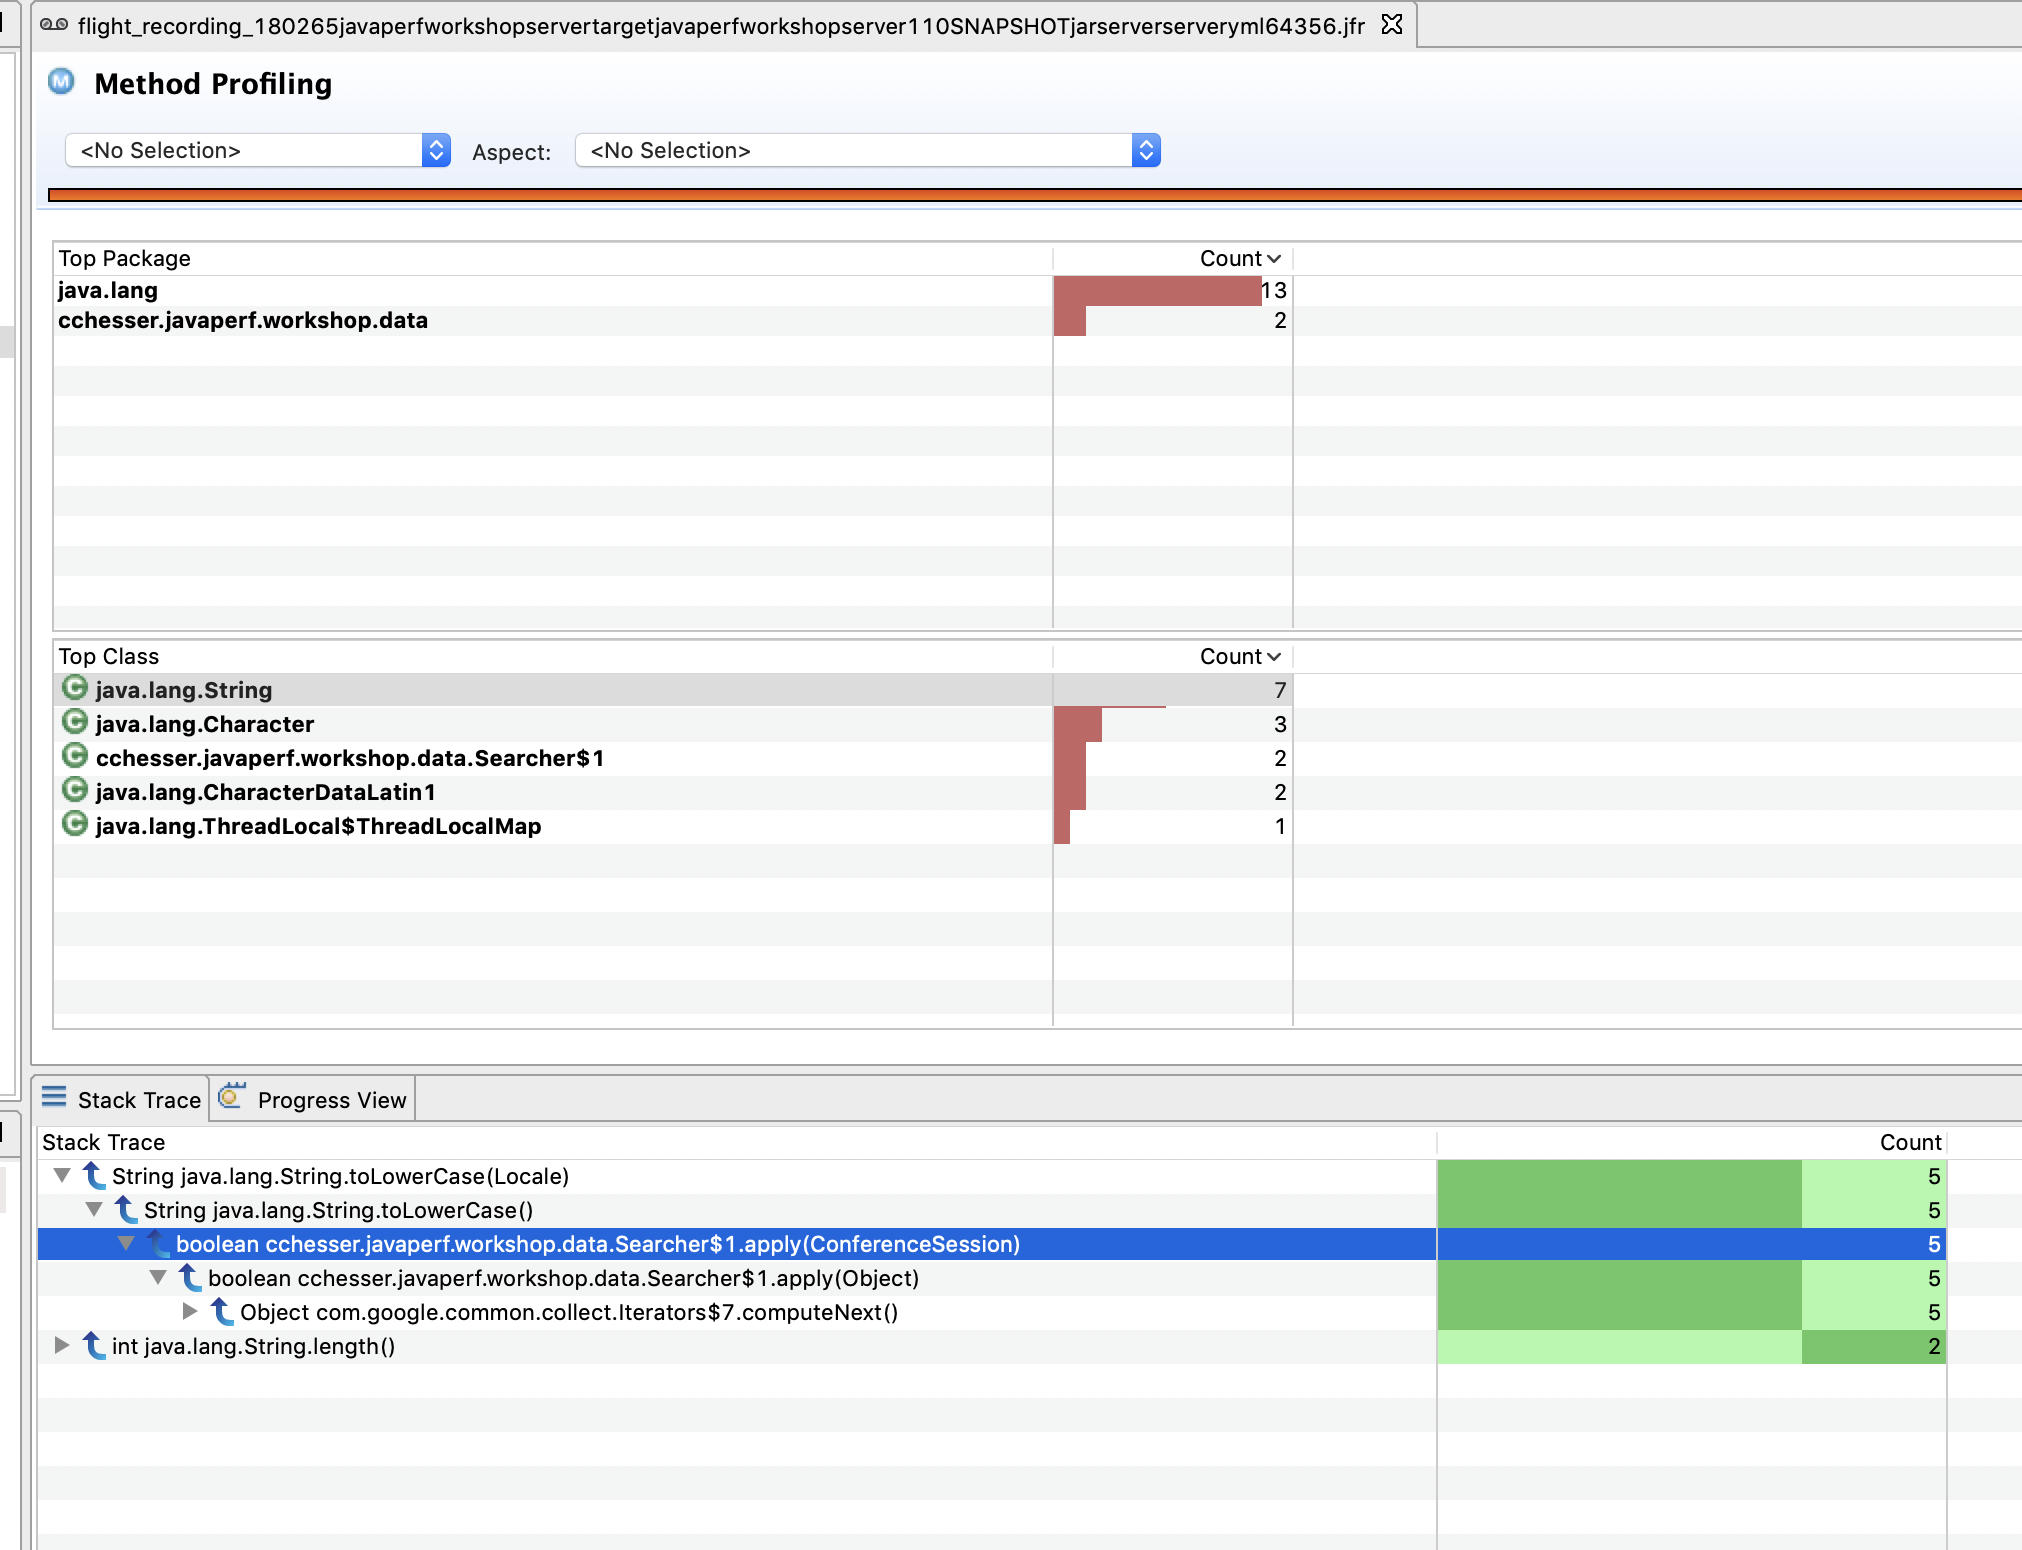
We’ll start by taking a look at the detailed Method Profiling Page. This page displays how often a specific method is ran based on sampling.
This page is a little bit difficult to use in JMC7, planned improvements for the data visualization will come in JMC8, see JMC#165
By default, this view groups threads by method, but you can also include the line number for each method. This can be accomplished by selecting the View Menu option and going to Distinguish Frames By and selecting Line Number.
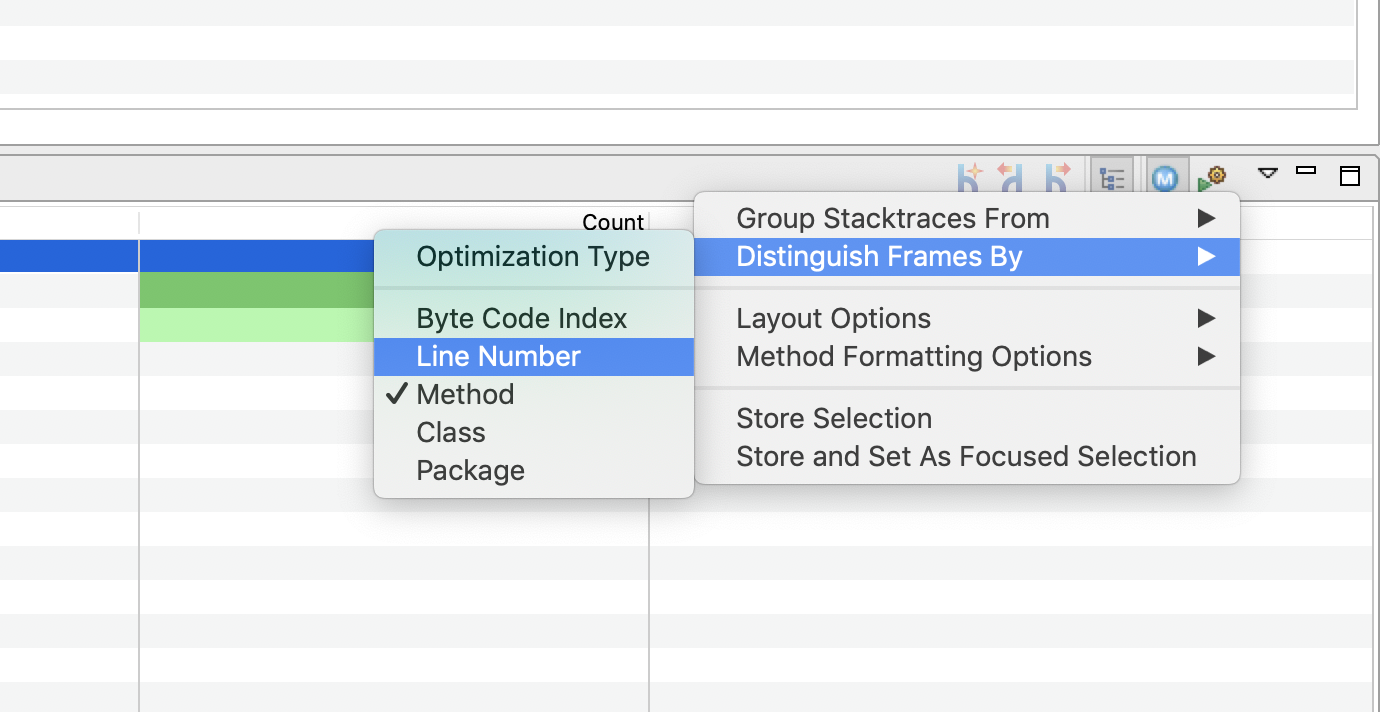
💡 Generally, you don’t need this, as it can be quite apparent by the base method being invoked where the cost is at. Though, it may be helpful to include in some contexts.
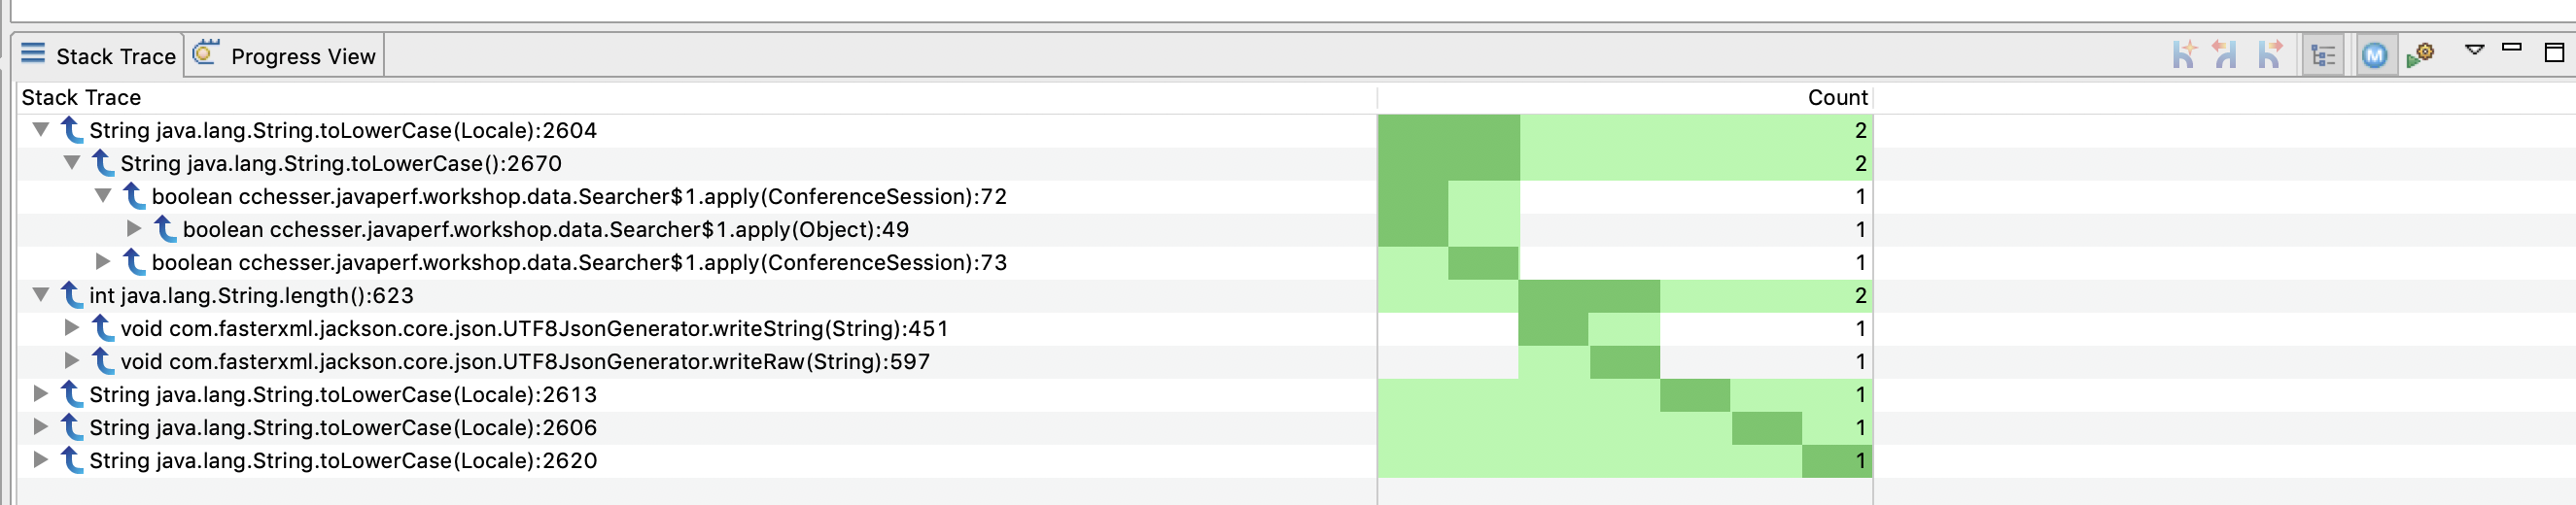
Remember that this is just a sampling view, and does not mean that only a small amount of methods were hit. We’ll be able to visualize more of this info in the following part.
Java Application
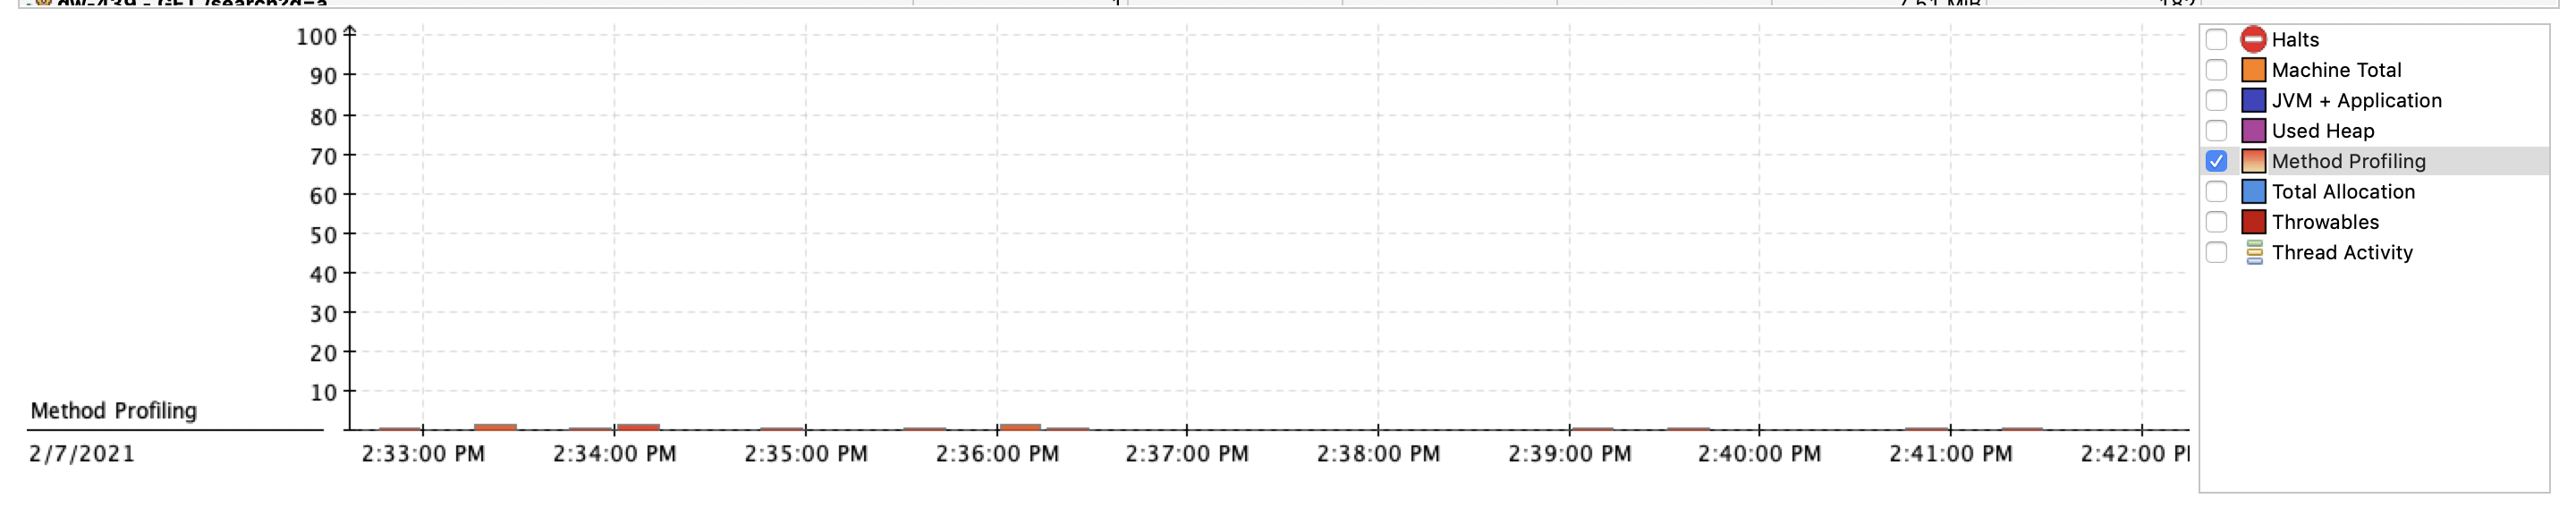
Navigate to the Java Application page. This page provides an overview of the state of the JVM and collates information from a couple of the dedicated pages.
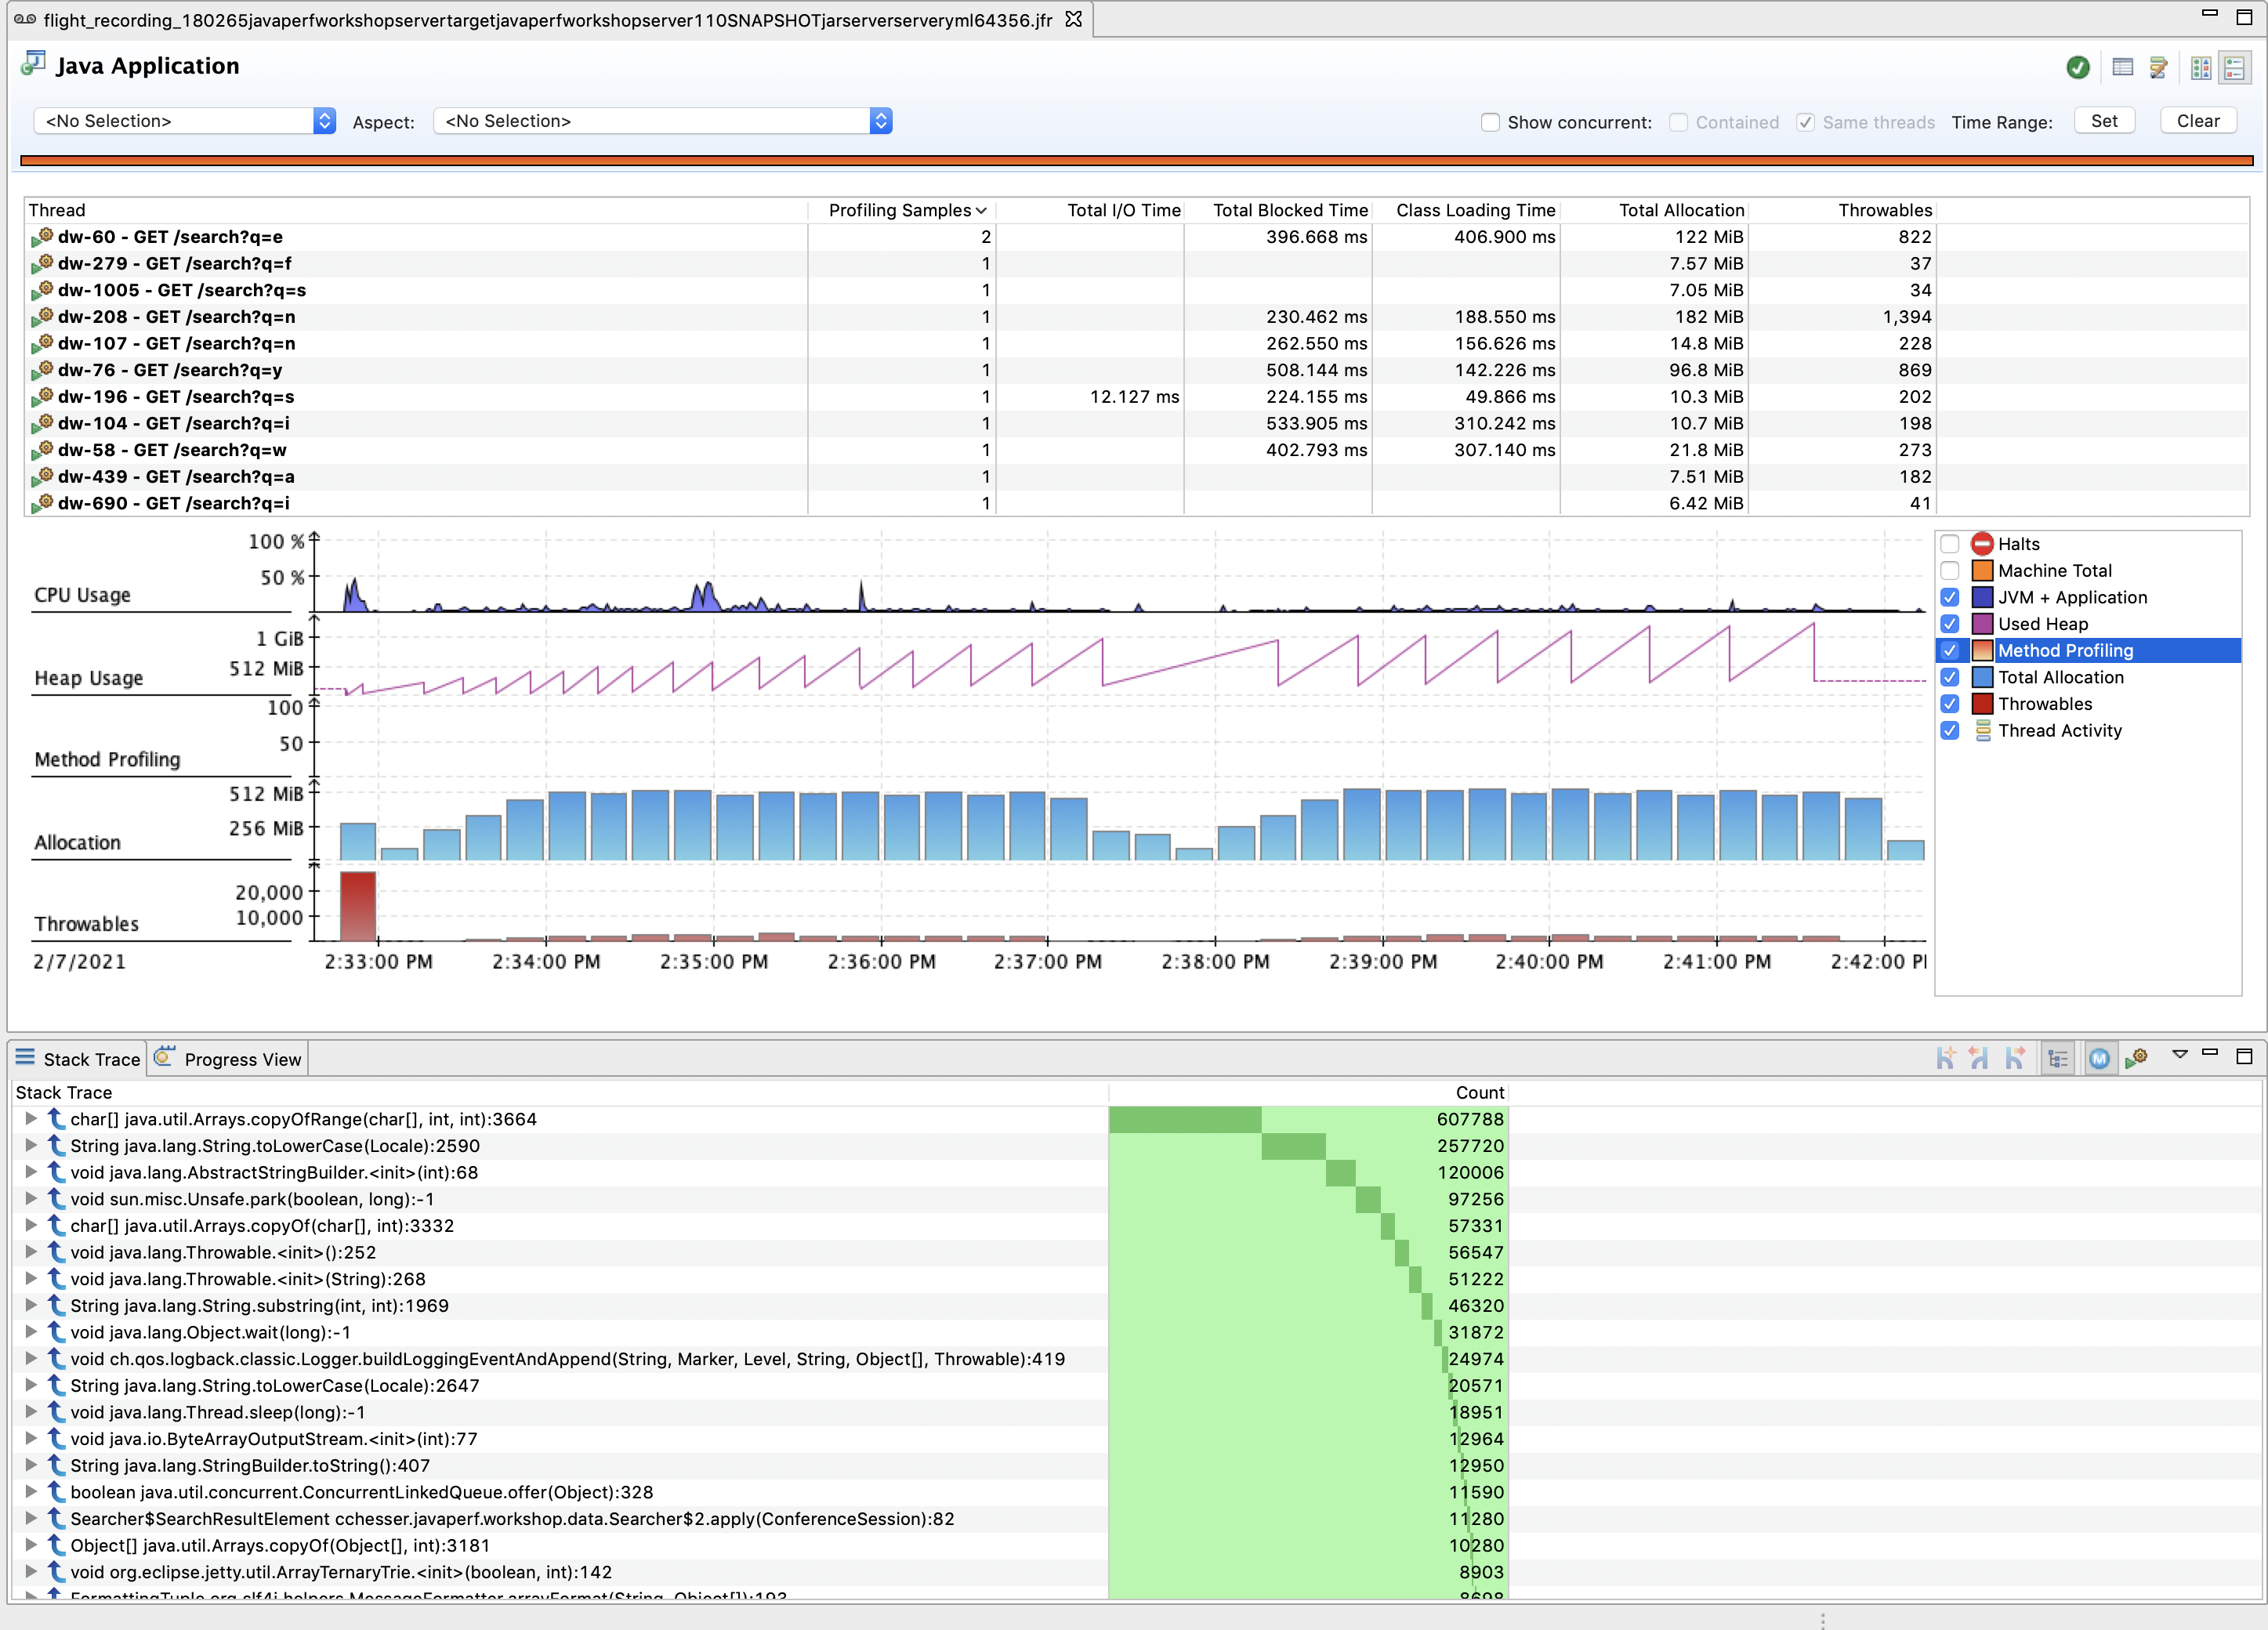
Using the checkboxes on the right of the Graph, select only Method Profiling to narrow down the set of events on the graph:
The Stack Trace view from this page can give you a better count of sampled methods (not just the ones from a specific Method Profiling event)
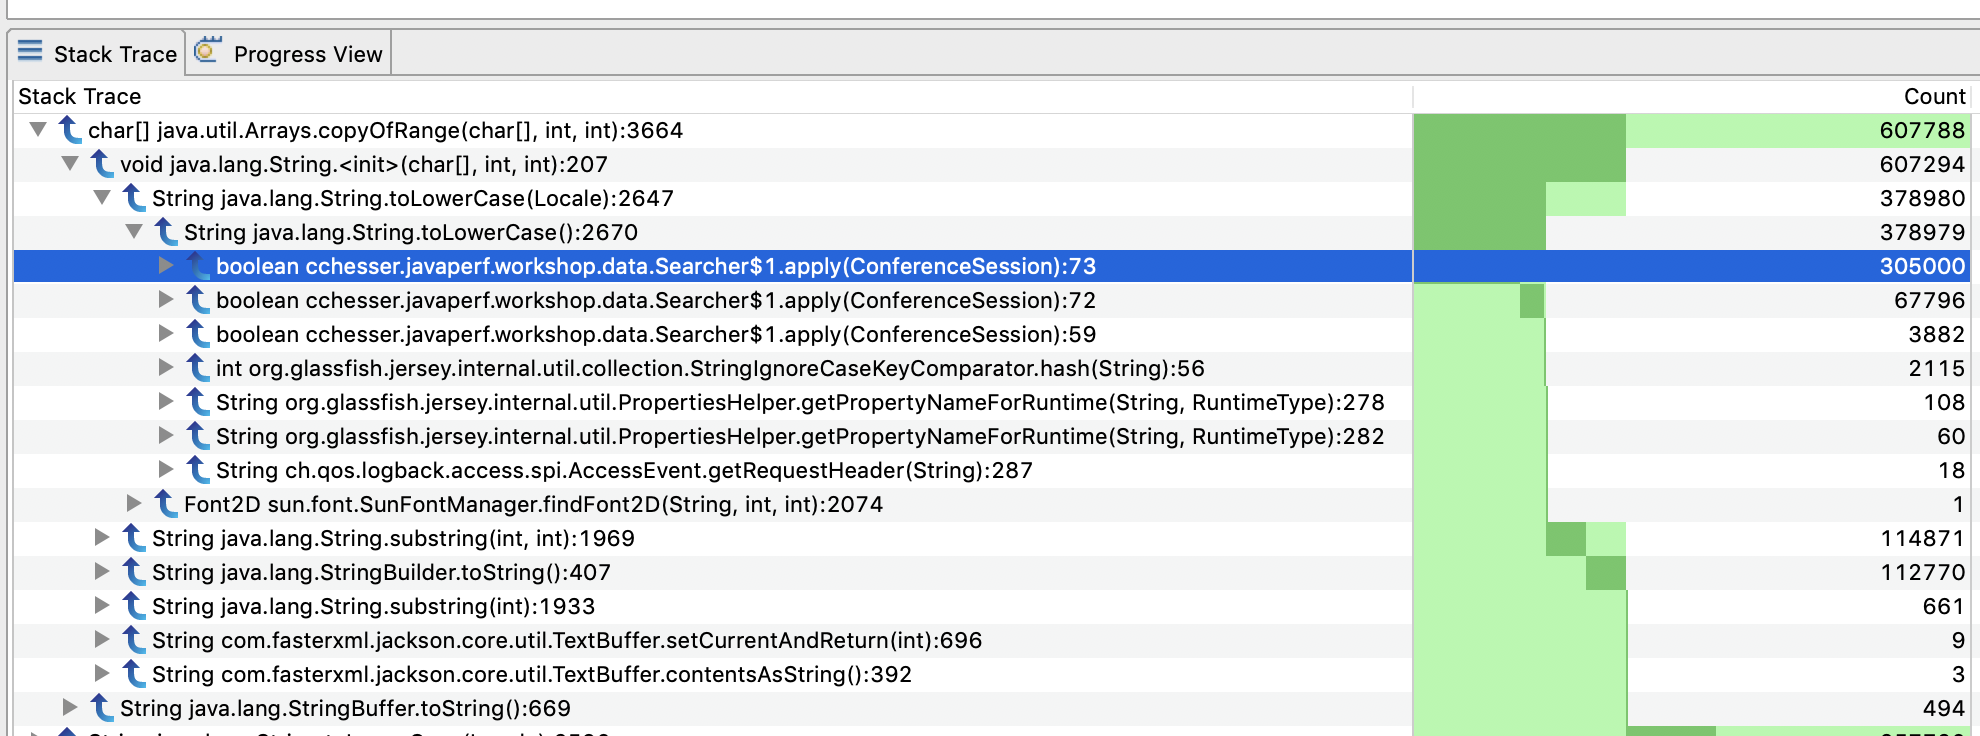
This information is the equivalent of the Hot Methods tab in JMC 5, see forum discussion.
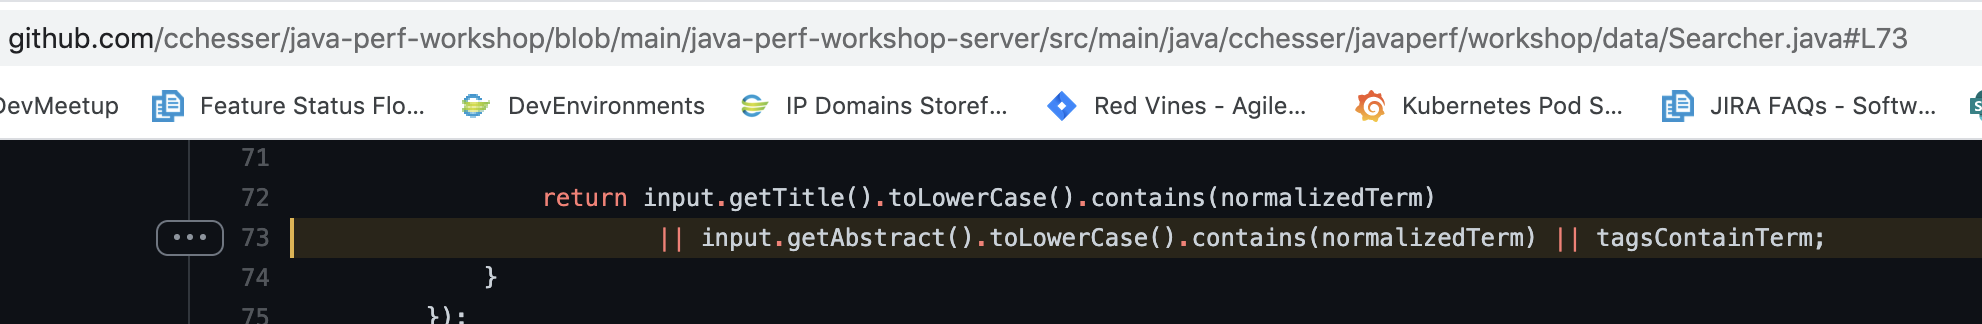
We can then use this information to correlate what is happening in our code:
Explore
- Walk around to look at other areas where you are spending time in your code.
- In many cases you find that there are very expensive areas of code that you cannot change (as you may not own it), but you can dictate whether or not it should be executed (or executed as frequently).
Follow Ups
- Is there any method that stands out to you that might be unnecessarily called?
In the next section, we'll look at the Exceptions thrown by our application.
Exceptions