Eclipse MAT
Make sure you’ve gone through the Prerequisites
Eclipse Memory Analyzer is a fairly mature tool on analyzing heap dumps. It is a rich tool that includes the abilities to do OQL queries on the heap, general reporting on anti-patterns, and helpful common views (like the dominator tree). Eclipse Memory Analyzer tool is a separate install which can be a standalone install, or it can run as a plugin within Eclipse.
Opening Heap Dumps
After you have it installed, go to File and then Open Heap Dump… and specify the hprof file that you wish to analyze.
Index Files
💡 When Eclipse Memory Analyzer loads your hprof file, it will create many other index files to assist in optimally analyzing and navigating through your heap dump. It may make it easier to isolate your prof file in its own directory prior to opening it, based on the secondary files which are created. You can always just delete these files within Eclipse Memory Analyzer by opening the Heap Dump History window, right-clicking the hprof which was previously loaded, and selecting Delete Index Files. Example listing of index files which get generated by suffix:
.domIn.index.domOut.index.index.o2ret.index.a2s.index.idx.index.inbound.index.o2c.index.o2hprof.index.outbound.index.threads
Analyzing the Heap Dump
In the following section, we’ll go through a couple of the views and what sort of data we can gather from them.
Dominator Tree
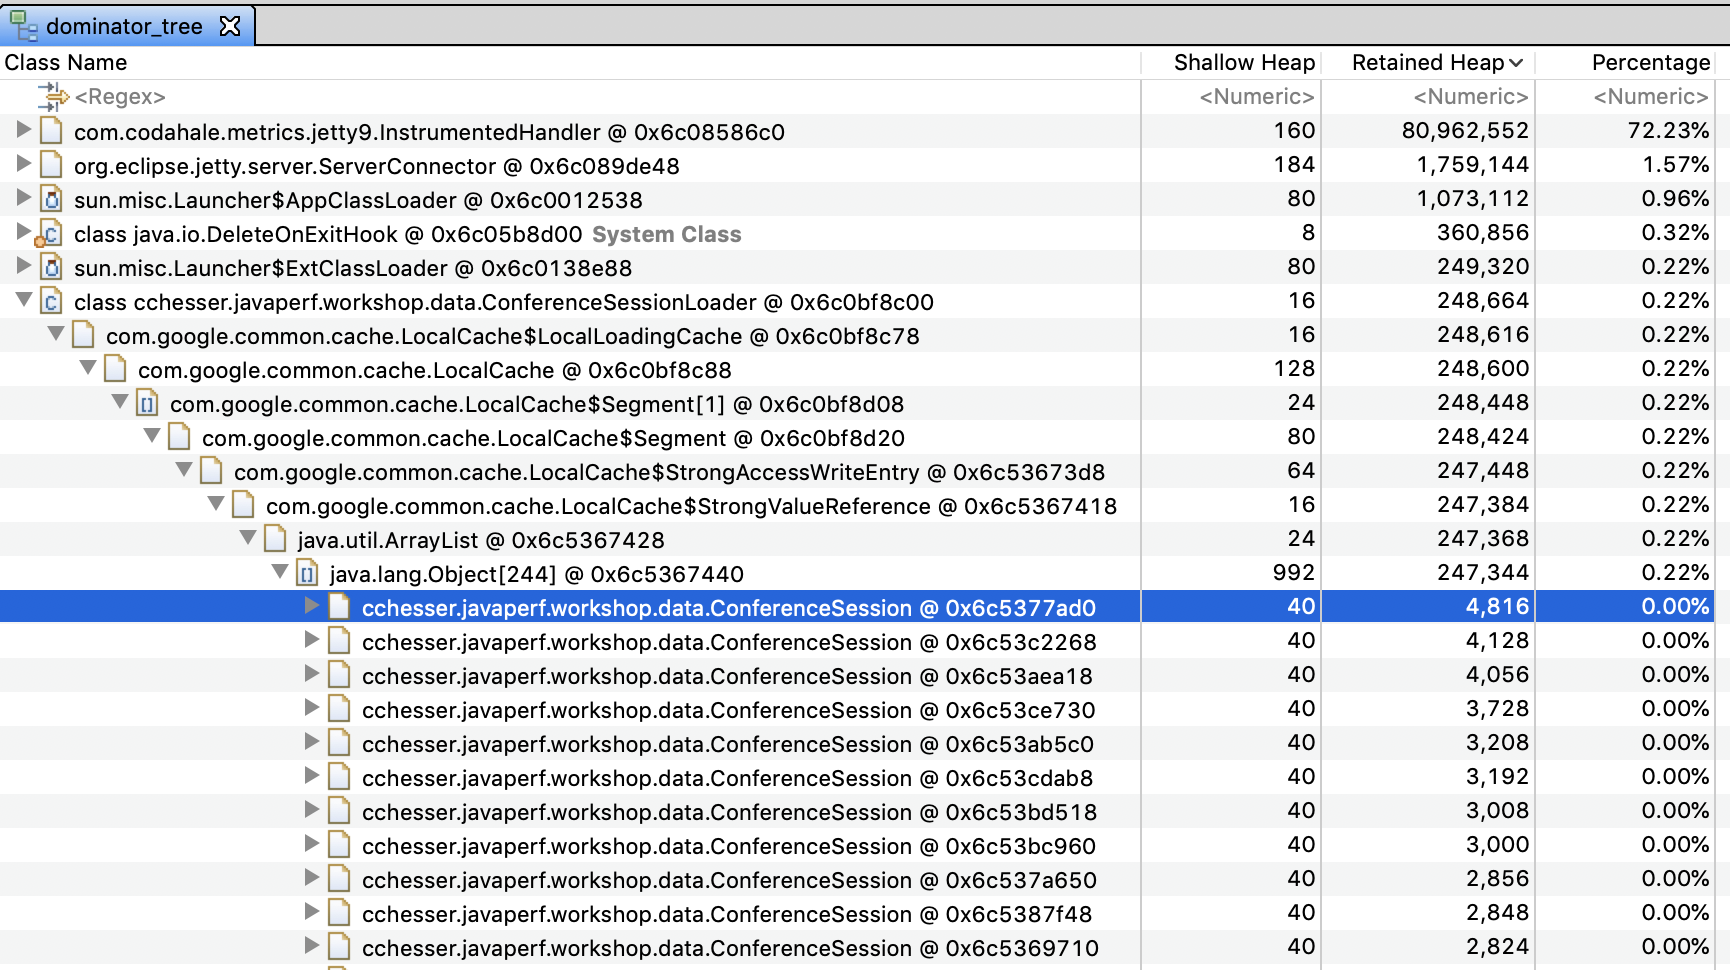
A common first area to look at your heap within Eclipse Memory Analyzer is the dominator tree. From the dominator tree, you can organize by the retained heap size, and then begin drilling down the tree to see the contributors to the largest GC roots.
Histogram
The histogram gives you a quick listing of all the top consumers by type. Typically this is going to provide context of the large consumers based on their “lower-level” types. For example, char[] is a common large contributor, which then will be followed by String which is a type that is predominately weighted by the size of the char[].
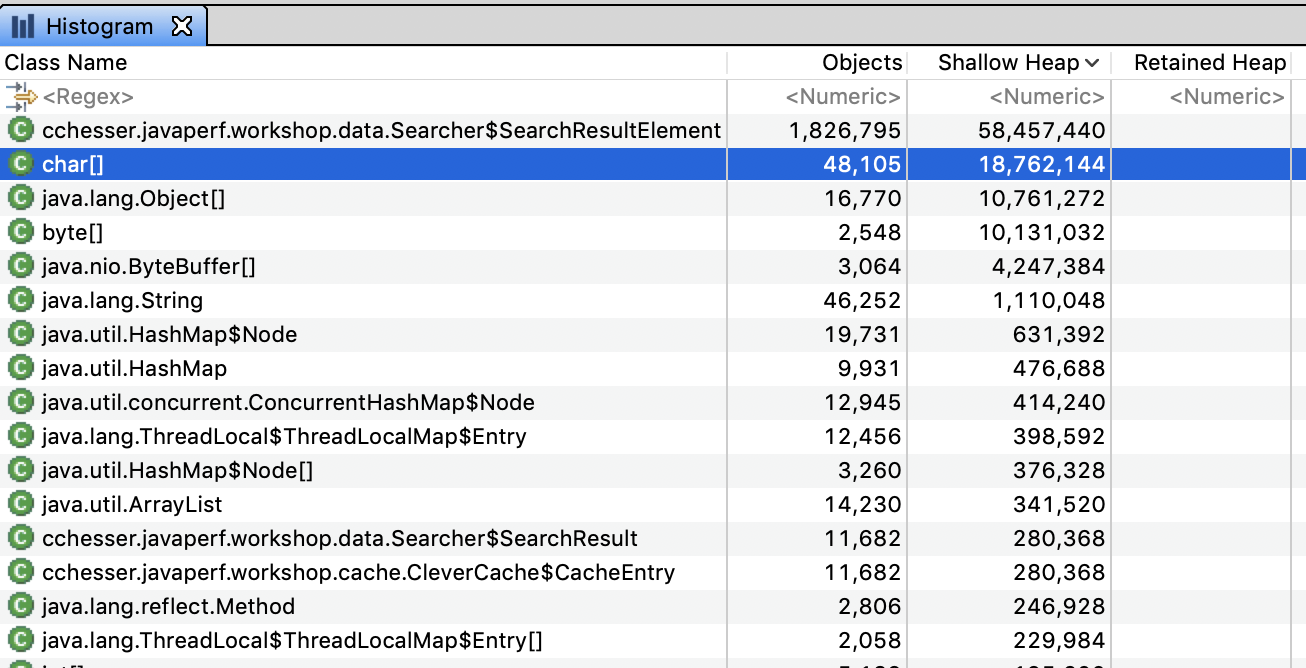
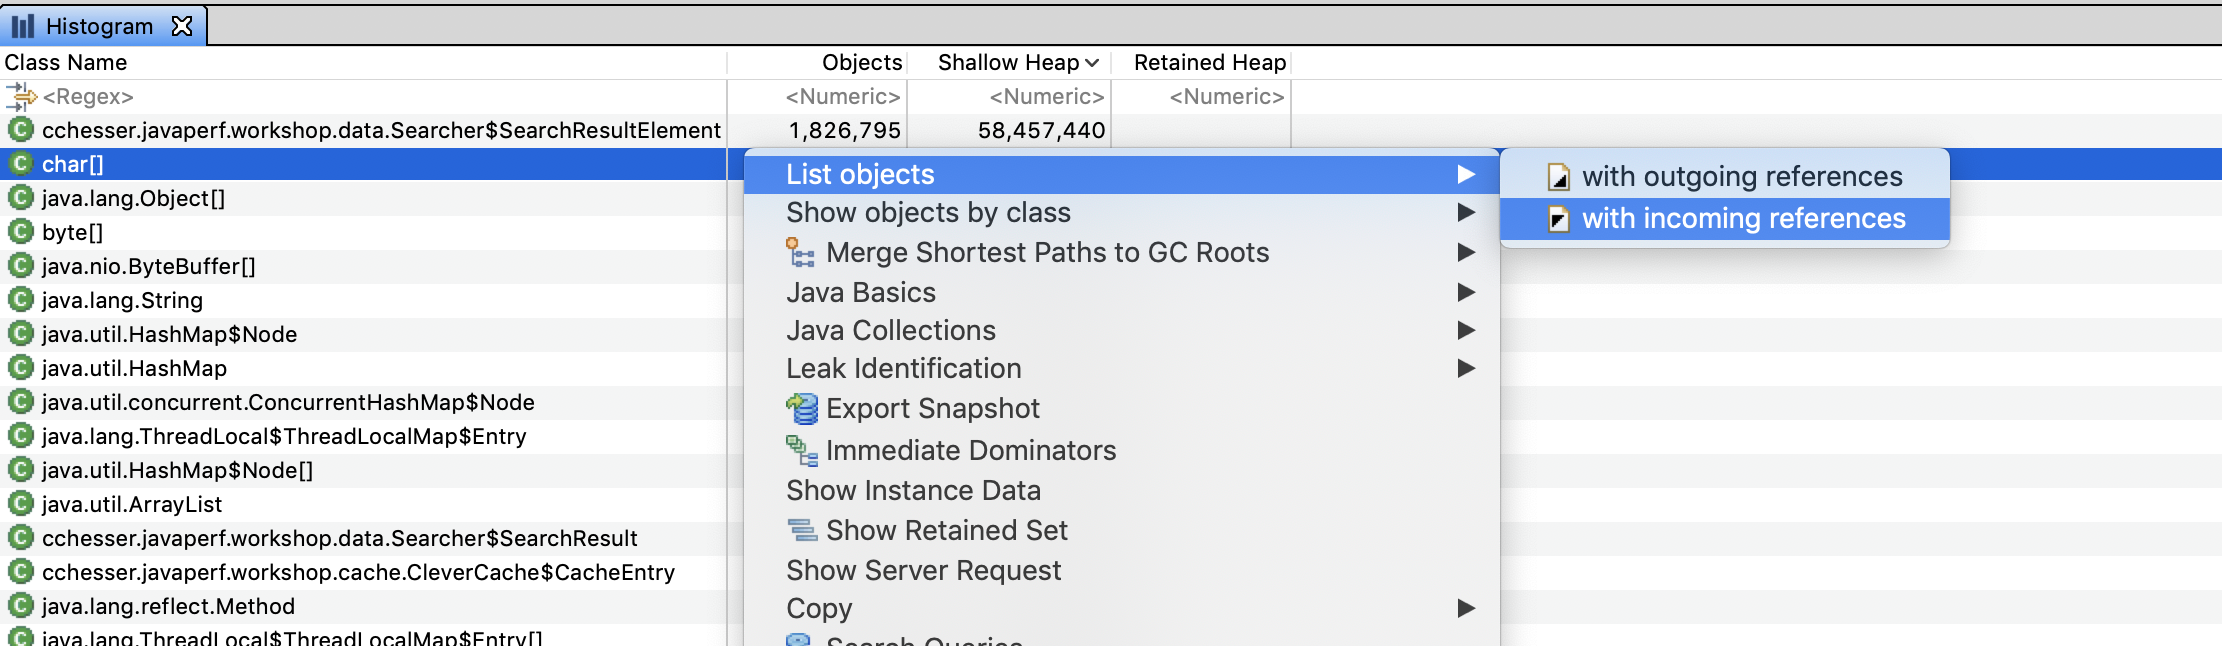
From the histogram, we can drill down into particular instances of an object and see what’s referencing them by right clicking on a row and selecting List Objects > with Incoming References
This should let us drill down into an instance and find what exactly is holding on to that specific value:
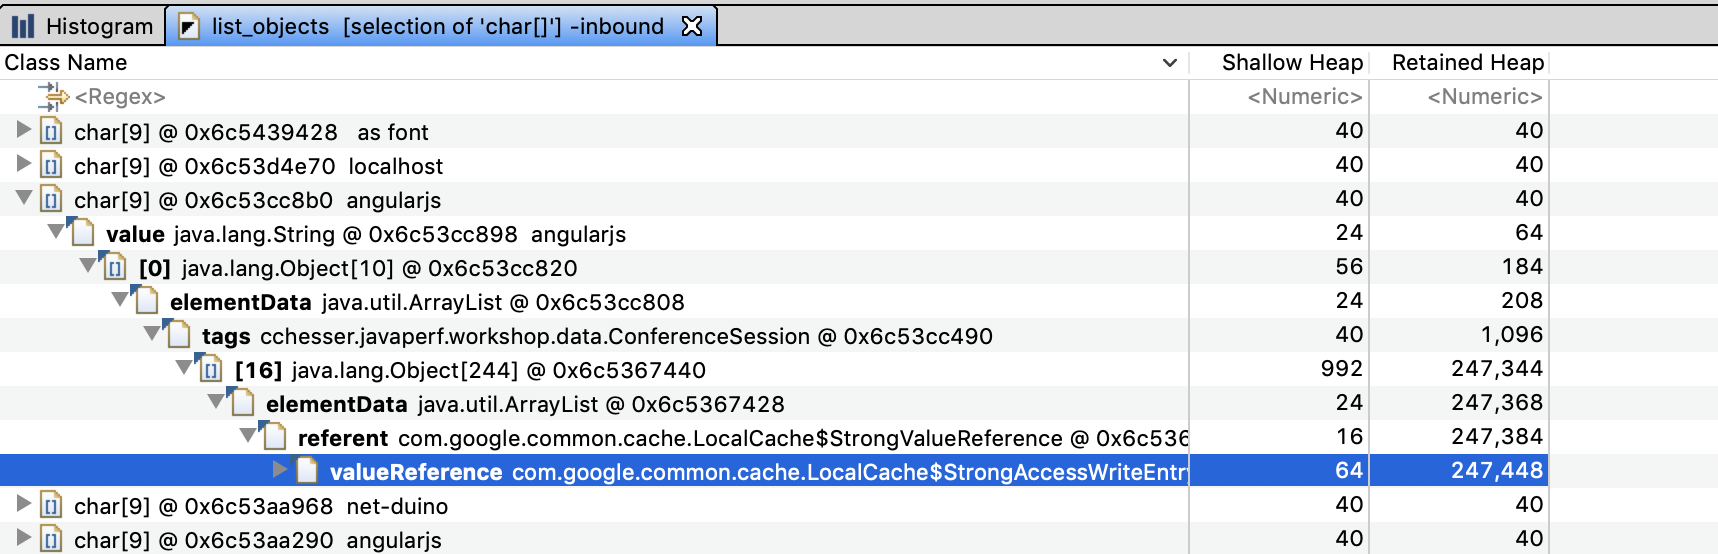
Since this view shows references by incoming link, we would read the results as:
“angularjs” is pointed to by the [0] index of the tags of a specific ConferenceSession instance, which is pointed to by LocalCache. Notice that this specific example is the inverse of what we found with the dominator tree, if we explored this table enough we would end up at a ConferenceSessionLoader reference.
Thread Overview
The thread overview is a helpful view when you are looking at contributors based on the execution of code. For example, if you have a JVM which has thrown an OutOfMemoryError, you can tell if some type of request caused a massive spike which caused the exhaustion of memory, or if the requests may have not been abnormal, there just wasn’t sufficient space to support the request.
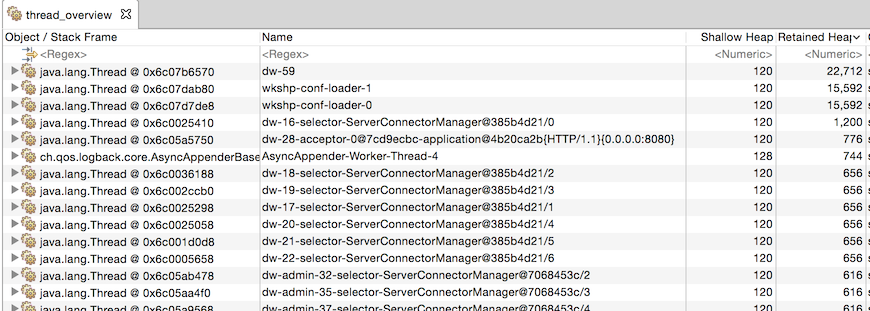
It may be the case that the thread that has the OutOfMemoryError in its stack is not the root cause. Consider the following example:
- We have a max heap of 128 Mb.
- A request comes in that produces a 125Mb
int[] - A second request comes in that produces a 5Mb
int[].
The JVM would potentially throw the OutOfMemory on that second request, since there’s not enough memory to allocate 5Mb, however, it might be the case that the code path for the initial request is allocating memory unnecessarily.
OQL
Another strong feature of Eclipse Memory Analyzer is the OQL studio to execute queries to do lookup on objects in your heap.
Lookup our ConferenceSession class type:
SELECT *
FROM INSTANCEOF cchesser.javaperf.workshop.data.ConferenceSession
💡 To execute the query, you click on the red exclamation mark (:exclamation:). Alternatively, you can press CTRL+Enter on Windows or Command+Enter on macOS.
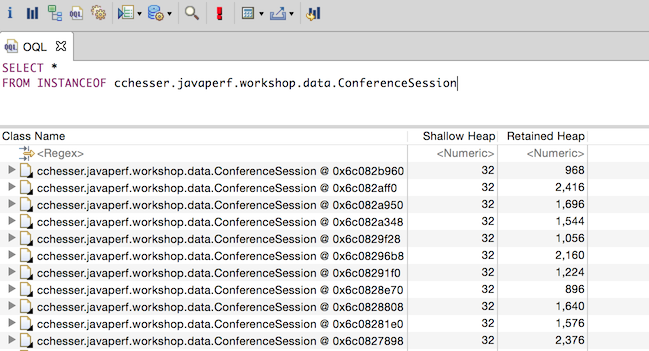
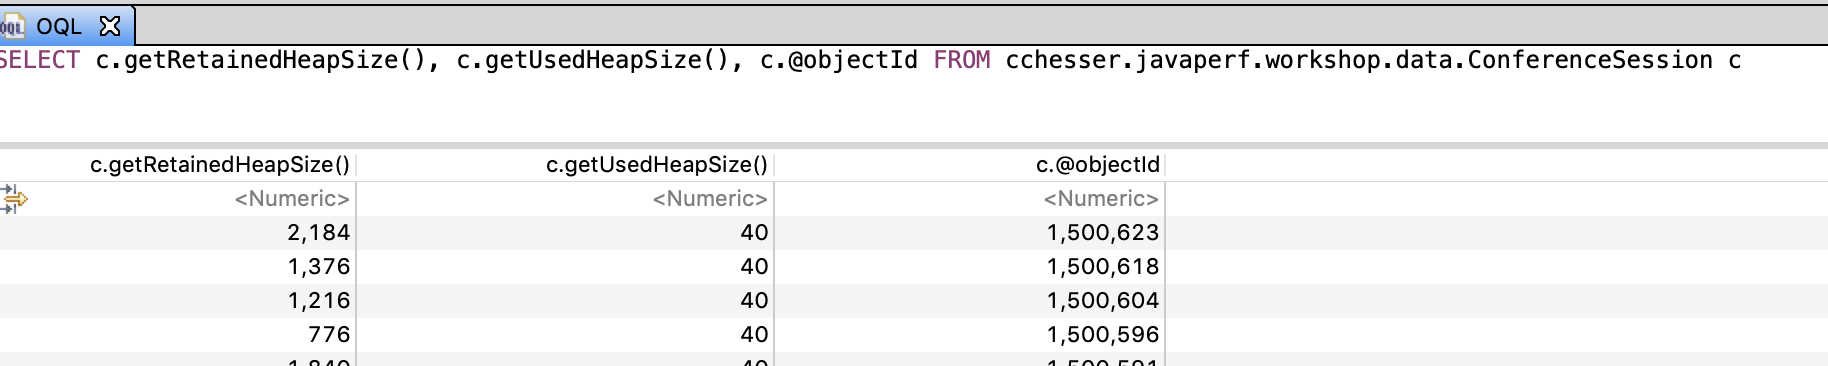
By returning the raw type back, you can expand each one to further look at the contents of the object. If you wanted to just report the object with its title attribute and the object’s retained sized, you could do this:
SELECT c.title.toString(), c.@retainedHeapSize
FROM INSTANCEOF cchesser.javaperf.workshop.data.ConferenceSession c
Now, you could then filter this by including a WHERE clause, where you can filter it by
the title or the abstract:
SELECT c.title.toString(), c.@retainedHeapSize FROM INSTANCEOF cchesser.javaperf.workshop.data.ConferenceSession c
WHERE c.title.toString() LIKE ".*(J|j)ava.*" OR c.abstract.toString() LIKE ".*(J|j)ava.*"
Reference: Eclipse Memory Analyzer OQL Syntax
The auto-completion will also let you invoke fields and method’s from Eclipse Mat’s own internal model for the heap dump. You can view other methods available by exploring the API Reference
Useful Plugins
Calcite MAT
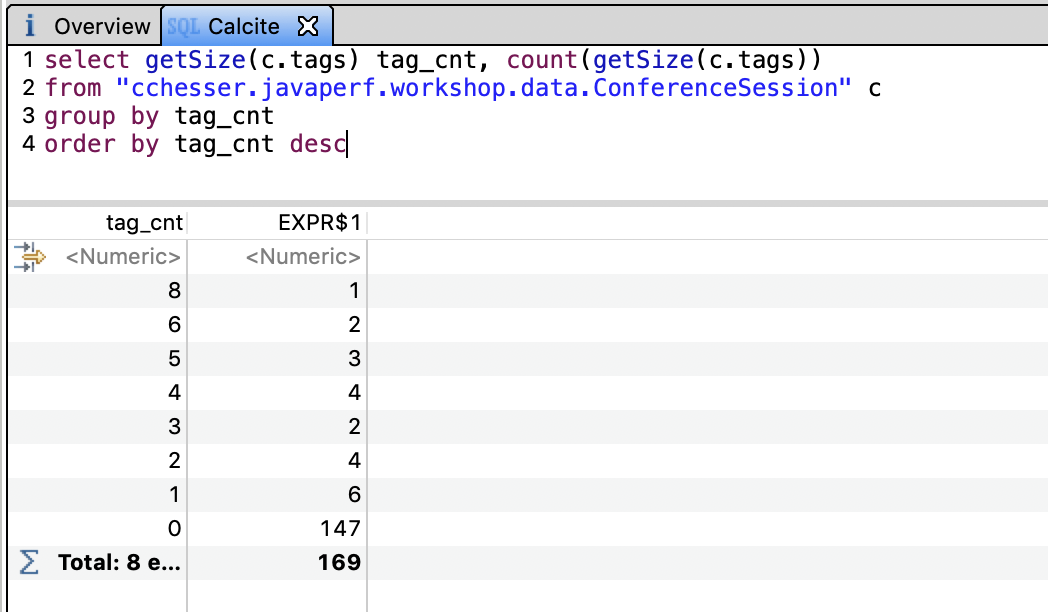
The Calcite MAT Plugin adds sort, group by and join behavior (among other things) and an additional SQL query engine.
We can use this plugin to do some more advanced analysis, for example:
- Getting a distribution of the number of tags in our ConferenceSessions
select getSize(c.tags) tag_cnt, count(getSize(c.tags))
from "cchesser.javaperf.workshop.data.ConferenceSession" c
group by tag_cnt
order by tag_cnt desc
In the next section, we'll continue our analysis in VisualVM.
VisualVM