Threads
The Threads page provides a snapshot of all threads in our application, and we can use it to acquire information about computation and latency events.
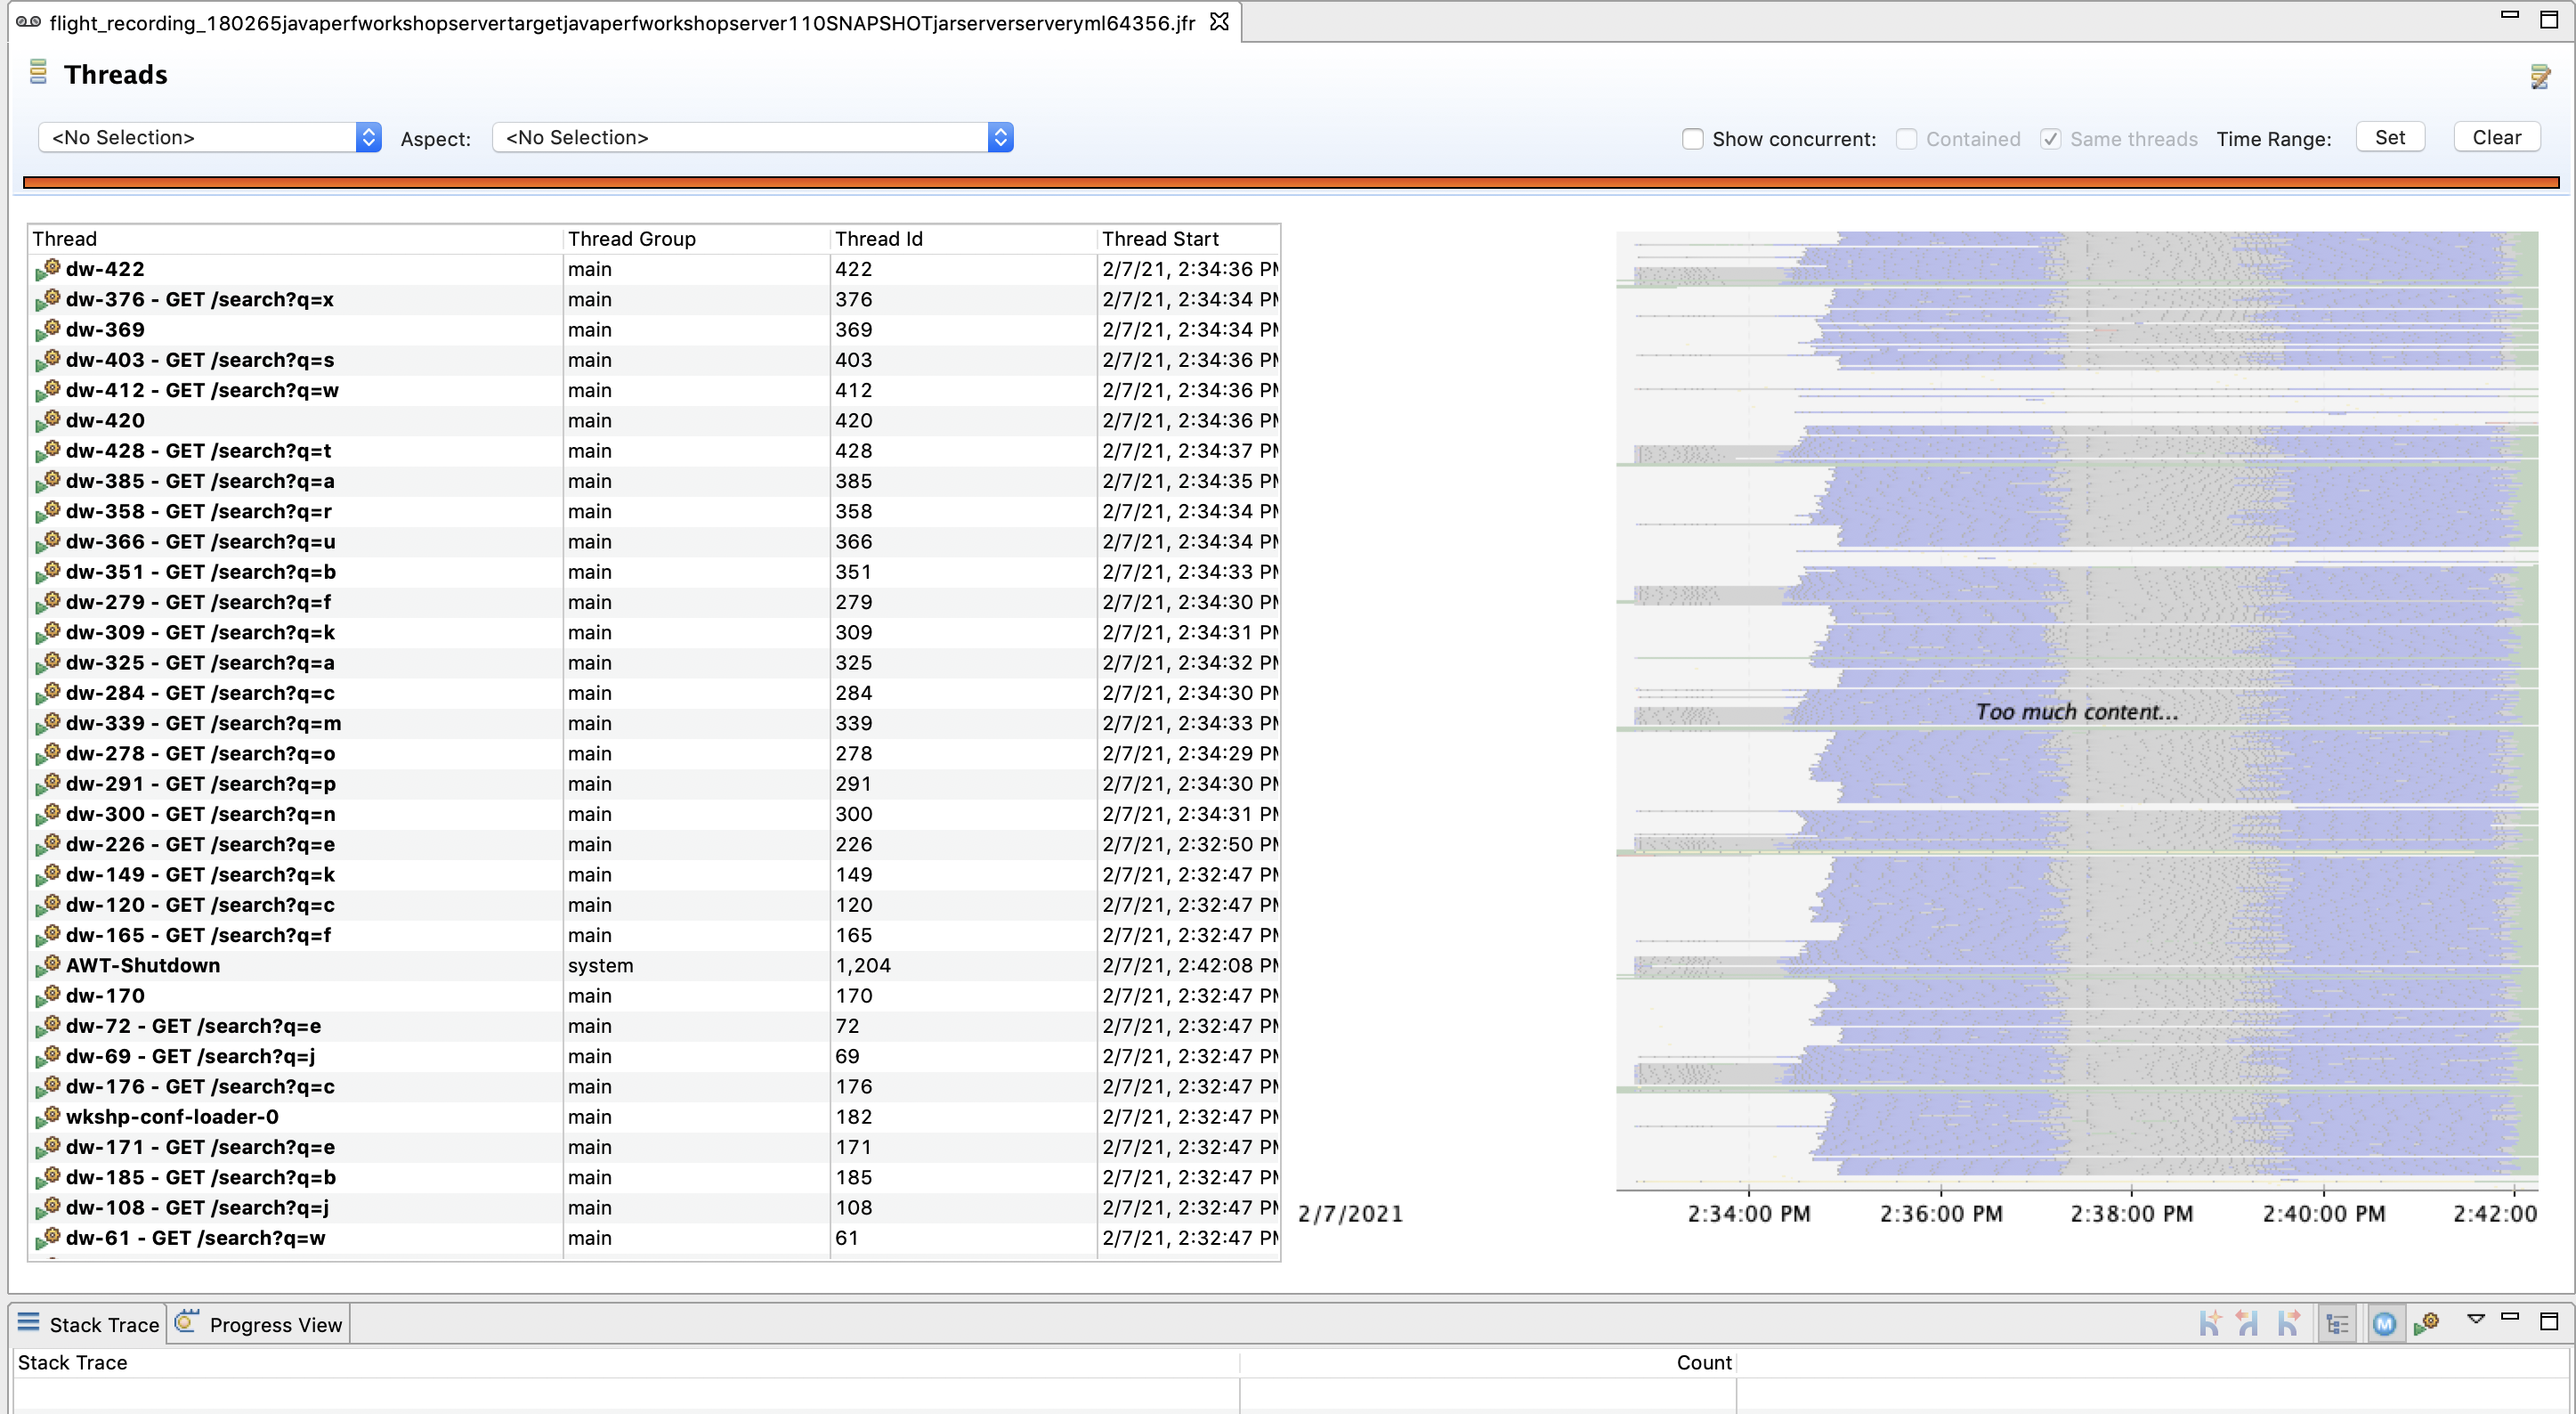
Thread Chart
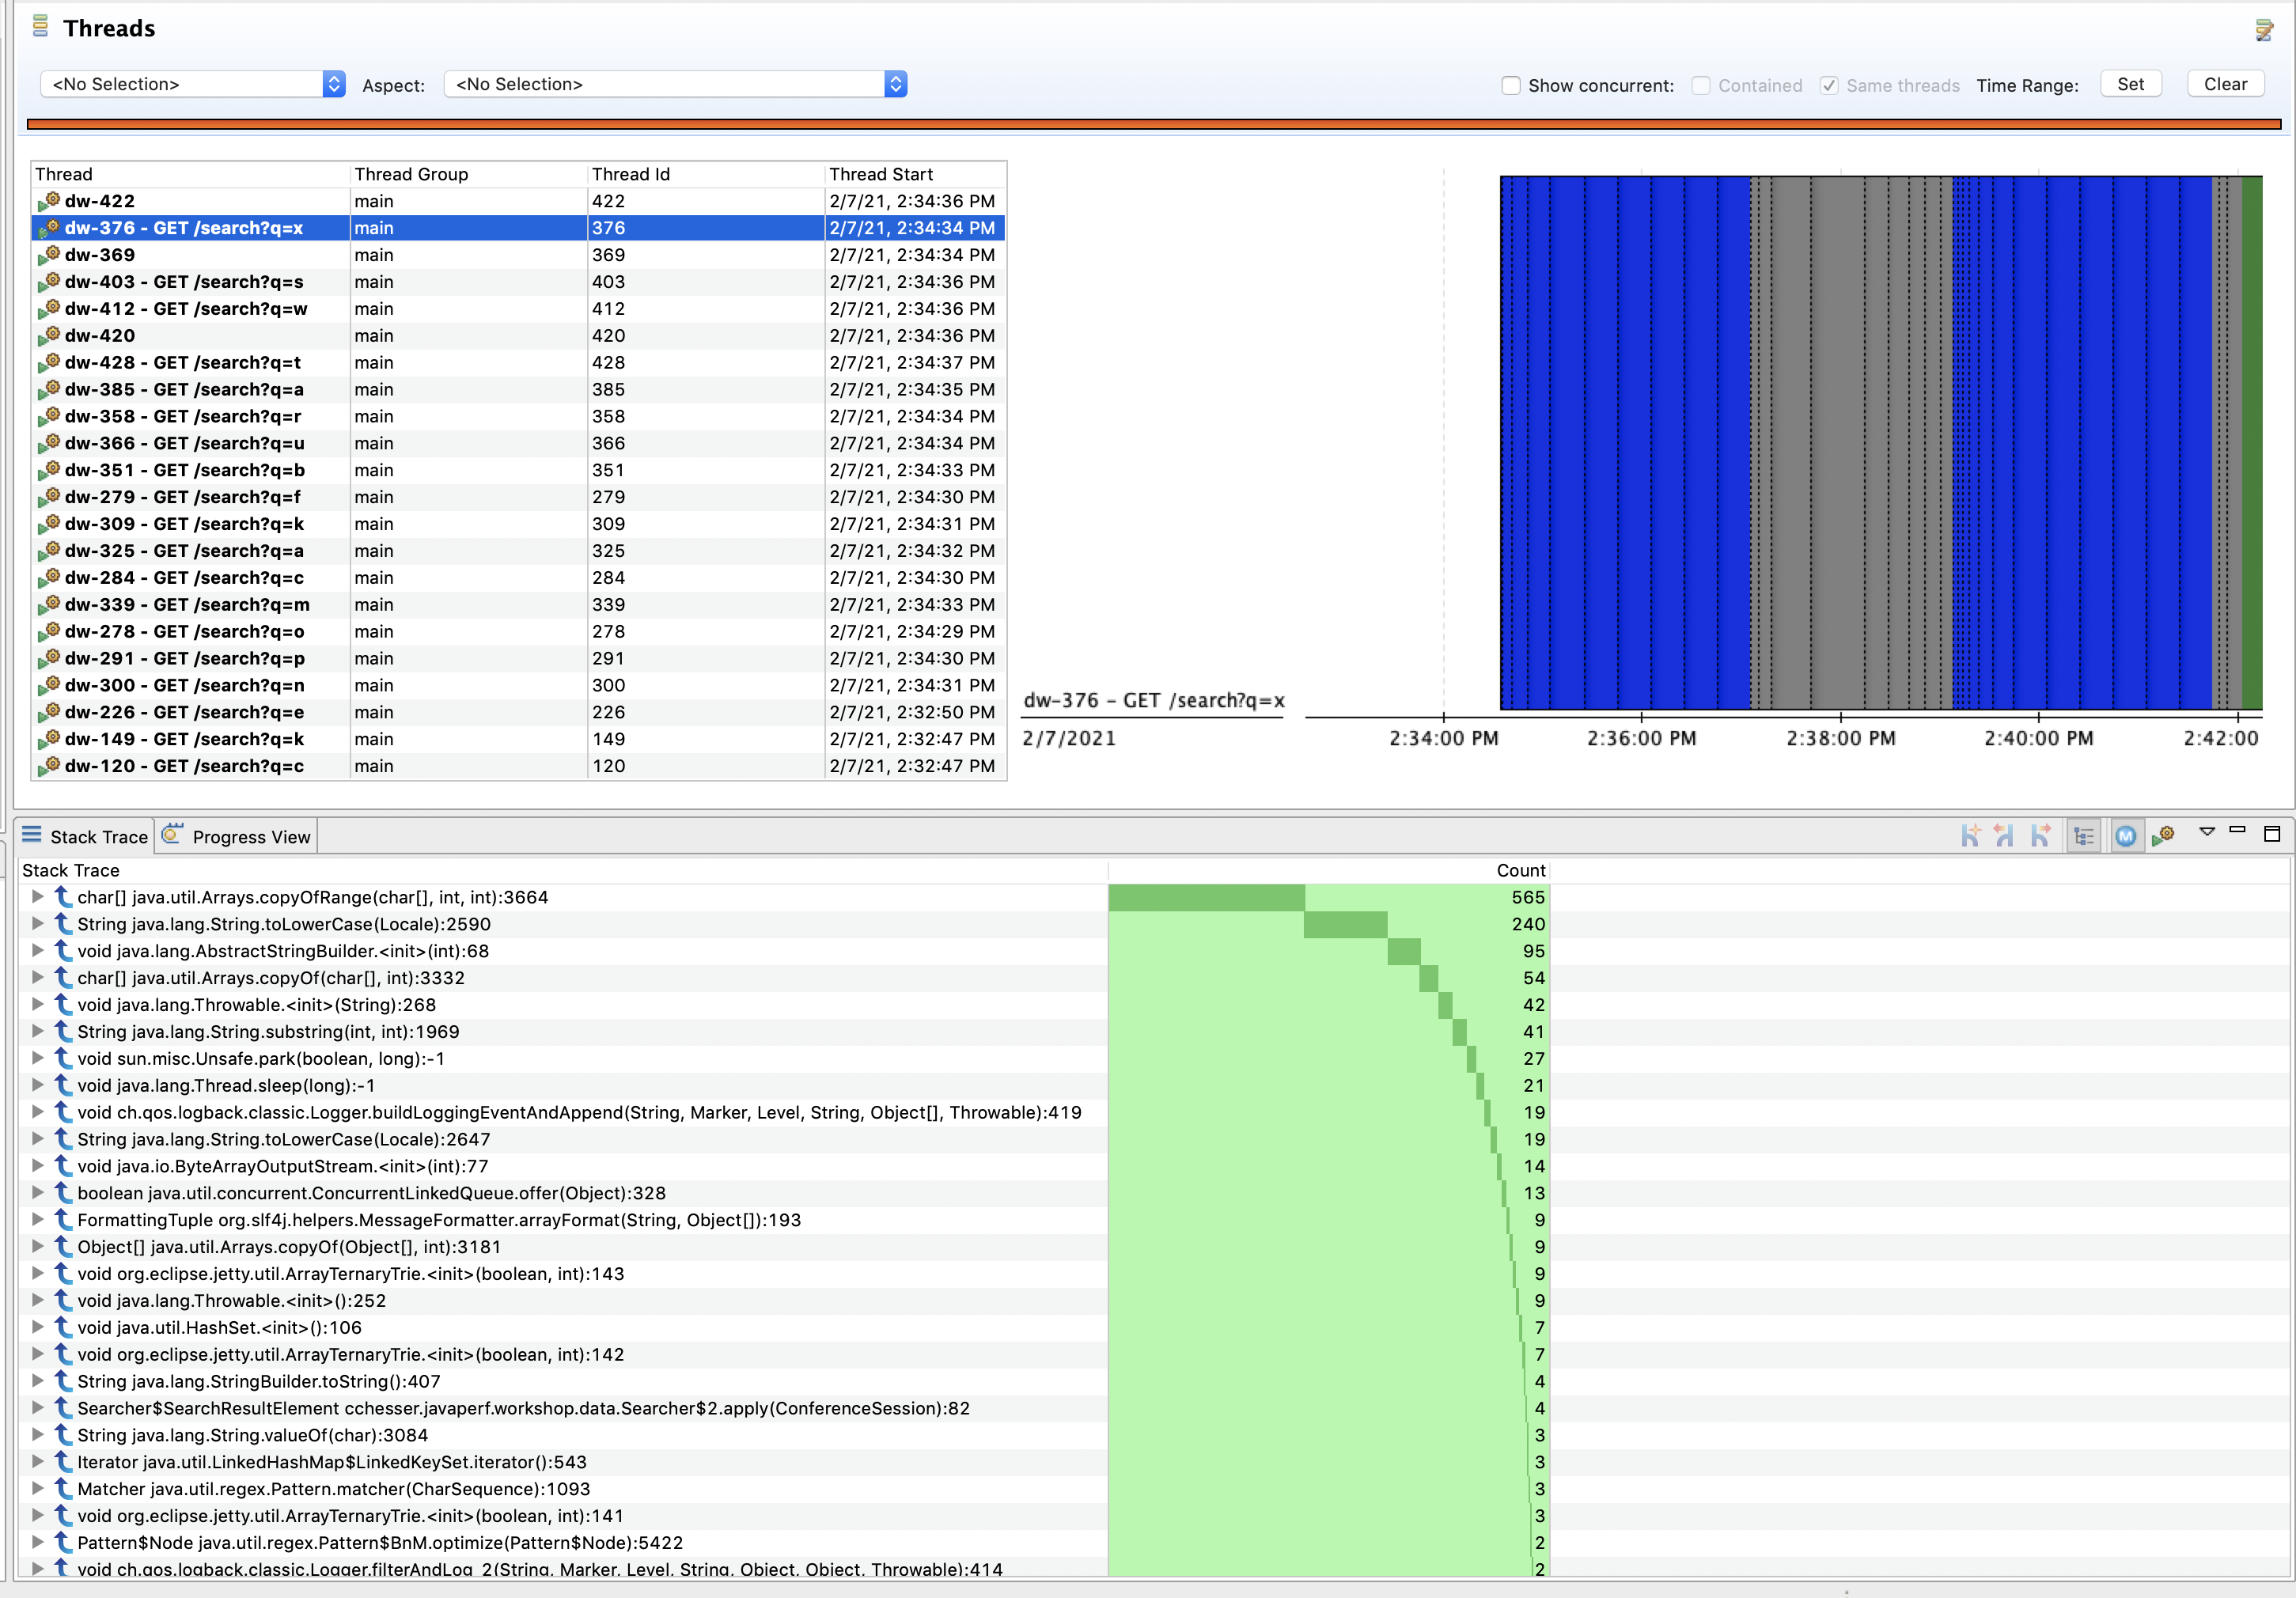
We can use the Thread Chart view to select a region of time and view the state of threads and the most common stack frames for that particular time slice:
We can also edit the types of events shown by the chart. Right click on the chart, and select Edit Thread Activity Lanes
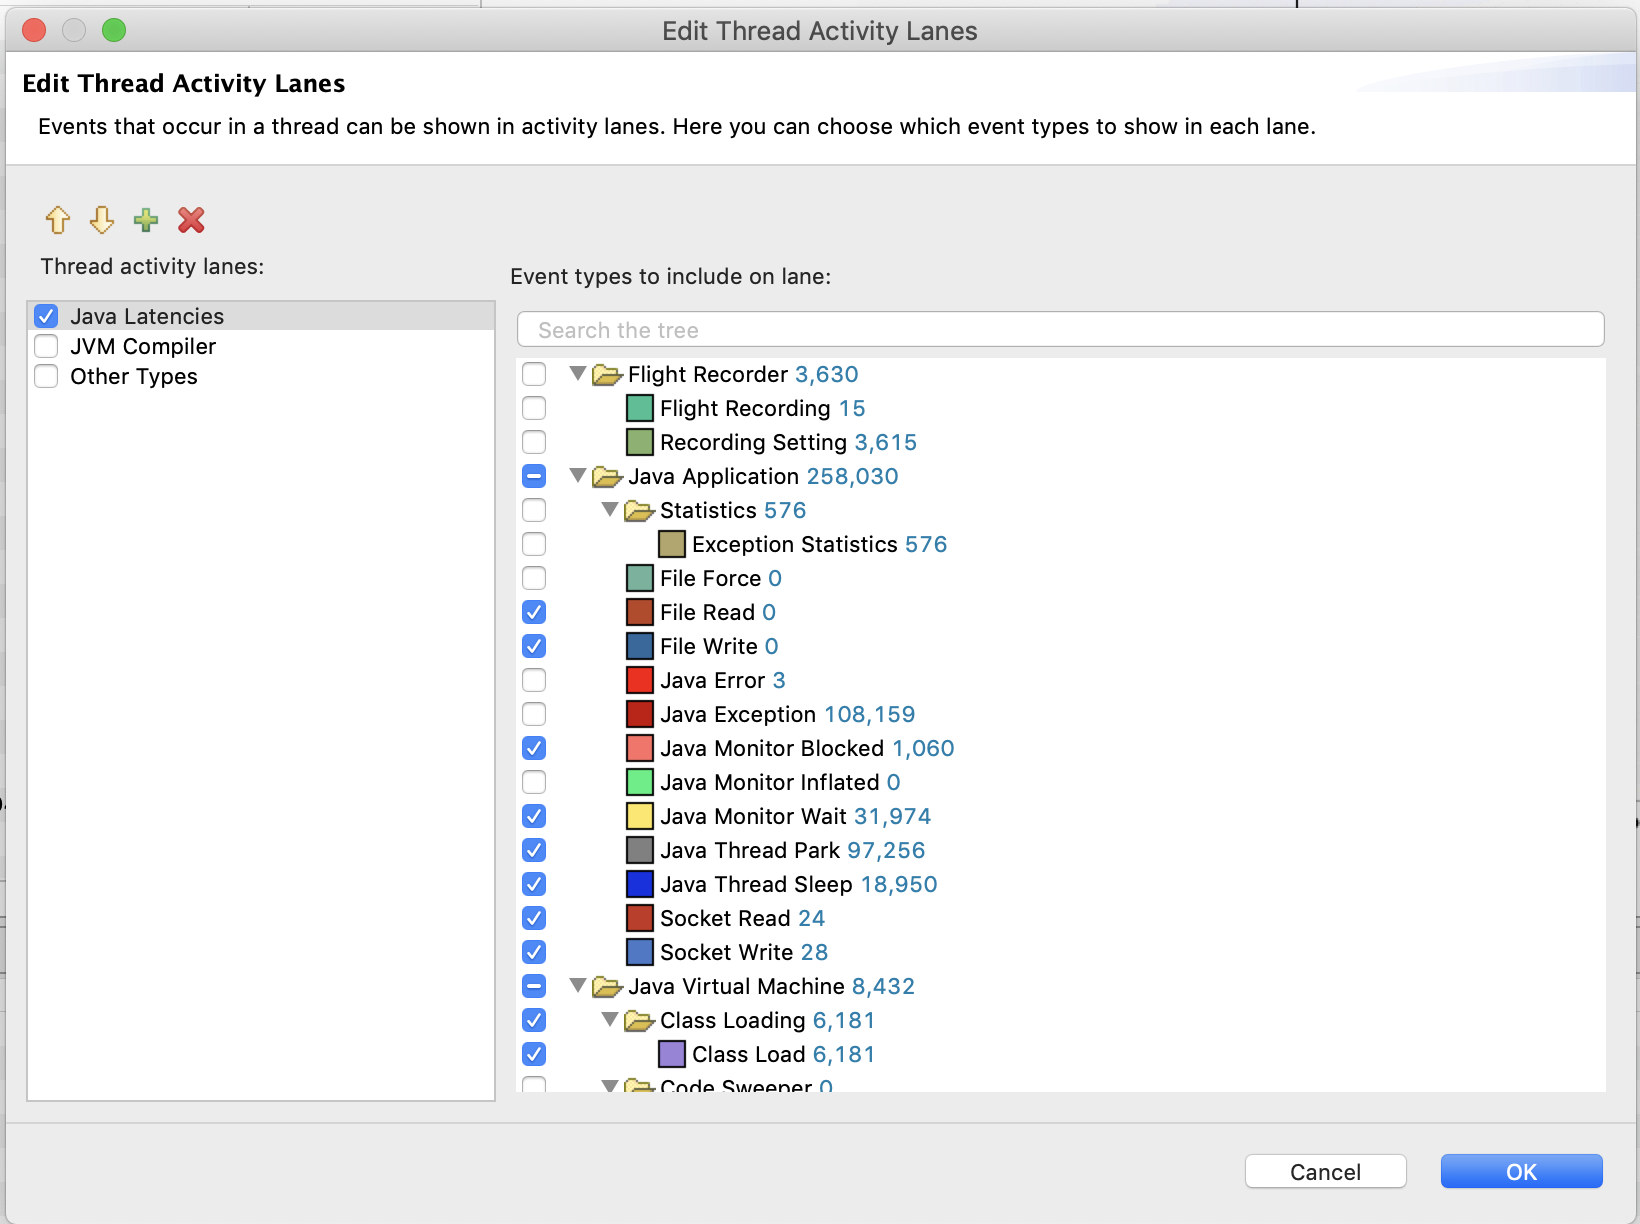
We can then narrow down on specific events.
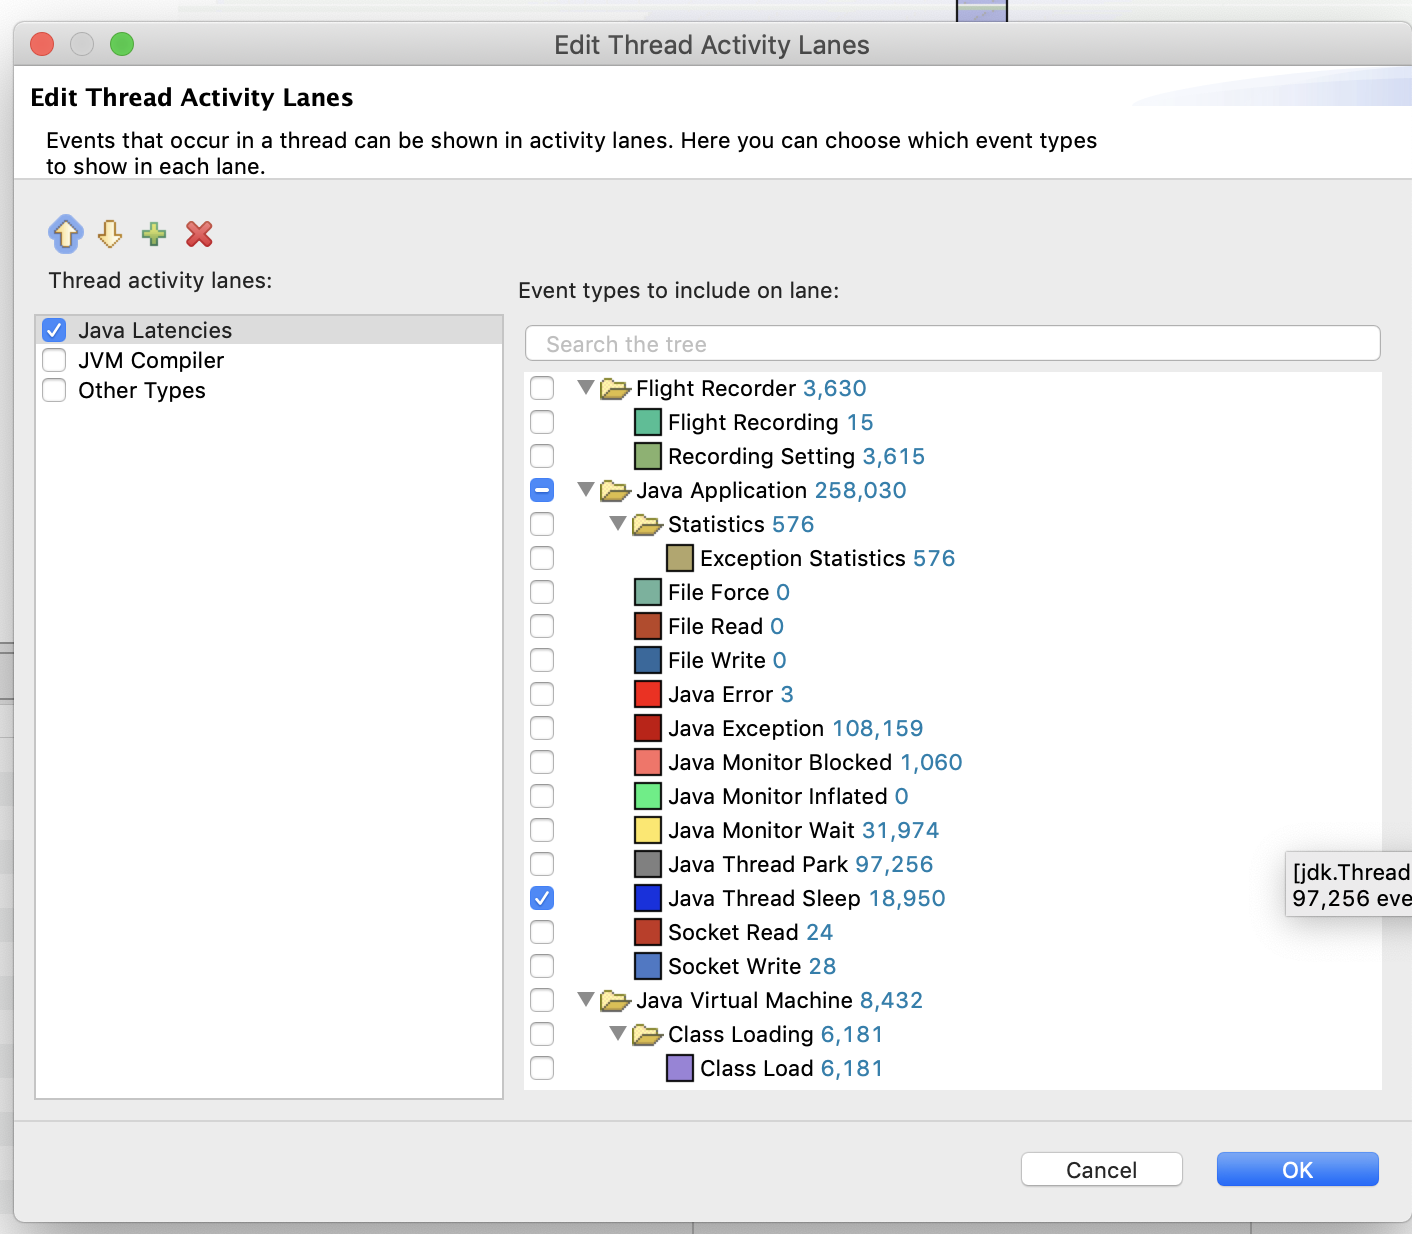
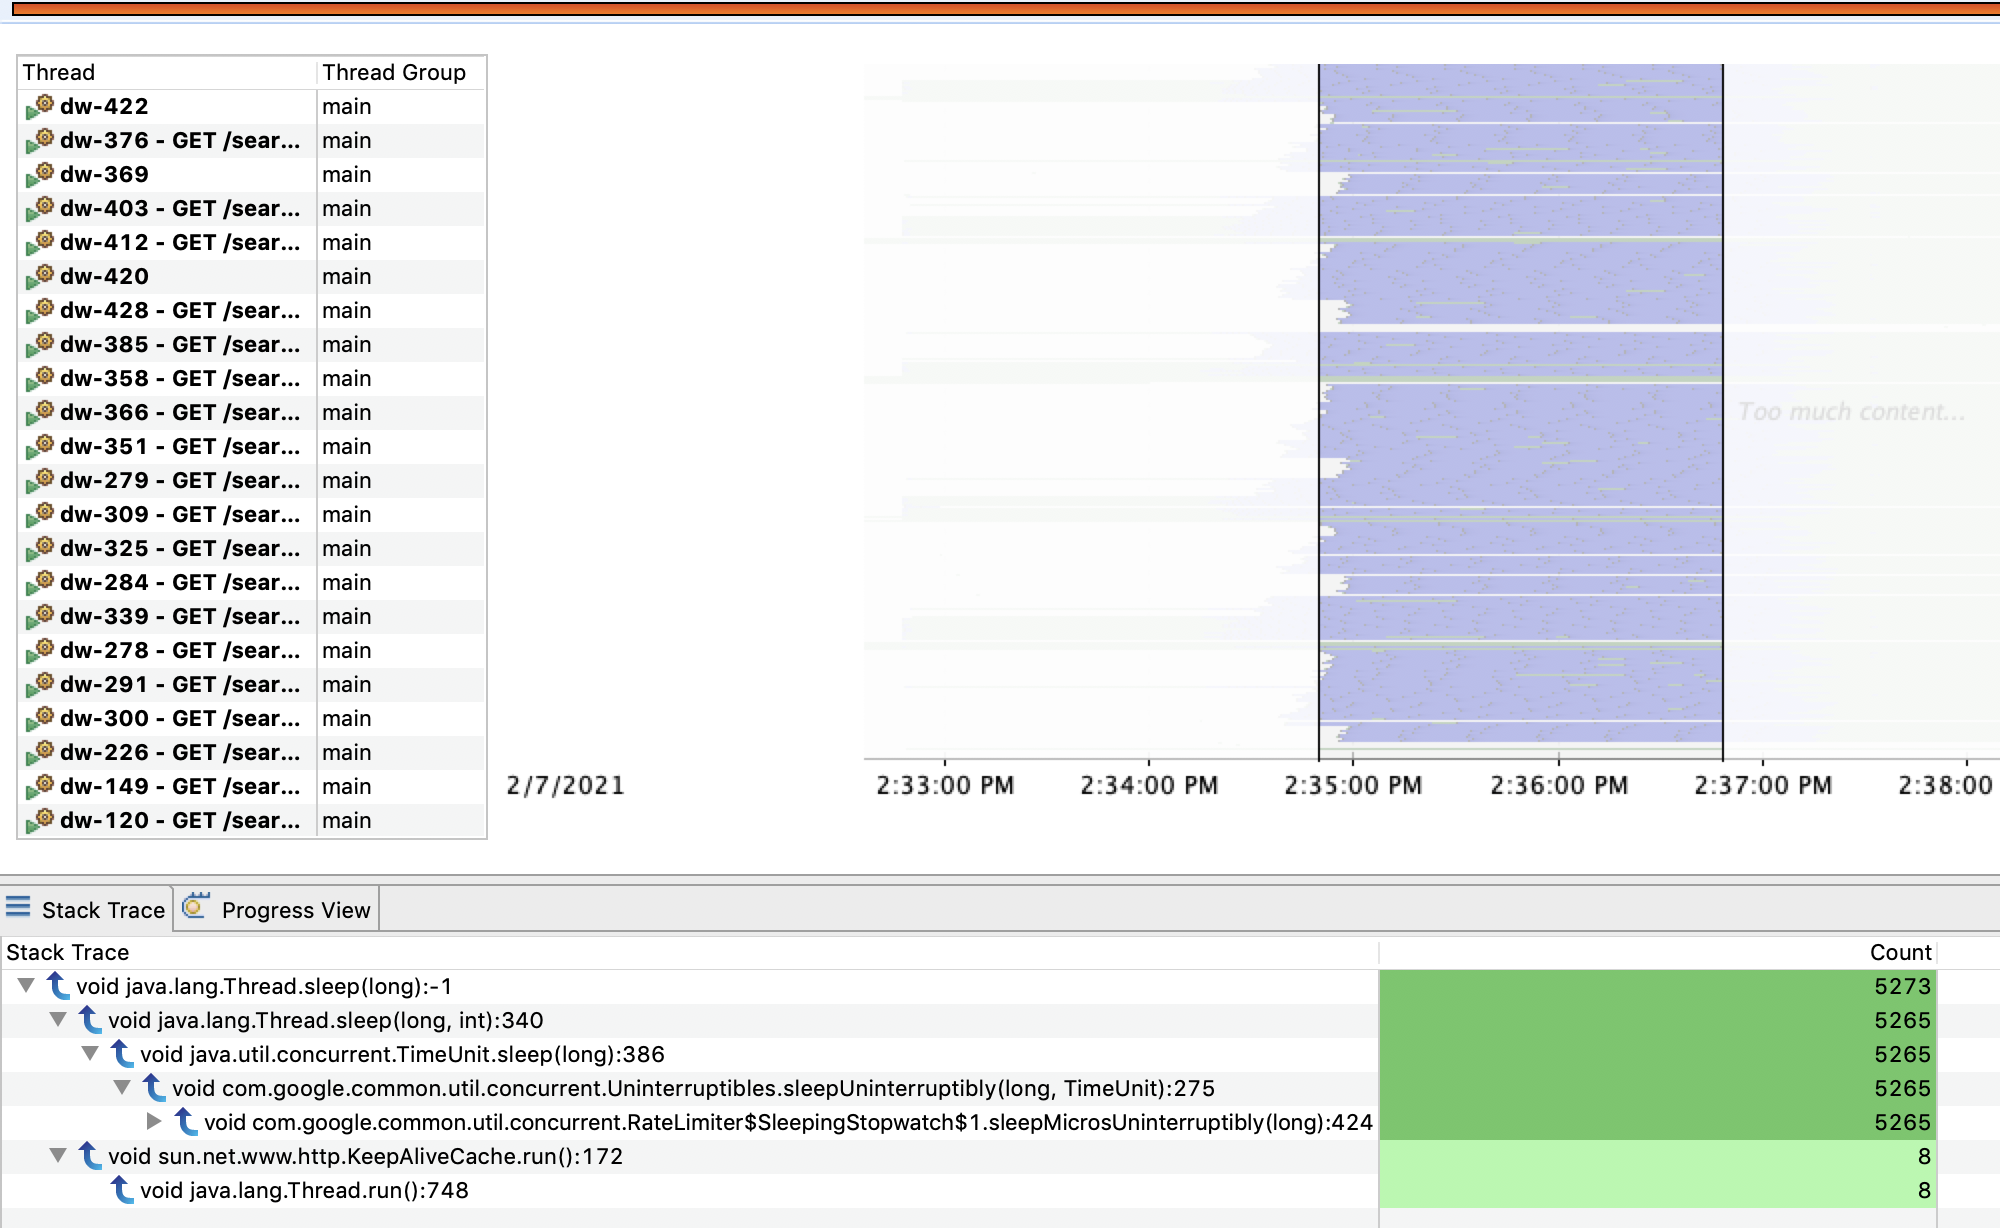
For the purpose of this section filter on only the Sleep events. Then, select a period of time and look at what has caused our threads to go to sleep for that particular period:
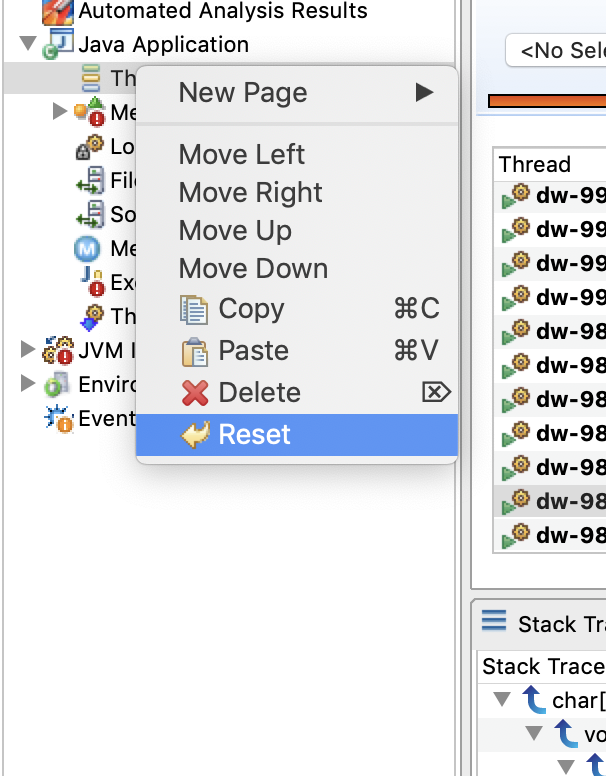
Once you’re done with the filtered view, right click on the Thread page and Reset the page (to return to the default state).
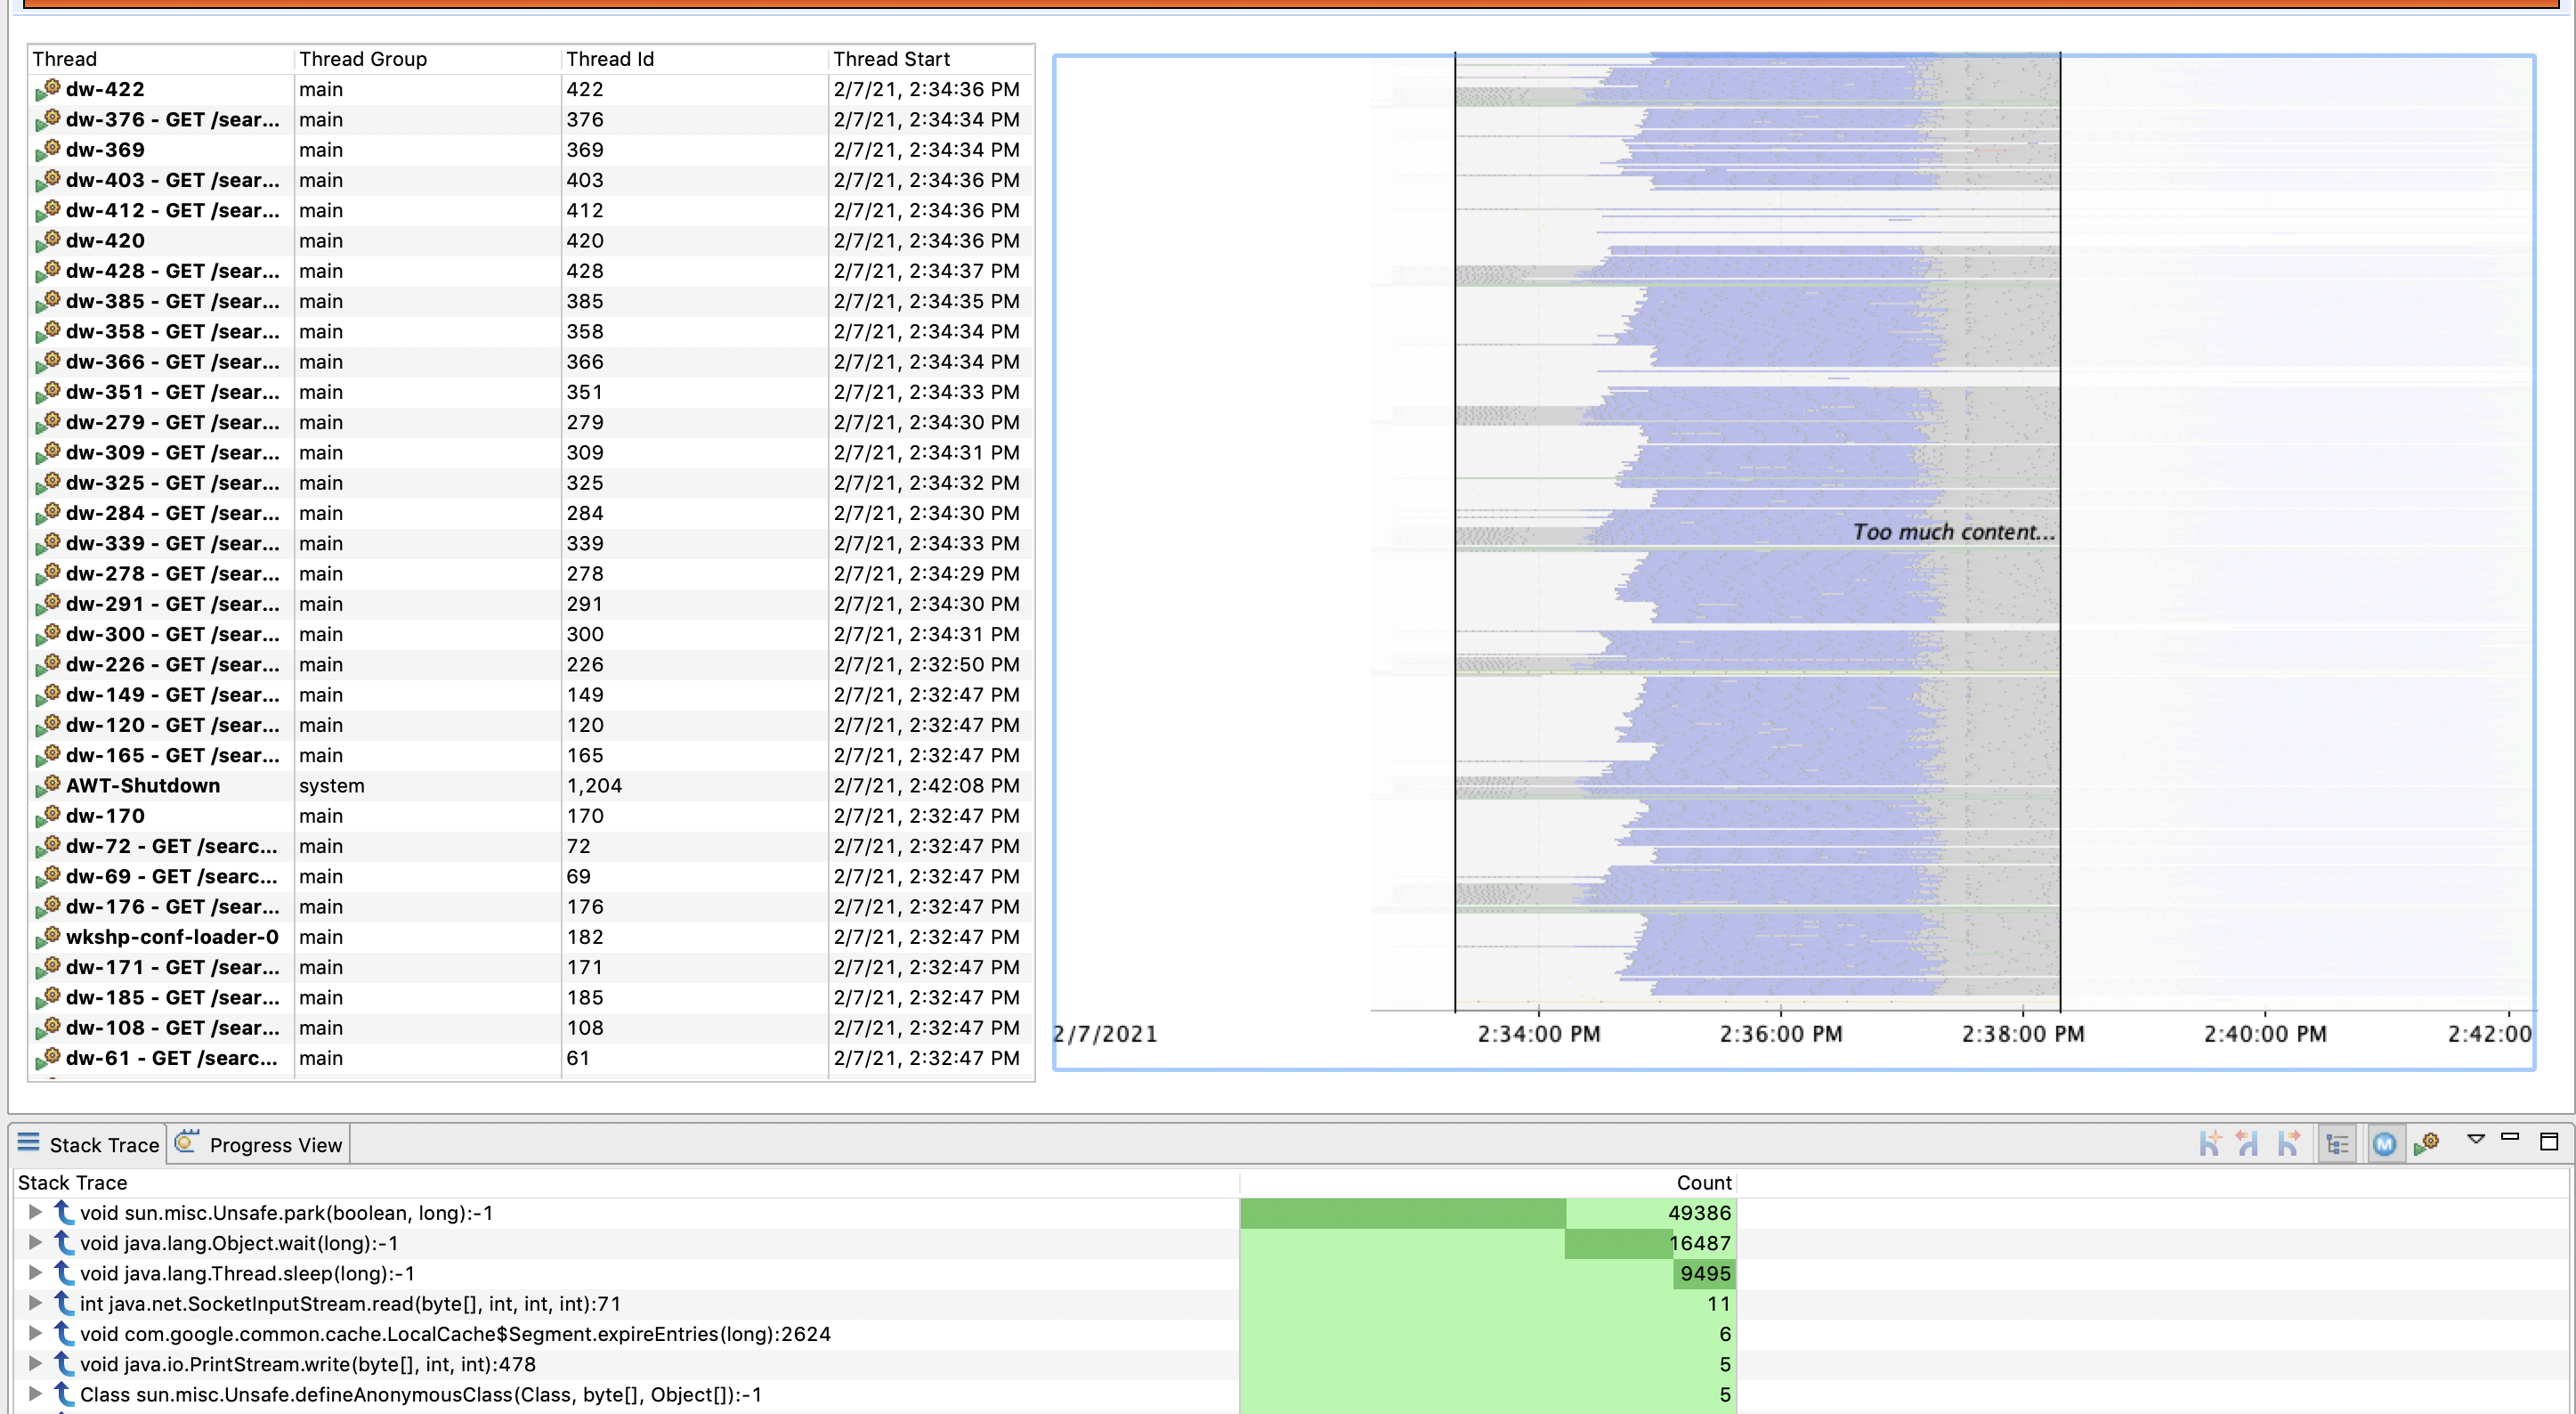
By Thread
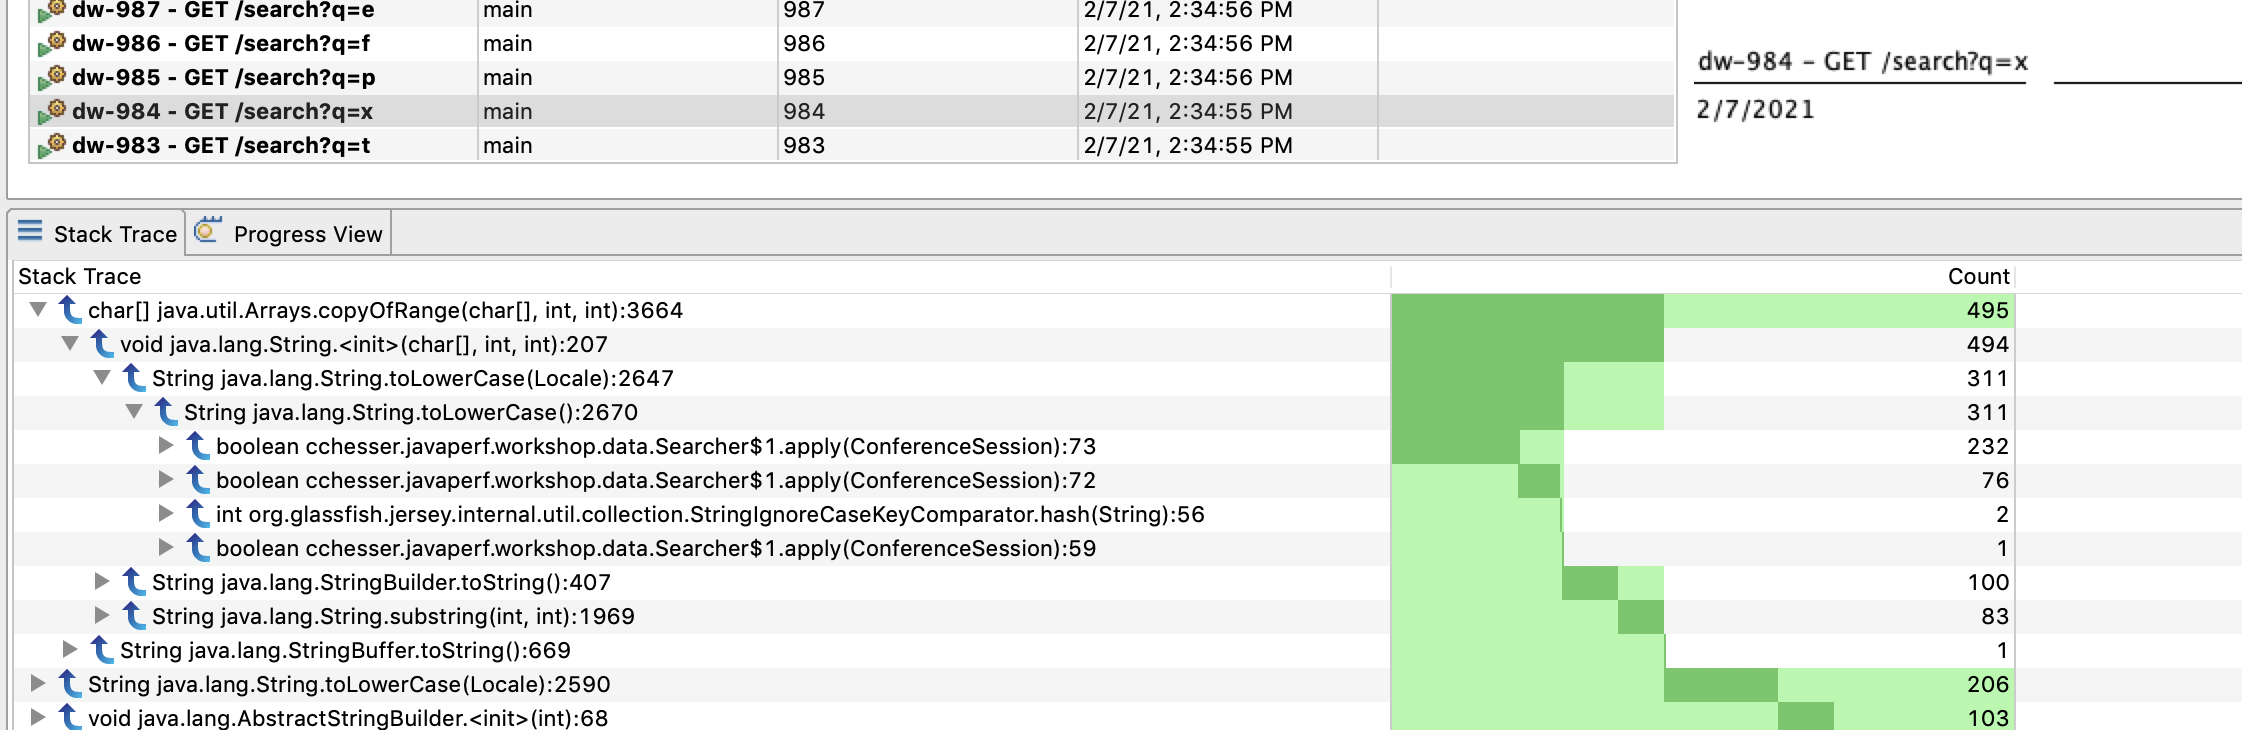
We can select an individual thread from the Thread Table to further filter the data just for that thread. From this filtered view, we can inspect what the commonly executed methods are for a particular thread.
We can then use the stacktrace view to correlate what piece of code executed the most.
Explore
There’s a couple of threads specifically created by our application, these are the wkshp-conf-loader named threads. The dw-* named threads are threads created by DropWizard to handle specific requests (you might have noticed this based on the name containing a REST Resource). Explore the state of some of these threads while thinking about the follow up questions.
Follow Ups
- Where are we spending most of our time sleeping? What is causing this?
- Are there any unnecessary method invocations? Are any threads doing work that isn’t visible?
In the next section, we'll look at the Memory state of our application.
Memory