Introduction
7 minute read
Java Flight Recorder
The Java Flight Recorder (JFR) is a very low overhead profiling and diagnostics tool. It was inherited from the JRockit JVM, and originally was offered as part of the HotSpot JVM. It is designed to be “black box” data recorder of the the run-time, which can be used in production environments, making it an attractive tool for profiling code since it has low overhead on the JVM.
Newer versions of JMC are developed as part of the OpenJDK Mission Control project.
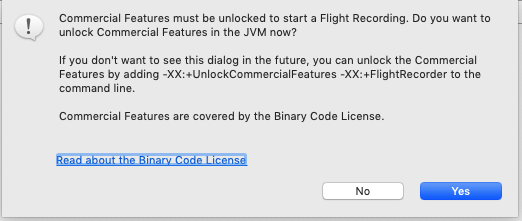
To enable the Flight Recorder on the JVM, the following options need to be included on the JVM:
-XX:+UnlockCommercialFeatures -XX:+FlightRecorder
❗ Notice that you have to include -XX:+UnlockCommercialFeatures first in the options listing. This is because using Flight Recorder is a feature that requires additional licensing when used in production environments. One of the following licenses is required in order to utilize this in a production environment.
- Oracle Java SE Advanced
- Oracle Java SE Suite
However, you may use this in non-production environments without additional licensing.
Higher Fidelity on Method Profiling
To get better fidelity on method profiling, include the following options which will enable the compiler to include additional metadata on non-safe code points. This is helpful, as sometimes the metadata will not fully resolve to the correct line in the code.
-XX:+UnlockDiagnosticVMOptions -XX:+DebugNonSafepoints
Java Mission Control
We will be using Java Mission Control to monitor and evaluate the Java flight recordings. To start up Java Mission Control, simply executing the following in your console:
jmc
💡 In order to be able to invoke jmc (Java Mission Control) from your console, it assumes $JAVA_HOME/bin is on your $PATH. If it is not included, go ahead and update your profile to include this so you can easily invoke jmc from your terminal.
Start Service with JFR
Let’s start profiling our service. Start the service up by enabling JFR:
Start from the console
# Note, if you are running this server from a different folder, consider changing the SERVER_HOME
SERVER_HOME=java-perf-workshop-server/target
java -XX:+UnlockCommercialFeatures -XX:+FlightRecorder -XX:+UnlockDiagnosticVMOptions -XX:+DebugNonSafepoints -jar $SERVER_HOME/java-perf-workshop-server-1.1.0-SNAPSHOT.jar server server.yml
💡 Starting with Java Mission Control 5.5 (included in Oracle Java 8u40), you no longer have to enable JFR prior to capturing the recording (it will dynamically enable it, after prompting about it).
Start Flight Recording from JMC
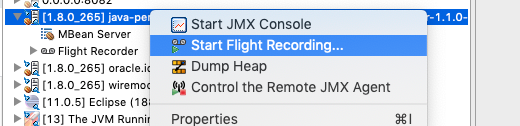
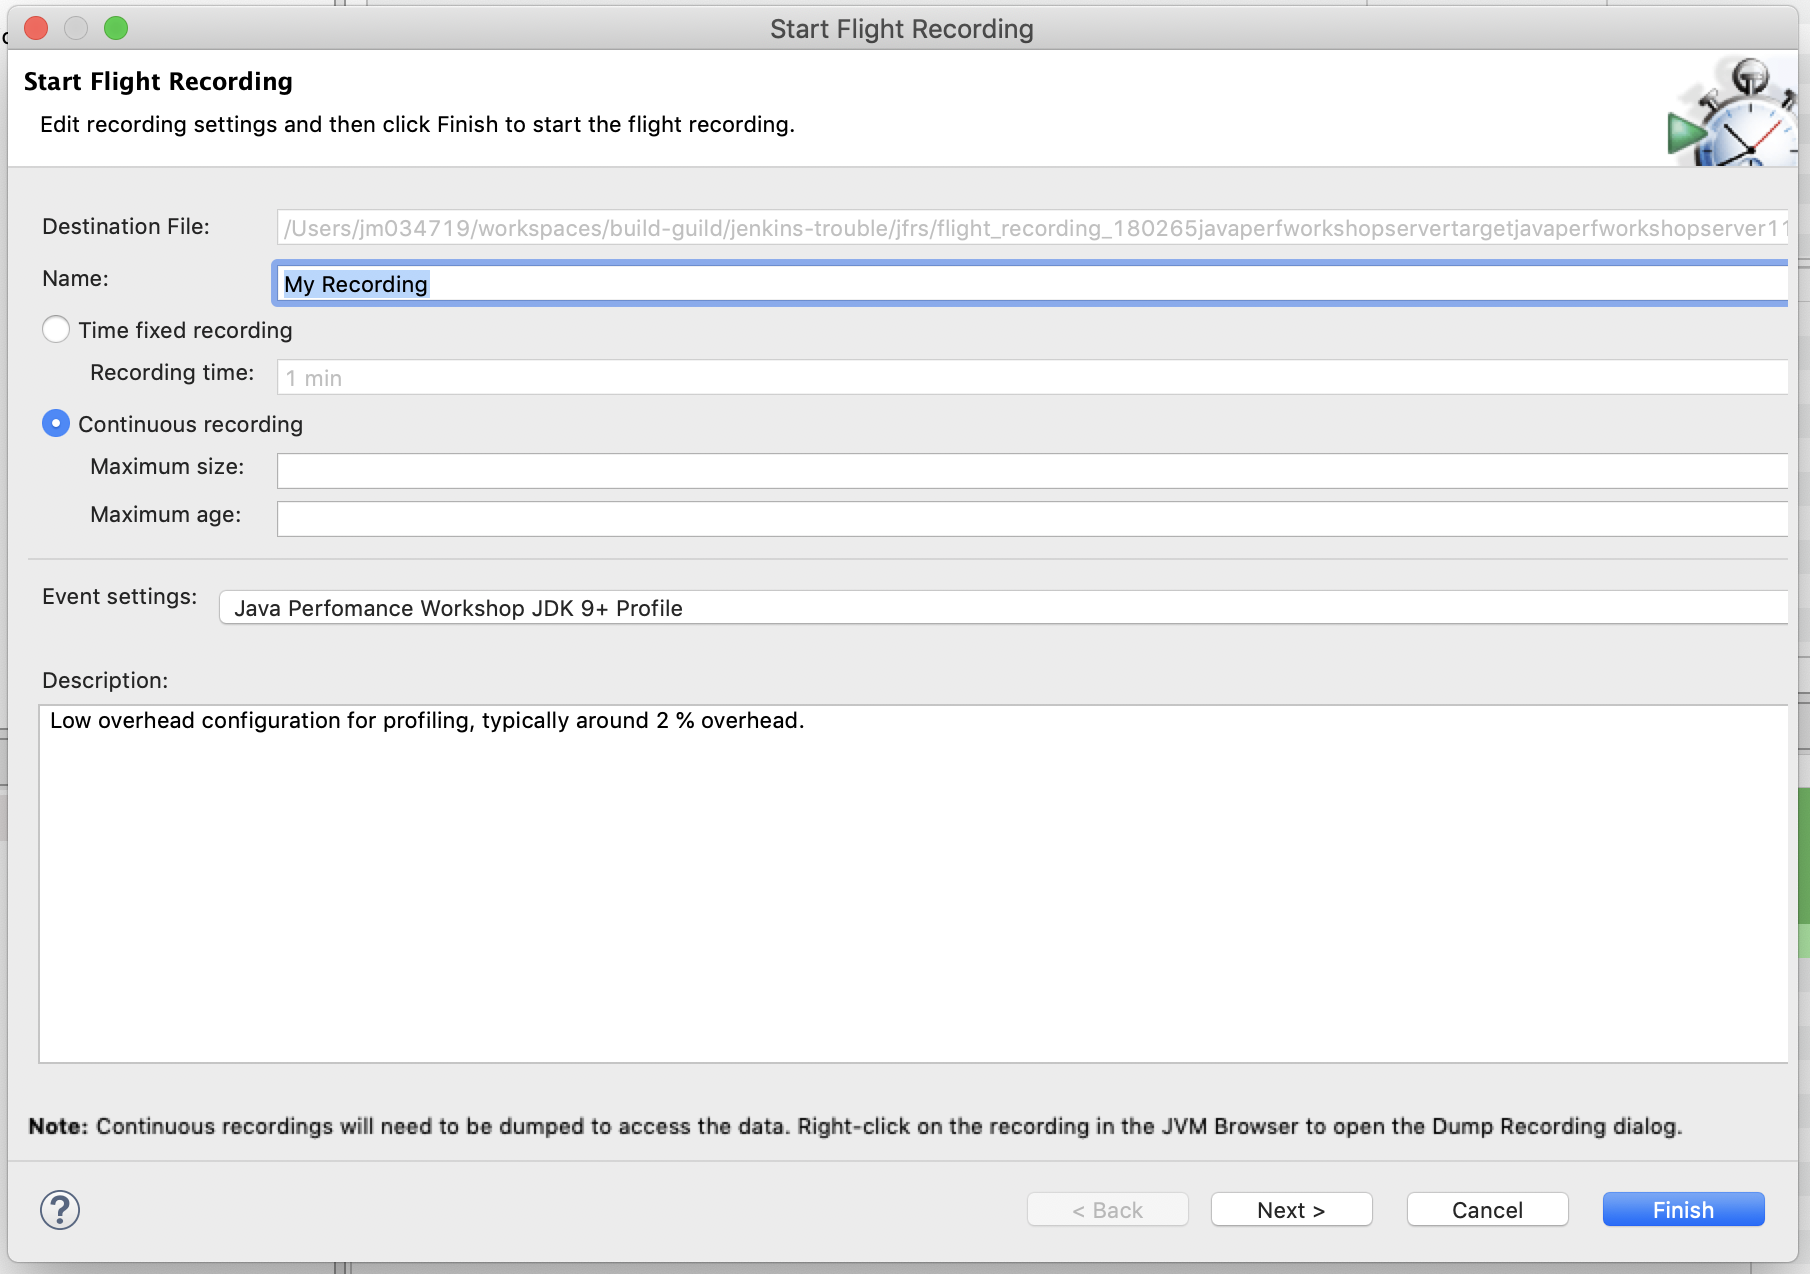
This will open a window where you apply some settings for the recording. First select that you want this to be a Continuous recording and for Event settings, we will import a template to get some consistent settings for profiling. Within the Template Manager, select Import Files… and import the open_jdk_9_.jfc included in the content/docs/jmc folder. It should appear as Java Performance Workshop JDK9+ Profile. Select this as the Event Settings and then click on Finish.
For reference, these are the options for the template.

First select that you want this to be a Continuous recording and for Event settings we will use Profiling on Server.
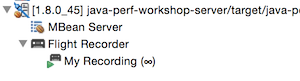
Once your flight recording is being captured in a Continuous recording, it will show a ∞.
💡 You can see the JFR templates (continuous / profile) which are shipped as part of the JRE in: $JAVA_HOME/jre/lib/jfr. These become helpful if you are wanting to compare your settings to some of the standard ones.
Generate HTTP traffic on service
We will want to generate some traffic on the service to measure some general characteristics of the service:
- Throughput (requests per second)
- Response time
- Trend of response time over time
By generating traffic on service, this gives us baseline activity in the JVM to start evaluating the flight recording.
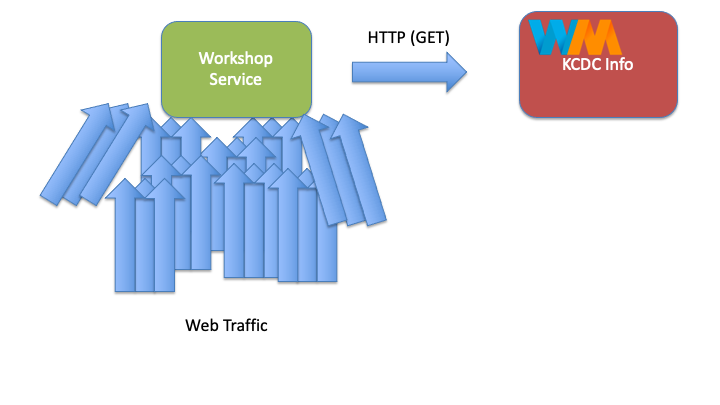
Basic test
This service under test, is a simple web service which provides results based on a search API. When interacting with the service, you can simply supply a HTTP GET on the search resource with a query parameter (‘q’) with the term that you are searching for. It will then return KCDC’s 2015 sessions that contain that term. Example:
curl "http://localhost:8080/search?q=jvm"
{
  "results" : [ {
    "title" : "Concurrency Options on the JVM",
    "presenter" : "Jessica Kerr",
    "sessionType" : "Regular Session"
  }, {
    "title" : "Exploring the Actor Model with Akka.NET",
    "presenter" : "Robert Macdonald Smith",
    "sessionType" : "Regular Session"
  }, {
    "title" : "What's in your JVM?",
    "presenter" : "Carl Chesser",
    "sessionType" : "4-Hour Workshop"
  } ]
}
Using Apache Benchmark
We can utilize Apache Benchmark to generate traffic on the service From the console, we will execute the following to generate traffic against our service. Note, we will use a very basic search of just “a”, since this will generate more results.
ab -n 1000 -c 15 "http://localhost:8080/search?q=a"
Using loadtest
An alternative to Apache Benchmark, is loadtest (a node.js equivalent). To install:
sudo npm install -g loadtest
Then you can execute similarly:
loadtest -n 1000 -c 15 "http://localhost:8080/search?q=a"
Using gatling
Alternatively, you can use gatling (a performance library with a scala dsl ).
This should launch the WorkshopSimulation.
mvn -f java-perf-workshop-tester/ gatling:test
Sample output while running:
[~/java-perf-workshop/java-perf-workshop-tester]$ mvn gatling:test
[INFO] Scanning for projects...
[INFO]
[INFO] ------------------------------------------------------------------------
[INFO] Building java-perf-workshop-tester 1.1.0-SNAPSHOT
[INFO] ------------------------------------------------------------------------
[INFO]
[INFO] --- gatling-maven-plugin:2.2.4:test (default-cli) @ java-perf-workshop-tester ---
19:12:16,662 |-INFO in ch.qos.logback.classic.LoggerContext[default] - Could NOT find resource [logback-test.xml]
19:12:16,663 |-INFO in ch.qos.logback.classic.LoggerContext[default] - Could NOT find resource [logback.groovy]
19:12:16,663 |-INFO in ch.qos.logback.classic.LoggerContext[default] - Found resource [logback.xml] at [file:/J:/Workspaces/java-perf-workshop/java-perf-workshop-tester/target/test-classes/logback.xml]
19:12:16,663 |-WARN in ch.qos.logback.classic.LoggerContext[default] - Resource [logback.xml] occurs multiple times on the classpath.
19:12:16,663 |-WARN in ch.qos.logback.classic.LoggerContext[default] - Resource [logback.xml] occurs at [file:/J:/Workspaces/java-perf-workshop/java-perf-workshop-tester/target/test-classes/logback.xml]
19:12:16,663 |-WARN in ch.qos.logback.classic.LoggerContext[default] - Resource [logback.xml] occurs at [jar:file:/C:/Users/JMonterrubio/.m2/repository/io/gatling/gatling-maven-plugin/2.2.4/gatling-maven-plugin-2.2.4.jar!/logback.xml]
19:12:16,727 |-INFO in ch.qos.logback.classic.joran.action.ConfigurationAction - debug attribute not set
19:12:16,731 |-INFO in ch.qos.logback.core.joran.action.AppenderAction - About to instantiate appender of type [ch.qos.logback.core.ConsoleAppender]
19:12:16,737 |-INFO in ch.qos.logback.core.joran.action.AppenderAction - Naming appender as [CONSOLE]
19:12:16,742 |-INFO in ch.qos.logback.core.joran.action.NestedComplexPropertyIA - Assuming default type [ch.qos.logback.classic.encoder.PatternLayoutEncoder] for [encoder] property
19:12:16,781 |-INFO in ch.qos.logback.classic.joran.action.RootLoggerAction - Setting level of ROOT logger to WARN
19:12:16,782 |-INFO in ch.qos.logback.core.joran.action.AppenderRefAction - Attaching appender named [CONSOLE] to Logger[ROOT]
19:12:16,782 |-INFO in ch.qos.logback.classic.joran.action.ConfigurationAction - End of configuration.
19:12:16,783 |-INFO in ch.qos.logback.classic.joran.JoranConfigurator@7a0ac6e3 - Registering current configuration as safe fallback point

Simulation cchesser.javaperf.workshop.WorkshopSimulation started...
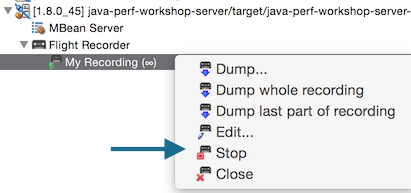
Stop Flight Recorder
After you have played traffic through the service, you can then stop your flight recording from JMC.
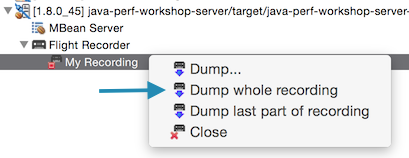
Then dump the whole recording.
The Flight Recording
From a Java Flight Recording, there are several categories of information (pages) you can view from JMC:
- Code Information:
- Method Profiling: Provides information about specific method runs and how long each run took, identifying hot spots in your code base.
- Exceptions: Displays Exceptions and Errors thrown and which methods threw them. Viewing exceptions requires editing the settings to also capture Exceptions.
- Thread information:
- Threads: Provides a snapshot of all the threads that belong to the Java Application and the thread activity.
- Lock Instances: Provides further details on threads by specifying lock information, showing which threads request and which threads take a particular lock.
- Thread Dump: Provides period thread dump information.
- Memory Information:
- Memory: Represents heap memory usage of the JVM.
- IO Information:
- File I/O: Displays File costs and behaviors
- Socket I/O: Displays Network costs and behaviors
- JVM Internals:
- Garbage Collections: Displays heap usage compared to pause times as well as GC events.
- Compilations: Provides details on code compilation.
- TLAB Allocations: Displays Thread Local Allocation Buffers.
- System Information:
- Processes: See other processes on the system and what is competing for resources.
- Environment: Provides information about the environment in which the recording was made.
- System Properties: Show properties passed on to the JVM.
- Events: Event Browser: View detailed log of the events within the JVM. You can use this page to further filter down on events across all the pages in the recording.
Note
Feel free to reference the additional resources as you navigate through the sections.In the next section, we'll find out more about what our methods are doing.
Method Profiling