Capturing Heap Dumps
You may be aware by now, there are many different ways of getting data from the JVM. Here are just a few ways to get heap dump of the JVM.
jcmd
With jcmd, you have the ability to invoke the GC.heap_dump command. This requires that you
are running as the same OS user as the target JVM process.
jcmd <PID> GC.heap_dump my_little_heap_dump.hprof
Note: If a full path is not specified, the heap_dump will be created relative to the location from where the process was started (when generated with jcmd)
jmap
A more traditional approach is using jmap and invoking the command on the target process.
jmap -dump:format=b,file=my_little_heap_dump.hprof <PID>
Core Dump
You can also use jmap to extract a heap dump from a core dump on the process:
sudo gdb --pid=<PID>
gcore /tmp/jvm.core
detach
quit
jmap -dump:format=b,file=my_little_heap_dump.hprof /usr/bin/java /tmp/jvm.core
💡 Capturing a heap dump from a core dump on Java 8, you may run into this issue: JDK-8073606.
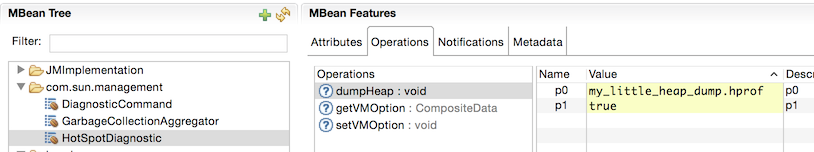
HotSpot Diagnostic MBean
You can capture a heap dump by invoking a diagnostic MBean which is included in the Oracle JDK. You can do so by opening your favorite MBean browser (ex. jconsole, jmc) and invoke
the com.sun.management.HotSpotDiagnostic. The arguments are:
- Filename of the heap dump that will be created. 💡 Note, it will be created with file ownership of the hosting JVM process.
- Indicator to dump all live object (true will dump only live objects)
In the next section, we'll start analyzing our heap dump with JOverflow.
JOverflow