This is the multi-page printable view of this section. Click here to print.
Workshop
- 1: Prerequisites
- 2: Setup
- 3: Process and Threads
- 4: JDK Mission Control & Flight Recorder
- 4.1: Introduction
- 4.2: Method Profiling
- 4.3: Exceptions
- 4.4: Threads
- 4.5: Memory
- 4.6: I/O Operations
- 4.7: References
- 5: Memory Analysis
- 5.1: Memory Heap Analysis
- 5.2: Capturing Heap Dumps
- 5.3: JOverflow
- 5.4: Eclipse MAT
- 5.5: VisualVM
- 5.6: Memory Challenge
- 5.7: Garbage Collections
- 6: Containers
- 6.1: Setup
- 6.2: Java Monitoring Tooling
- 6.3: Docker Tooling
- 6.4: References
1 - Prerequisites
Java Development Kit
Install a Java Development Kit (17+) from Oracle or OpenJDK
Maven
Install the latest available Maven.
JDK Mission Control
Install JDK Mission Control from Oracle Mirror.
VisualVM
Install the standalone version of VisualVM.
Eclipse MAT
Install the standalone version of Eclipse MAT.
Rancher Desktop + Docker CLI
Install the Rancher Desktop container runtime environment with the Docker CLI.
2 - Setup
In this section we’re going to spin up the services needed for the workshop.
Note
Make sure you’ve gone through the PrerequisitesService
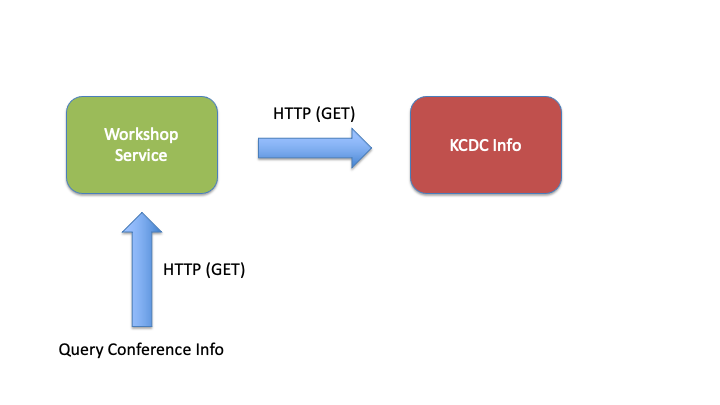
The web service is a simple dropwizard server, which has a single API to search for talks from kcdc.info, and returns results about these talks.
Running
Prerequisites:
- Maven
- Java JDK
Assemble the service:
mvn clean package
💡 If you have issues with building it locally due to your setup, you can download the server assembly here.
Start the workshop service:
java -jar java-perf-workshop-server/target/java-perf-workshop-server-1.1.0-SNAPSHOT.jar server server.yml
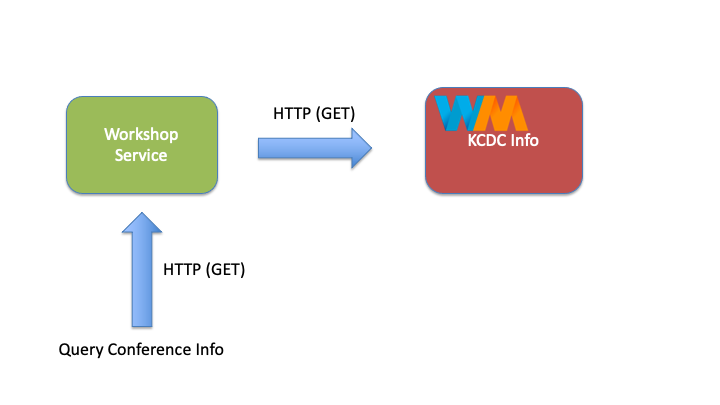
Mocking Service Dependency
To simulate responses of kcdc.info (as the service may change over time), we will first run a mock instance of this service using WireMock.
Go ahead and start another terminal session where we will run another service to mock a remote dependency of the workshop service. Navigate to the same directory where you cloned this repository, then execute the following commands:
mvn dependency:copy -Dartifact=com.github.tomakehurst:wiremock-standalone:2.27.2 -Dmdep.stripVersion=true -DoutputDirectory=.
Run the mock service, which will provide the essential end-points to support the service we will be testing:
java -jar wiremock-standalone.jar --port 9090 --root-dir java-perf-workshop-server/src/test/resources
Alternatively, you can run the mockservice.sh script which will do both commands, ie: sh mockservice.sh
Configuration
Example configuration of service:
server:
  applicationConnectors:
    - type: http
      port: 80
  adminConnectors:
    - type: http
      port: 8071
  requestLog:
    timeZone: UTC
    appenders:
      - type: file
        currentLogFilename: /var/log/java-perf-workshop-server-access.log
        threshold: ALL
        archive: true
        archivedLogFilenamePattern: /var/log/java-perf-workshop-server-access.%d.log.gz
        archivedFileCount: 5
logging:
  level: INFO
  appenders:
    - type: file
      currentLogFilename: /var/log/java-perf-workshop-server.log
      threshold: ALL
      archive: true
      archivedLogFilenamePattern: /var/log/java-perf-workshop-server-%d.log
      archivedFileCount: 5
      timeZone: UTC
Testing
The service will return back results from the KCDC website on sessions that are available which contain a substring in their title, abstract, or tags. Example:
http://localhost:8080/search?q=clojure
Example results:
{
  "results" : [ {
    "title" : "Concurrency Options on the JVM",
    "presenter" : "Jessica Kerr"
  }, {
    "title" : "Fast, Parallel, or Reliable: Pick 3, a tour of Elixir",
    "presenter" : "Jordan Day"
  } ]
}
Troubleshooting
If you get a 500 error message when trying to test the service, verify that the wiremock server is running.
{
  "code" : 500,
  "message" : "There was an error processing your request. It has been logged (ID d8998189f8d4ee8c)."
}
Reference
3 - Process and Threads
This first part of the workshop, we will begin to learn about looking at the JVM from its native perspective, and begin obtaining JVM based information to correlate to it’s native representation.
top
A very common utility as to monitor processes in Linux. For our case, we will want to monitor our JVM process. When just executing top, you will see all processes on the host:
top - 05:32:51 up 8 min,  1 user,  load average: 0.05, 0.12, 0.06
Tasks:  62 total,   1 running,  61 sleeping,   0 stopped,   0 zombie
Cpu(s): 11.2%us,  0.7%sy,  0.0%ni, 87.8%id,  0.0%wa,  0.0%hi,  0.0%si,  0.3%st
Mem:   1020184k total,   466284k used,   553900k free,    17740k buffers
Swap:        0k total,        0k used,        0k free,   289500k cached

  PID USER      PR  NI  VIRT  RES  SHR S %CPU %MEM    TIME+  COMMAND
 6730 ec2-user  20   0 2246m 108m  13m S 10.3 10.9   0:14.11 java
    1 root      20   0 19596 1616 1292 S  0.0  0.2   0:00.56 init
    2 root      20   0     0    0    0 S  0.0  0.0   0:00.00 kthreadd
    3 root      20   0     0    0    0 S  0.0  0.0   0:00.02 ksoftirqd/0
    4 root      20   0     0    0    0 S  0.0  0.0   0:00.00 kworker/0:0
    5 root       0 -20     0    0    0 S  0.0  0.0   0:00.00 kworker/0:0H
    6 root      20   0     0    0    0 S  0.0  0.0   0:00.04 kworker/u30:0
    7 root      20   0     0    0    0 S  0.0  0.0   0:00.27 rcu_sched
    8 root      20   0     0    0    0 S  0.0  0.0   0:00.00 rcu_bh
    9 root      RT   0     0    0    0 S  0.0  0.0   0:00.00 migration/0
You can switch in this view to also view the native threads, by hitting Shift+H.
top - 05:34:15 up 9 min,  1 user,  load average: 0.01, 0.09, 0.05
Tasks: 101 total,   1 running, 100 sleeping,   0 stopped,   0 zombie
Cpu(s):  4.0%us,  0.3%sy,  0.0%ni, 95.7%id,  0.0%wa,  0.0%hi,  0.0%si,  0.0%st
Mem:   1020184k total,   491176k used,   529008k free,    17804k buffers
Swap:        0k total,        0k used,        0k free,   312648k cached
 Show threads On
  PID USER      PR  NI  VIRT  RES  SHR S %CPU %MEM    TIME+  COMMAND
 6736 ec2-user  20   0 2246m 109m  13m S  2.0 11.0   0:05.72 java
 6737 ec2-user  20   0 2246m 109m  13m S  0.3 11.0   0:01.69 java
 6740 ec2-user  20   0 2246m 109m  13m S  0.3 11.0   0:01.67 java
 6746 ec2-user  20   0 2246m 109m  13m S  0.3 11.0   0:00.31 java
 6768 ec2-user  20   0 2246m 109m  13m S  0.3 11.0   0:00.03 java
 6778 ec2-user  20   0 2246m 109m  13m S  0.3 11.0   0:00.08 java
 6777 ec2-user  20   0 15224 1332 1032 R  0.3  0.1   0:00.04 top
    1 root      20   0 19596 1616 1292 S  0.0  0.2   0:00.56 init
    2 root      20   0     0    0    0 S  0.0  0.0   0:00.00 kthreadd
    3 root      20   0     0    0    0 S  0.0  0.0   0:00.02 ksoftirqd/0
    4 root      20   0     0    0    0 S  0.0  0.0   0:00.00 kworker/0:0
With these native threads, you can now get better context of what resources are being utilized. To simplify this, you can target top to just watch one parent process and then show threads via:
top -H -p <PID>
In our earlier example, our PID was 6730. Therefore, this would produce:
$ top -H -p 6730
top - 05:38:05 up 13 min,  1 user,  load average: 0.00, 0.05, 0.05
Tasks:  32 total,   0 running,  32 sleeping,   0 stopped,   0 zombie
Cpu(s):  0.0%us,  0.0%sy,  0.0%ni,100.0%id,  0.0%wa,  0.0%hi,  0.0%si,  0.0%st
Mem:   1020184k total,   515940k used,   504244k free,    17932k buffers
Swap:        0k total,        0k used,        0k free,   336520k cached

  PID USER      PR  NI  VIRT  RES  SHR S %CPU %MEM    TIME+  COMMAND
 6739 ec2-user  20   0 2246m 110m  13m S  0.3 11.1   0:00.24 java
 6730 ec2-user  20   0 2246m 110m  13m S  0.0 11.1   0:00.00 java
 6731 ec2-user  20   0 2246m 110m  13m S  0.0 11.1   0:01.50 java
 6732 ec2-user  20   0 2246m 110m  13m S  0.0 11.1   0:01.07 java
 6733 ec2-user  20   0 2246m 110m  13m S  0.0 11.1   0:00.00 java
 6734 ec2-user  20   0 2246m 110m  13m S  0.0 11.1   0:00.00 java
 6735 ec2-user  20   0 2246m 110m  13m S  0.0 11.1   0:00.00 java
 6736 ec2-user  20   0 2246m 110m  13m S  0.0 11.1   0:07.33 java
 6737 ec2-user  20   0 2246m 110m  13m S  0.0 11.1   0:01.69 java
 6738 ec2-user  20   0 2246m 110m  13m S  0.0 11.1   0:00.00 java
To make a simple standard capture of native threads for diagnostic purposes, you can do the following:
top -b -n3 -H -p <PID>
This will capture thread iterations of top by capturing threads of the parent process ID. You can then pipe it to a file.
Example:
top -b -n3 -H -p 6730 > jvm_native_threads.log
Java Utilities
There’s a couple of java utilities that can also be used to find the PIDs of your running processes.
jps
The Java Virtual Machine Process Status Tool can be used to see Java processes.
 $ jps
7241 Jps
6059 java-perf-workshop-server-1.1.0-SNAPSHOT.jar
6925 jar
You can get more insight by using some of its flags:
 $ jps -lvm
6059 java-perf-workshop-server/target/java-perf-workshop-server-1.1.0-SNAPSHOT.jar server server.yml
6925 wiremock-standalone.jar --port 9090 --root-dir java-perf-workshop-server/src/test/resources
7582 sun.tools.jps.Jps -lvm -Dapplication.home=/Library/Java/JavaVirtualMachines/adoptopenjdk-8.jdk/Contents/Home -Xms8m
jcmd
The jcmd utility is an attempt to consolidate other utilities into a single interface.
Running the jcmd command should display some of the same information that jps showed us (similar to jps -m):
$ jcmd
6059 java-perf-workshop-server/target/java-perf-workshop-server-1.1.0-SNAPSHOT.jar server server.yml
6925 wiremock-standalone.jar --port 9090 --root-dir java-perf-workshop-server/src/test/resources
7838 sun.tools.jcmd.JCmd
Thread Dump
To capture a thread dump of the JVM, there are many tools that can achieve this. You can do this over JMX remotely, sending an OS signal (kill -3), or just form the command line (jstack or jcmd). To keep it simple, we will just use jcmd as we will use it later for other diagnostic commands.
jcmd <PID> Thread.print
💡 You need to be the same OS user when invoking the command as the target JVM.
So, using our earlier example, this would be:
jcmd 6730 Thread.print
However, correlating a thread dump to the native thread state requires a minor translation. In your thread dump, the native thread identifier is in hexadecimal, while the native thread identifiers from top are in decimal. Therefore, if you notice a thread spiking in the top view, you would then want to understand what cod it is correlating to. You can do this simply from the command line via:
printf "%x\n" <Decimal Thread ID>
Example:
$ printf "%x\n" 6736
1a50
$
I can then cross reference this thread to my thread dump via the nid (native thread ID) field:
"C2 CompilerThread0" #5 daemon prio=9 os_prio=0 tid=0x00007efda40d4000 nid=0x1a50 waiting on condition [0x0000000000000000]
   java.lang.Thread.State: RUNNABLE
An alternative tool fastthread.io also has a blog on other ways to capture a thread dump
jcmd PerfCounter
A very simple and quick collection of stats on a JVM can be collected via:
jcmd <PID> PerfCounter.print
Generally the information in this file may or may not indicate the actual problem, but can provide more context in a concise text file of what all has occurred in the life of that JVM. One simple set of counters related to threads are:
java.threads.daemon=20
java.threads.live=26
java.threads.livePeak=38
java.threads.started=697
strace
In some rare cases, you may need to figure out what system calls your JVM is doing. One way to do this on several flavors of Linux, is to use strace.
strace -f -v -p <PID>
Example:
strace -f -v -p 6730
Example output:
[pid  6741] futex(0x7efda4587228, FUTEX_WAKE_PRIVATE, 1 <unfinished ...>
[pid  6740] write(1, "DEBUG [2015-06-24 05:50:34,727] "..., 168 <unfinished ...>
[pid  6830] gettimeofday( <unfinished ...>
From the write call, we can see it is tied to the thread ID 6740. If we translate it to x1a54, which is then tied to this logging thread in the JVM.
"AsyncAppender-Worker-Thread-1" #9 daemon prio=5 os_prio=0 tid=0x00007efda44d1800 nid=0x1a54 waiting on condition [0x00007efd941f0000]
   java.lang.Thread.State: WAITING (parking)
	at sun.misc.Unsafe.park(Native Method)
	- parking to wait for  <0x00000000f5d38d20> (a java.util.concurrent.locks.AbstractQueuedSynchronizer$ConditionObject)
	at java.util.concurrent.locks.LockSupport.park(LockSupport.java:175)
	at java.util.concurrent.locks.AbstractQueuedSynchronizer$ConditionObject.await(AbstractQueuedSynchronizer.java:2039)
You will notice that the system calls are quite noisy with the JVM, but this type of troubleshooting can greatly help when the JVM is getting “hung” or hitting limits by the OS and it isn’t clear from the exception that you are seeing what it is getting restricted on.
4 - JDK Mission Control & Flight Recorder
In this workshop, we will be getting more familiar with using JDK Mission Control and the Flight Recorder. As we have been running our service, we want to gather more insight of the code in the service by running series of simple tests and measuring the service.
4.1 - Introduction
JDK Flight Recorder
The JDK Flight Recorder (JFR) is a very low overhead profiling and diagnostics tool. It was inherited from the JRockit JVM, and originally was offered as part of the HotSpot JVM. It is designed to be “black box” data recorder of the the run-time, which can be used in production environments, making it an attractive tool for profiling code since it has low overhead on the JVM. In 2018, it was open-sourced and released as part of OpenJDK.
JFR is enabled by default in Java 11 and later. In previous versions, it required enabling with JVM options (ex. -XX:+FlightRecorder)
Higher Fidelity on Method Profiling
To get better fidelity on method profiling, include the following options which will enable the compiler to include additional metadata on non-safe code points. This is helpful, as sometimes the metadata will not fully resolve to the correct line in the code.
-XX:+UnlockDiagnosticVMOptions -XX:+DebugNonSafepoints
JDK Mission Control
We will be using JDK Mission Control to monitor and evaluate the Java flight recordings. To utilizes JDK Mission Control, you will need to download the build. To start up JDK Mission Control, simply executing the following in your console:
jmc
💡 In order to be able to invoke jmc (JDK Mission Control) from your console, it assumes $JAVA_HOME/bin is on your $PATH. If it is not included, go ahead and update your profile to include this so you can easily invoke jmc from your terminal. Also, JMC 9.1 requires JDK 21.
Start Service with JFR
Let’s start profiling our service. Start the service up by enabling JFR:
Start from the console
# Note, if you are running this server from a different folder, consider changing the SERVER_HOME
SERVER_HOME=java-perf-workshop-server/target
java -XX:+UnlockDiagnosticVMOptions -XX:+DebugNonSafepoints -jar $SERVER_HOME/java-perf-workshop-server-1.1.0-SNAPSHOT.jar server server.yml
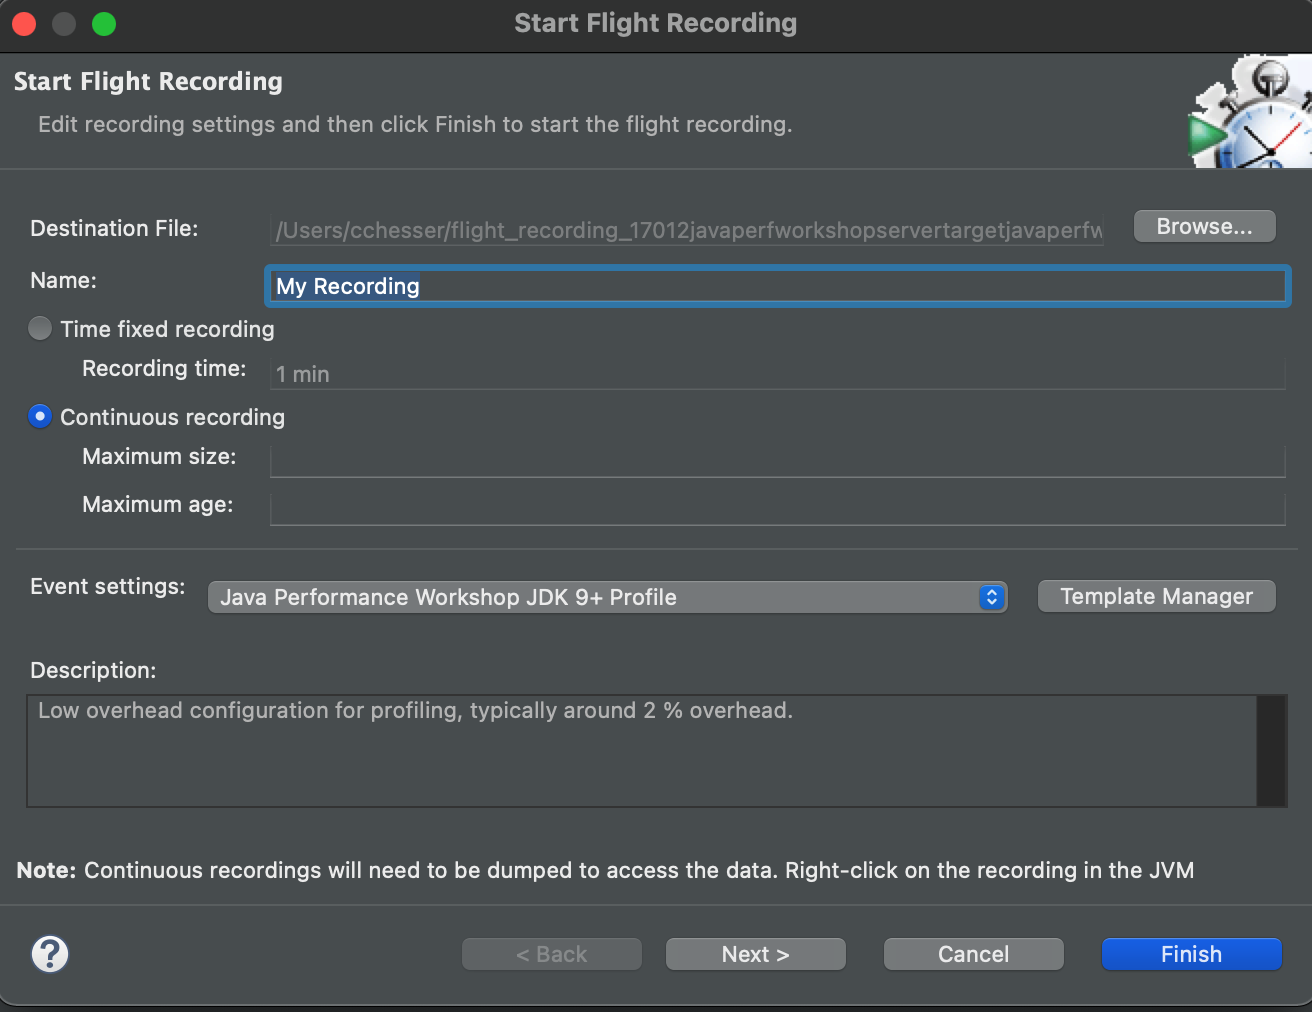
Start Flight Recording from JMC
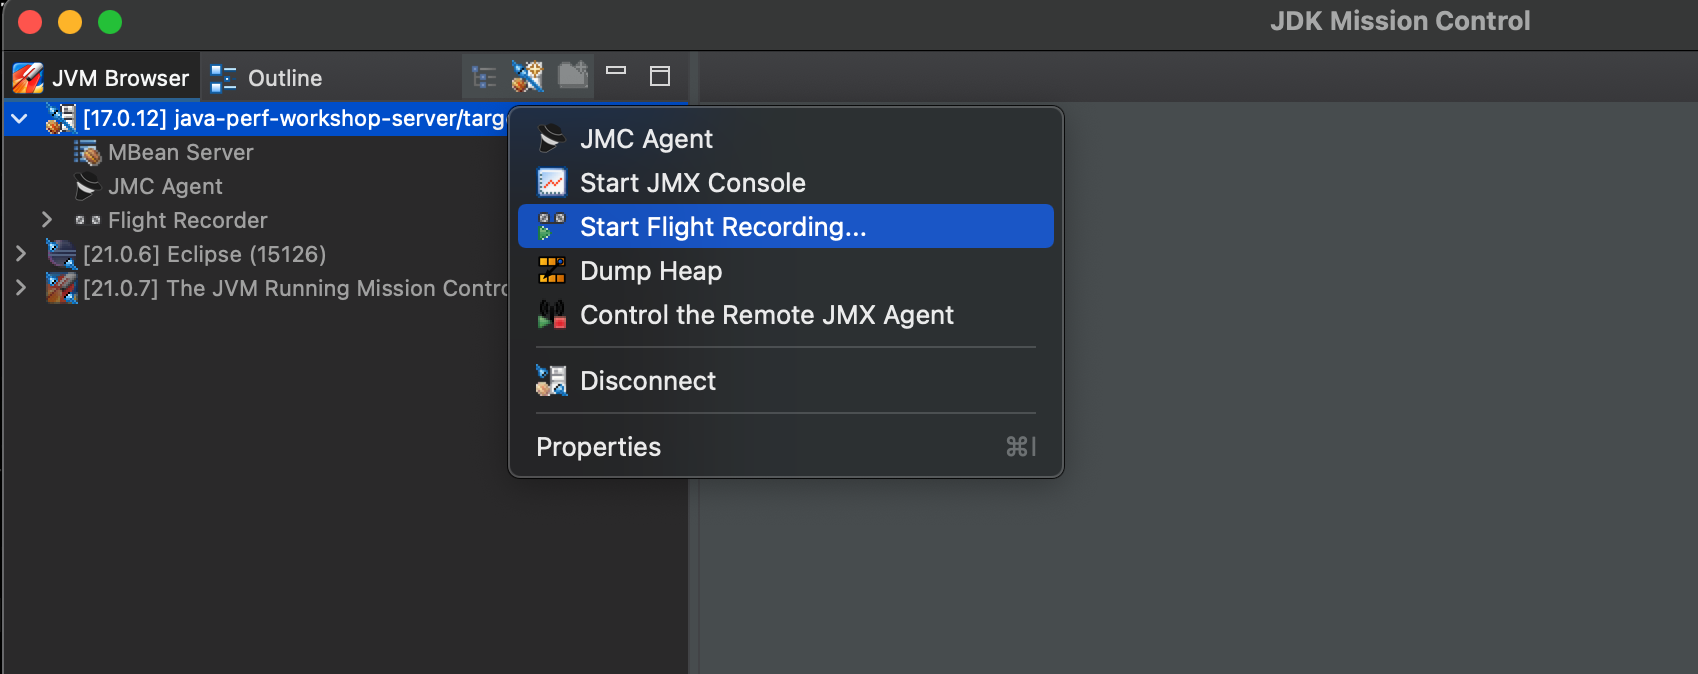
This will open a window where you apply some settings for the recording. First select that you want this to be a Continuous recording and for Event settings, we will import a template to get some consistent settings for profiling. Within the Template Manager, select Import Files… and import the open_jdk_9_.jfc by downloading it here folder. It should appear as Java Performance Workshop JDK9+ Profile. Select this as the Event Settings and then click on Finish.
For reference, these are the options for the template.
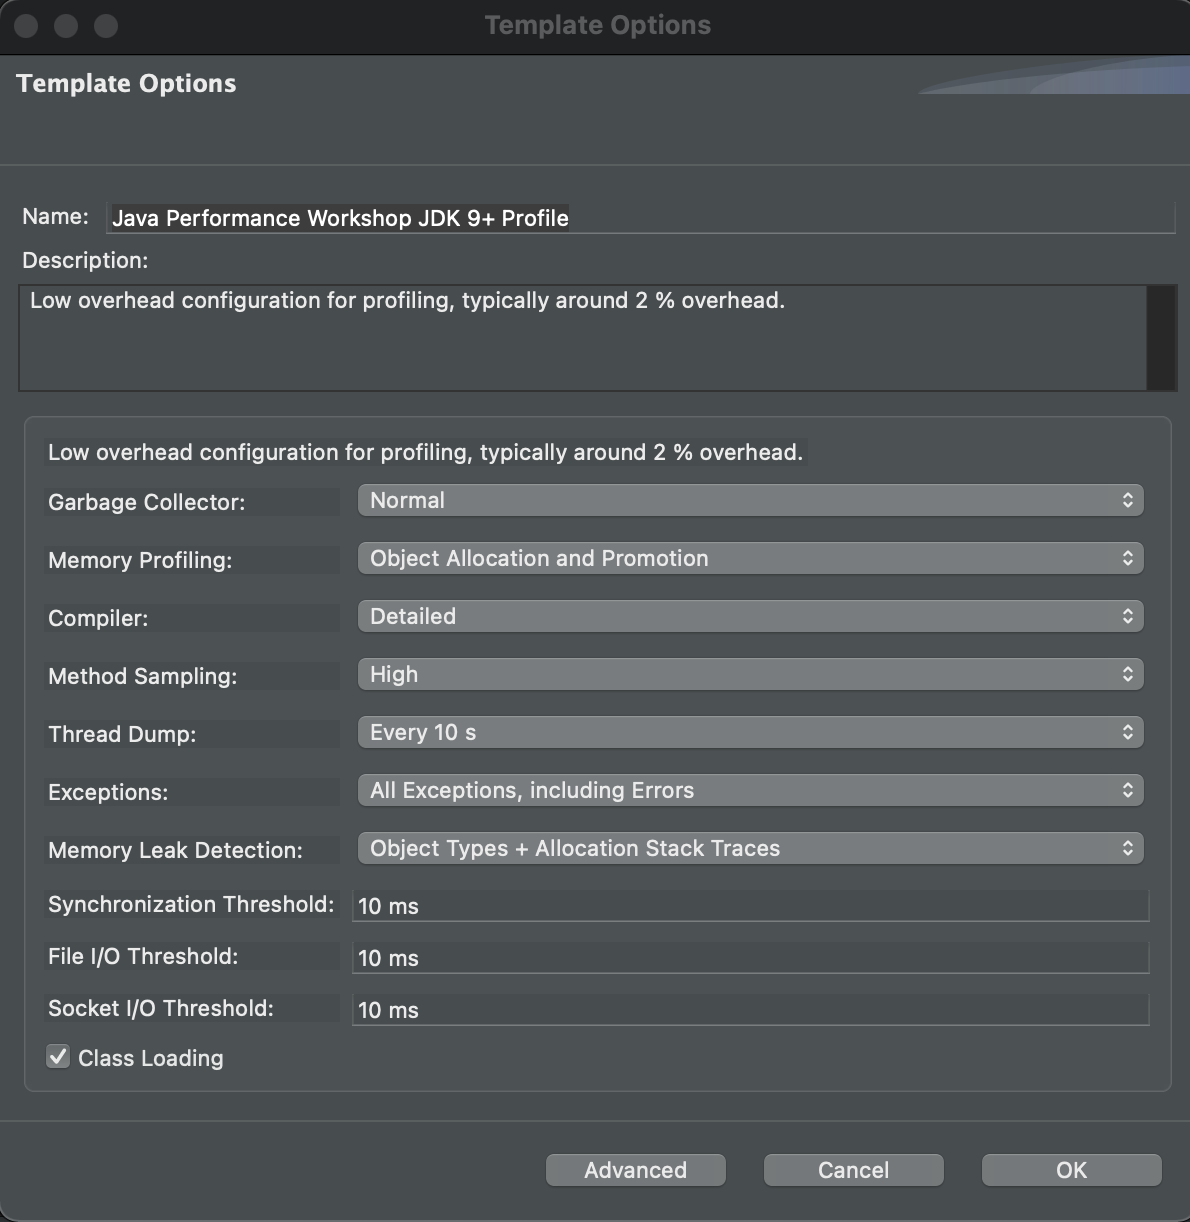
First select that you want this to be a Continuous recording and for Event settings we will use Profiling on Server.
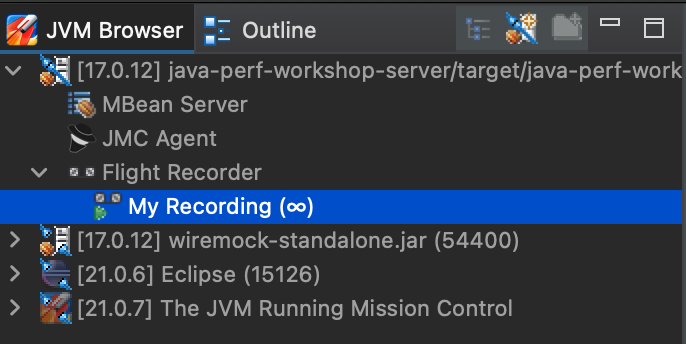
Once your flight recording is being captured in a Continuous recording, it will show a ∞.
💡 You can see the JFR templates (continuous / profile) which are shipped as part of the JRE in: $JAVA_HOME/jre/lib/jfr. These become helpful if you are wanting to compare your settings to some of the standard ones.
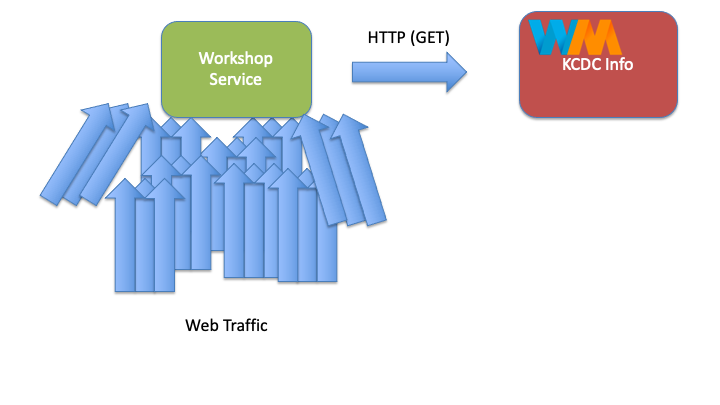
Generate HTTP traffic on service
We will want to generate some traffic on the service to measure some general characteristics of the service:
- Throughput (requests per second)
- Response time
- Trend of response time over time
By generating traffic on service, this gives us baseline activity in the JVM to start evaluating the flight recording.
Basic test
This service under test, is a simple web service which provides results based on a search API. When interacting with the service, you can simply supply a HTTP GET on the search resource with a query parameter (‘q’) with the term that you are searching for. It will then return KCDC’s 2015 sessions that contain that term. Example:
curl "http://localhost:8080/search?q=jvm"
{
  "results" : [ {
    "title" : "Concurrency Options on the JVM",
    "presenter" : "Jessica Kerr",
    "sessionType" : "Regular Session"
  }, {
    "title" : "Exploring the Actor Model with Akka.NET",
    "presenter" : "Robert Macdonald Smith",
    "sessionType" : "Regular Session"
  }, {
    "title" : "What's in your JVM?",
    "presenter" : "Carl Chesser",
    "sessionType" : "4-Hour Workshop"
  } ]
}
Using Apache Benchmark
We can utilize Apache Benchmark to generate traffic on the service From the console, we will execute the following to generate traffic against our service. Note, we will use a very basic search of just “a”, since this will generate more results.
ab -n 1000 -c 15 "http://localhost:8080/search?q=a"
Using loadtest
An alternative to Apache Benchmark, is loadtest (a node.js equivalent). To install:
sudo npm install -g loadtest
Then you can execute similarly:
loadtest -n 1000 -c 15 "http://localhost:8080/search?q=a"
Stop Flight Recorder
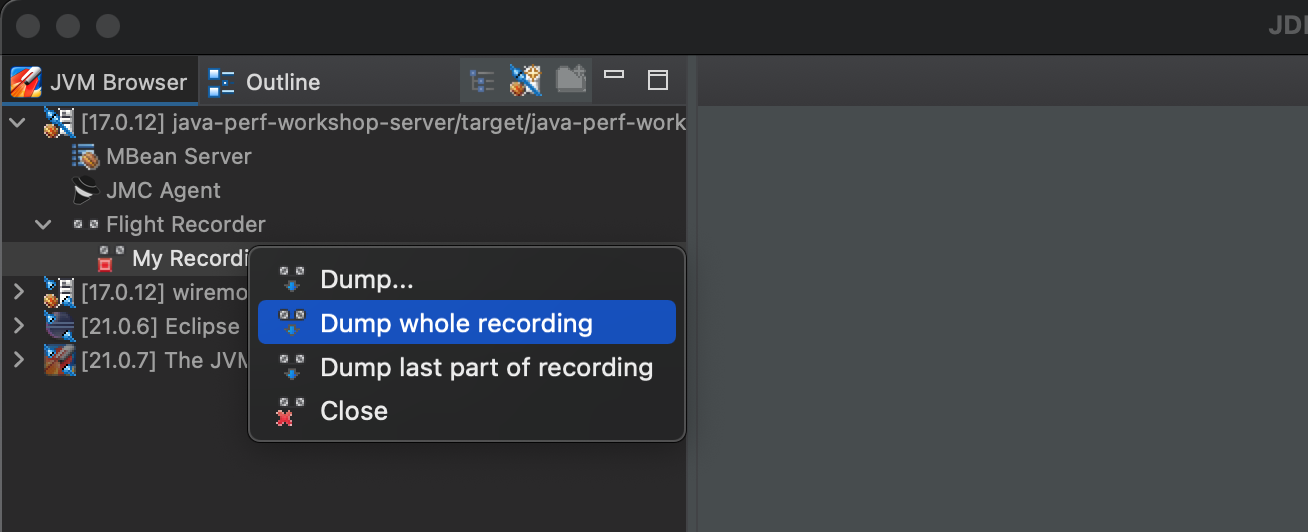
After you have played traffic through the service, you can then stop your flight recording from JMC.
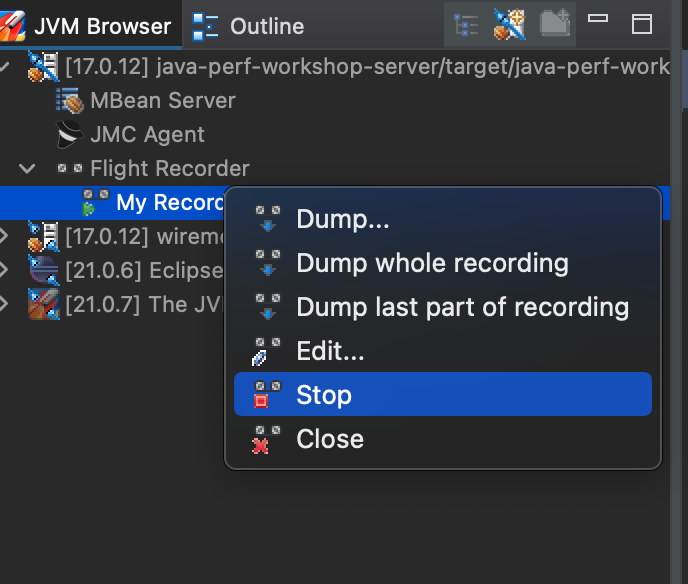
Then dump the whole recording.
The Flight Recording
From a Java Flight Recording, there are several categories of information (pages) you can view from JMC:
- Code Information:
- Method Profiling: Provides information about specific method runs and how long each run took, identifying hot spots in your code base.
- Exceptions: Displays Exceptions and Errors thrown and which methods threw them. Viewing exceptions requires editing the settings to also capture Exceptions.
- Thread information:
- Threads: Provides a snapshot of all the threads that belong to the Java Application and the thread activity.
- Lock Instances: Provides further details on threads by specifying lock information, showing which threads request and which threads take a particular lock.
- Thread Dump: Provides period thread dump information.
- Memory Information:
- Memory: Represents heap memory usage of the JVM.
- IO Information:
- File I/O: Displays File costs and behaviors
- Socket I/O: Displays Network costs and behaviors
- JVM Internals:
- Garbage Collections: Displays heap usage compared to pause times as well as GC events.
- Compilations: Provides details on code compilation.
- TLAB Allocations: Displays Thread Local Allocation Buffers.
- System Information:
- Processes: See other processes on the system and what is competing for resources.
- Environment: Provides information about the environment in which the recording was made.
- System Properties: Show properties passed on to the JVM.
- Events: Event Browser: View detailed log of the events within the JVM. You can use this page to further filter down on events across all the pages in the recording.
Note
Feel free to reference the additional resources as you navigate through the sections.In the next section, we'll find out more about what our methods are doing.
Method Profiling4.2 - Method Profiling
Our first look at the recording will start with finding out where we might be spending time with our code.
Method Profiling Page
We’ll start by taking a look at the detailed Method Profiling Page. This page displays how often a specific method is ran based on sampling.
Note
This page is a little bit difficult to use in JMC7, planned improvements for the data visualization will come in JMC8, see JMC#165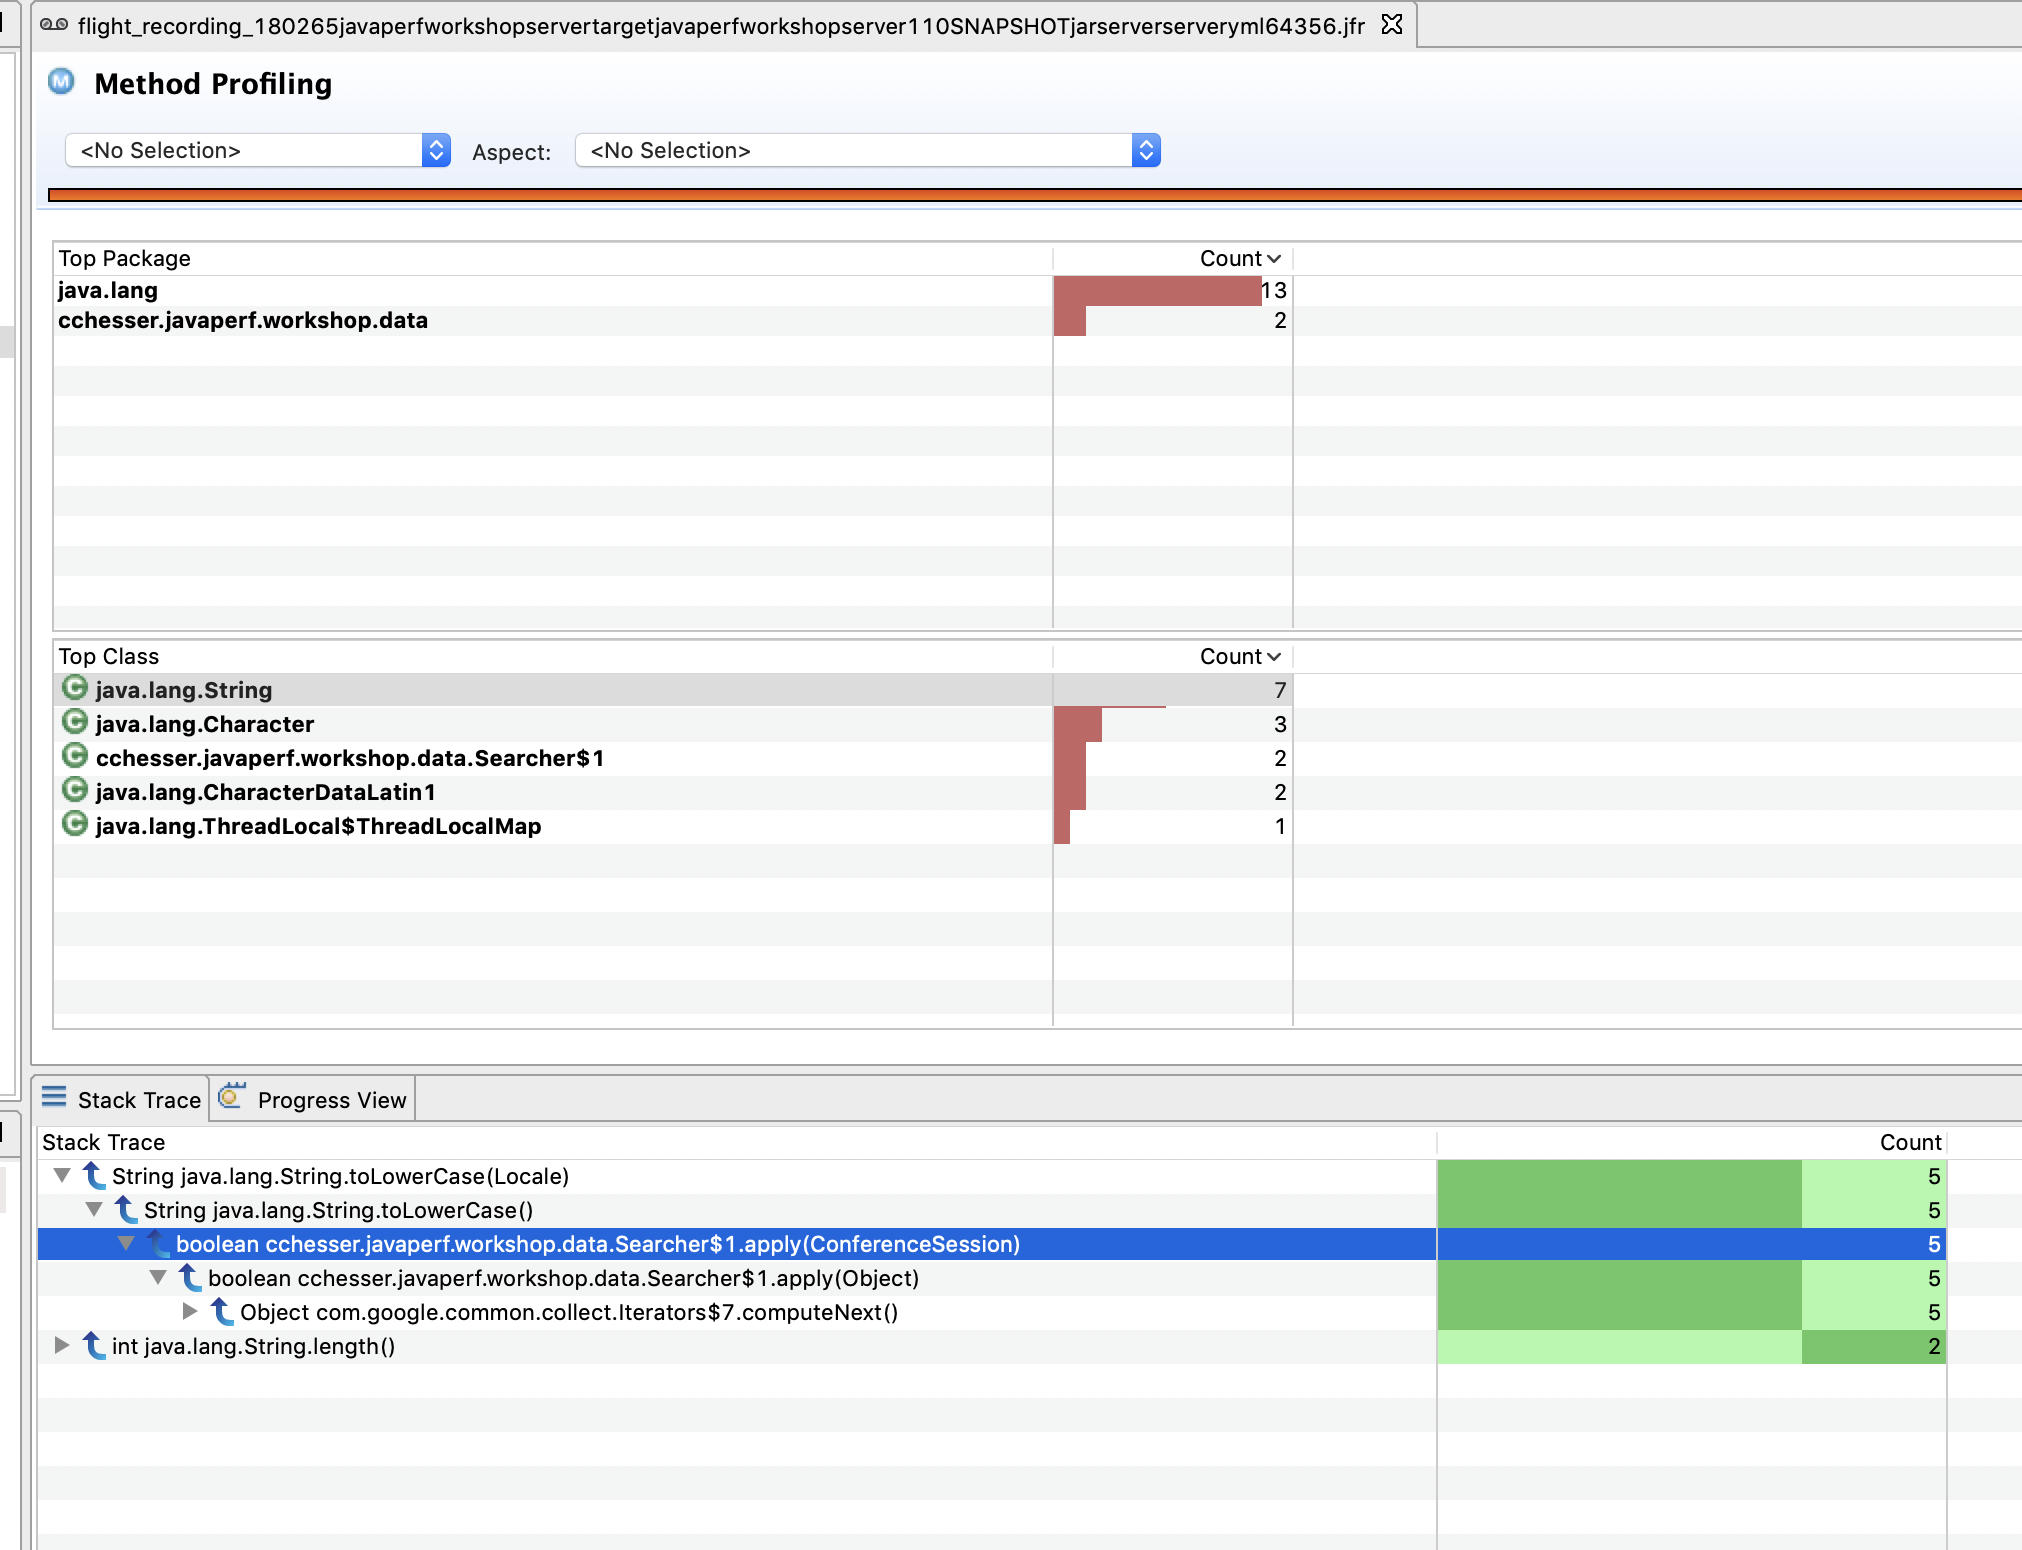
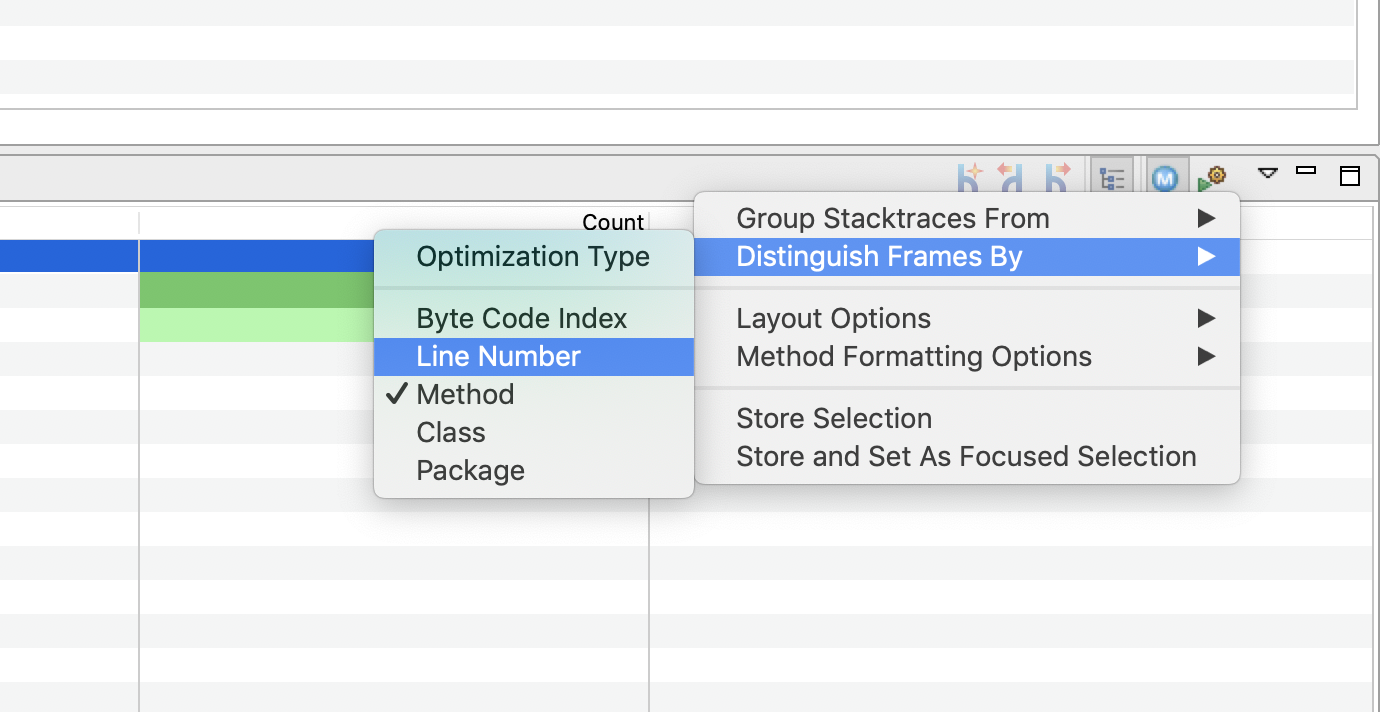
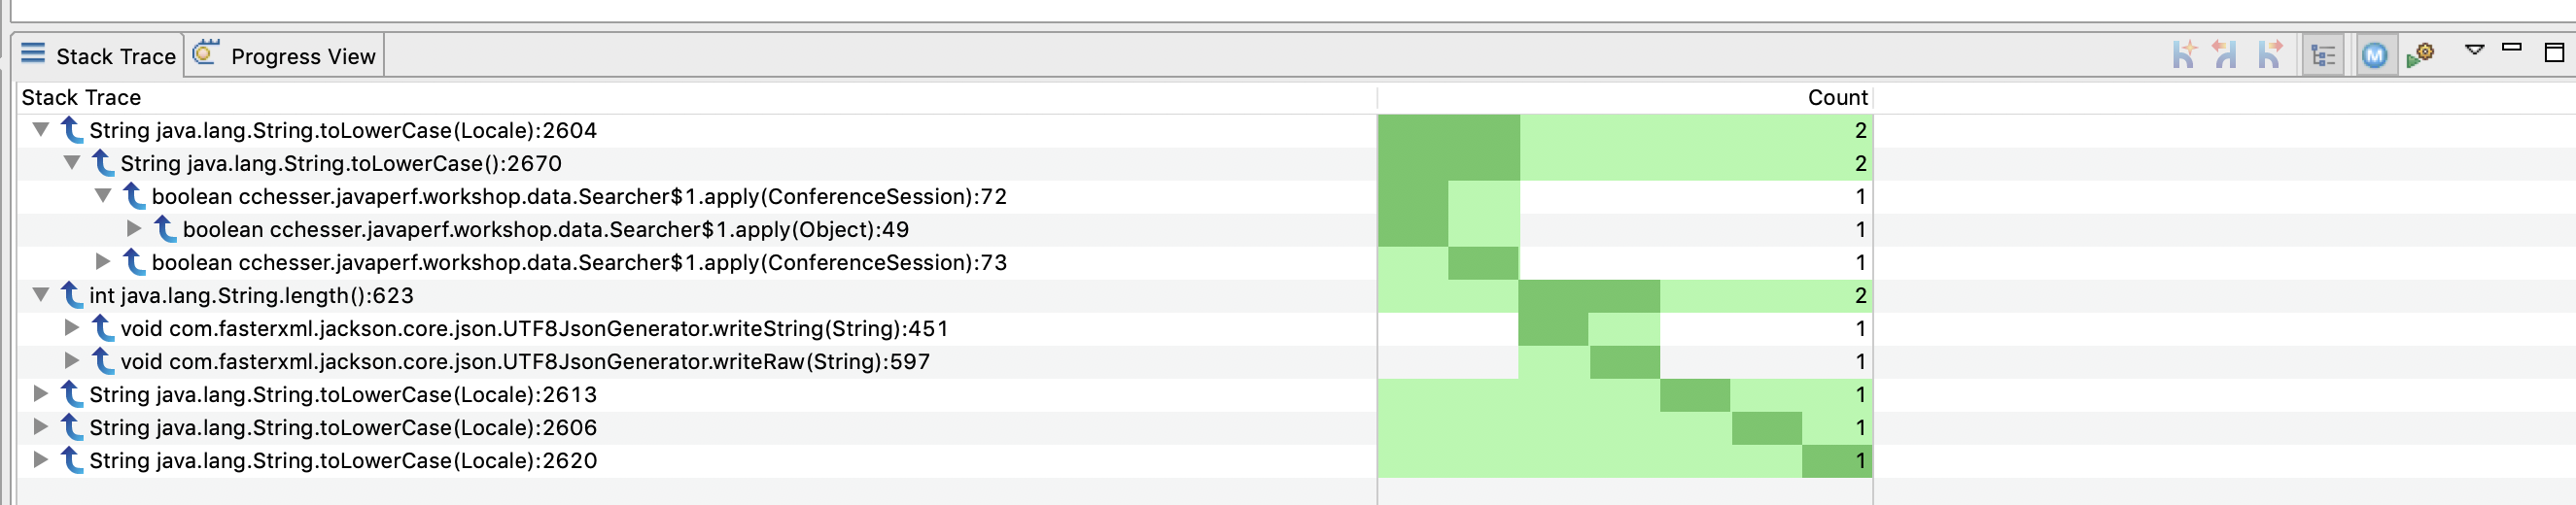
By default, this view groups threads by method, but you can also include the line number for each method. This can be accomplished by selecting the View Menu option and going to Distinguish Frames By and selecting Line Number.
💡 Generally, you don’t need this, as it can be quite apparent by the base method being invoked where the cost is at. Though, it may be helpful to include in some contexts.
Note
Remember that this is just a sampling view, and does not mean that only a small amount of methods were hit. We’ll be able to visualize more of this info in the following part.Java Application
Navigate to the Java Application page. This page provides an overview of the state of the JVM and collates information from a couple of the dedicated pages.
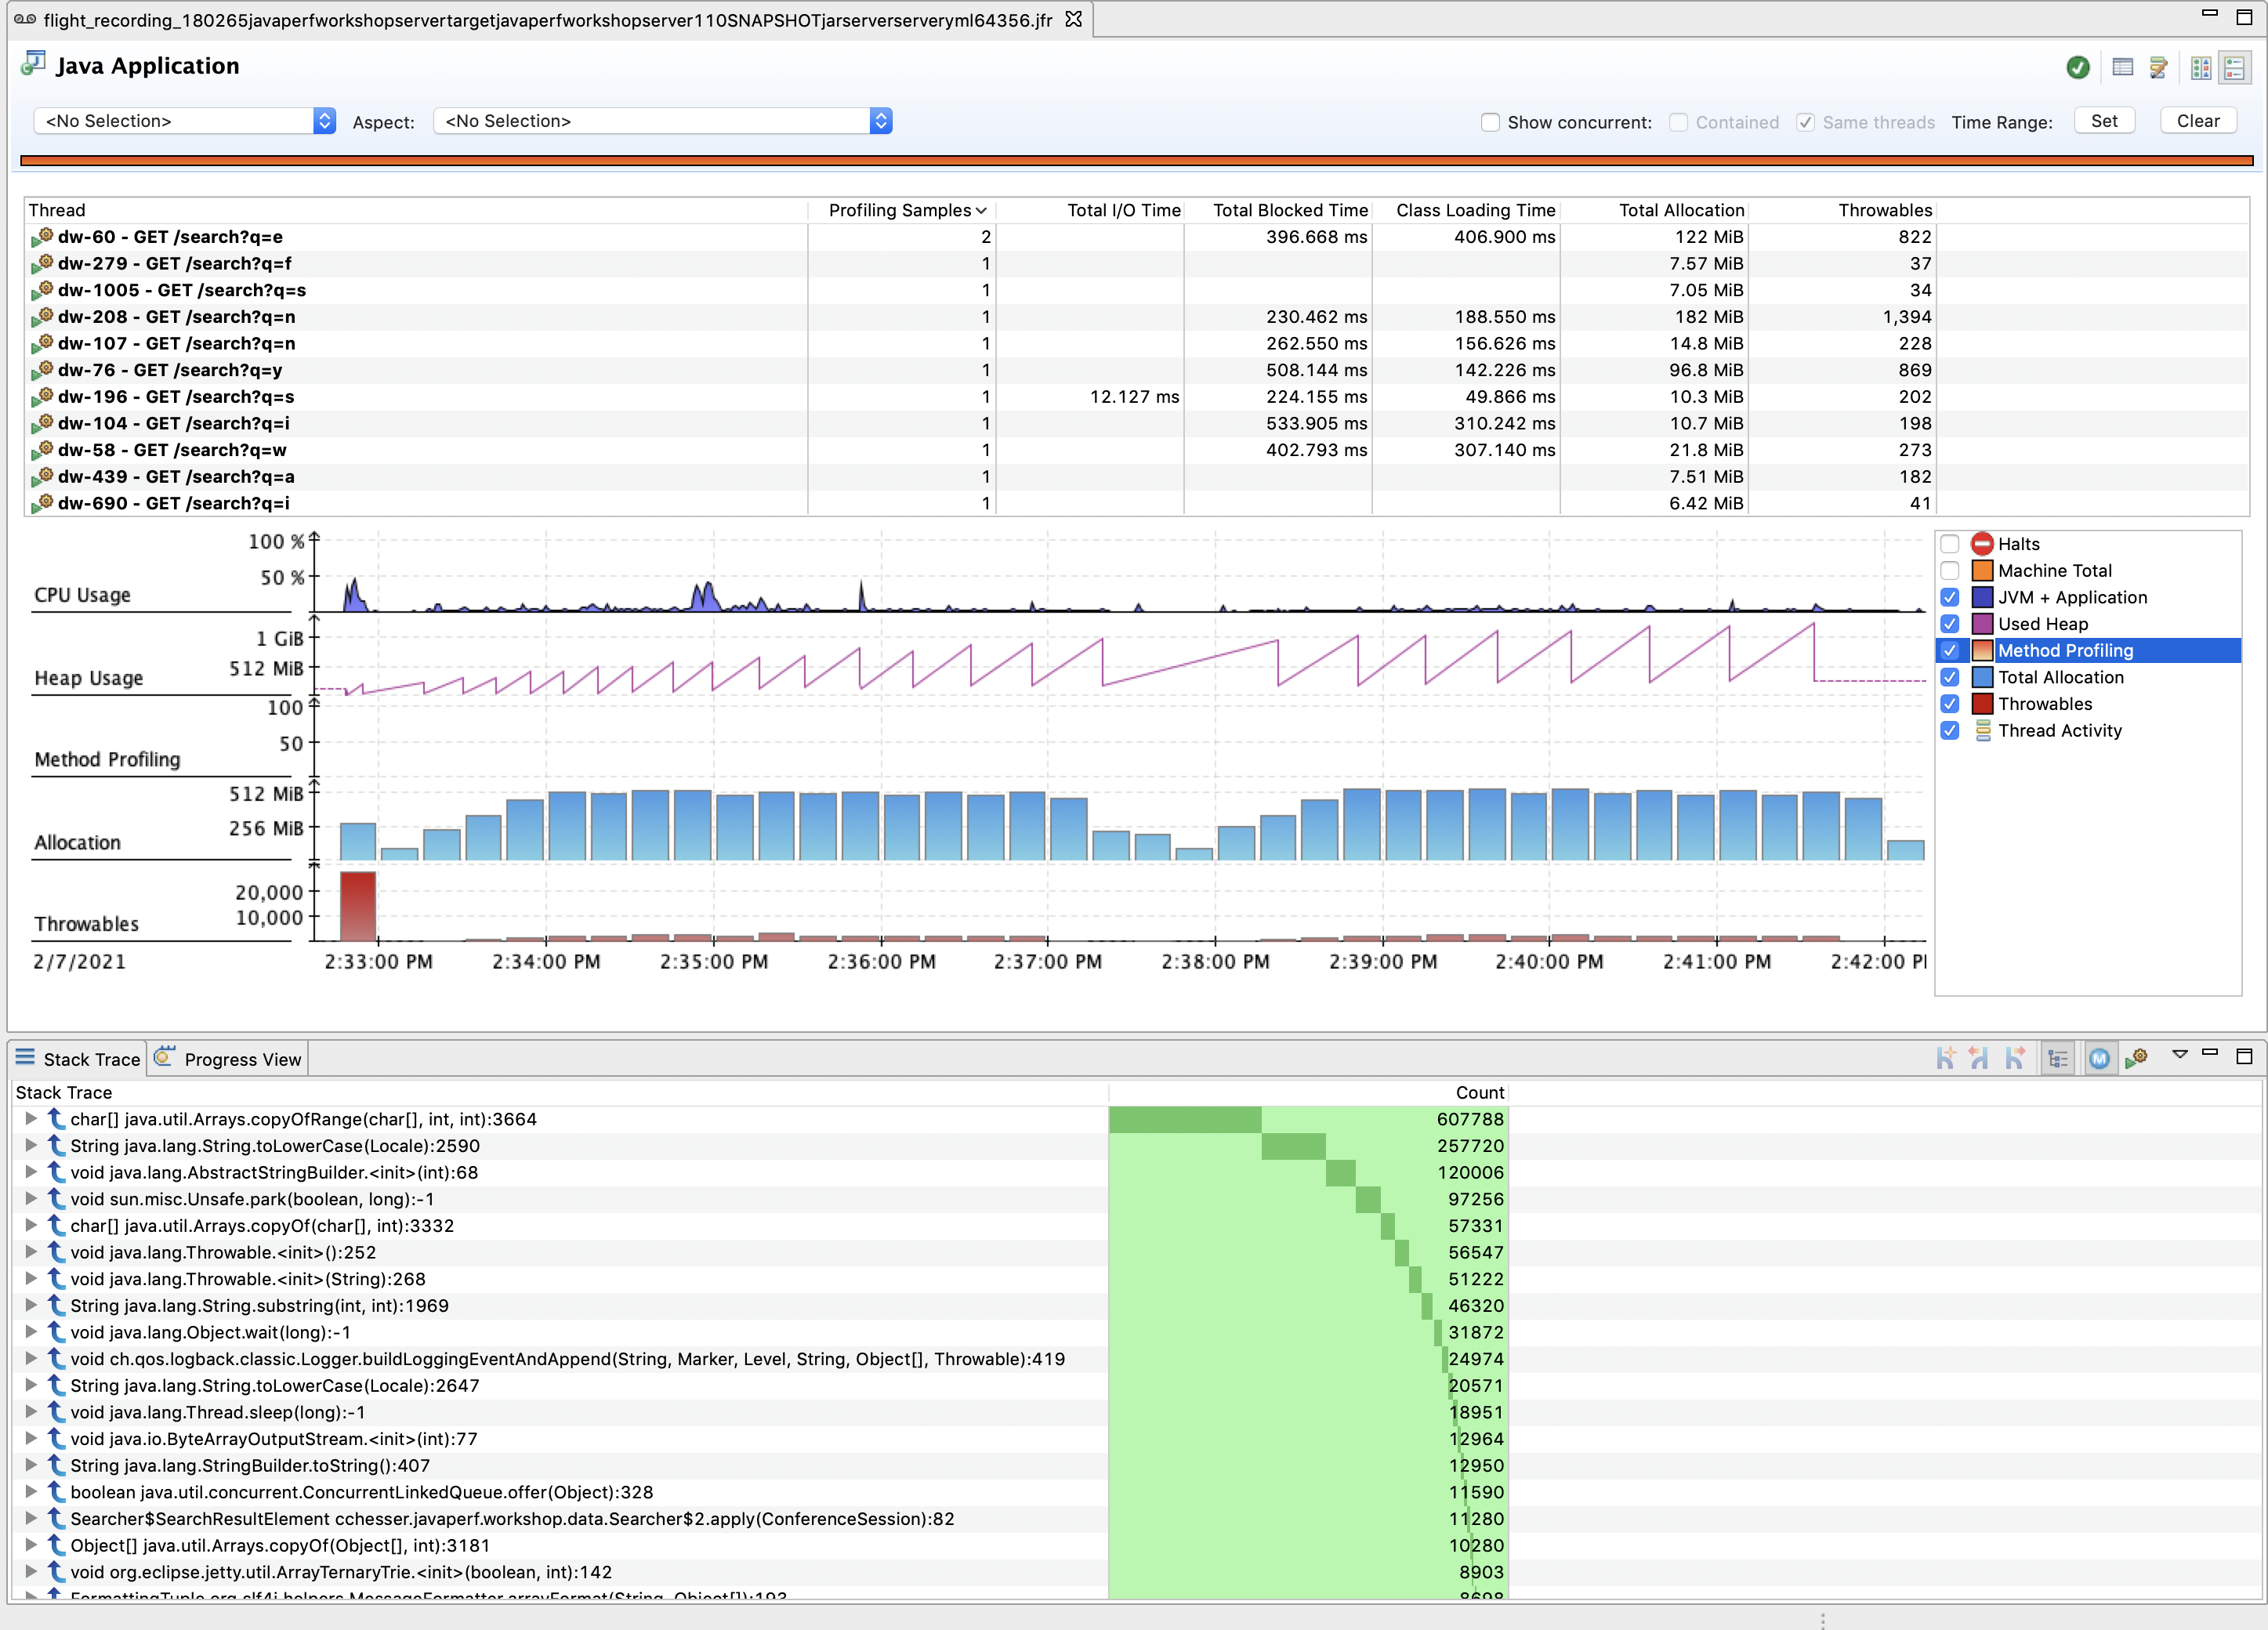
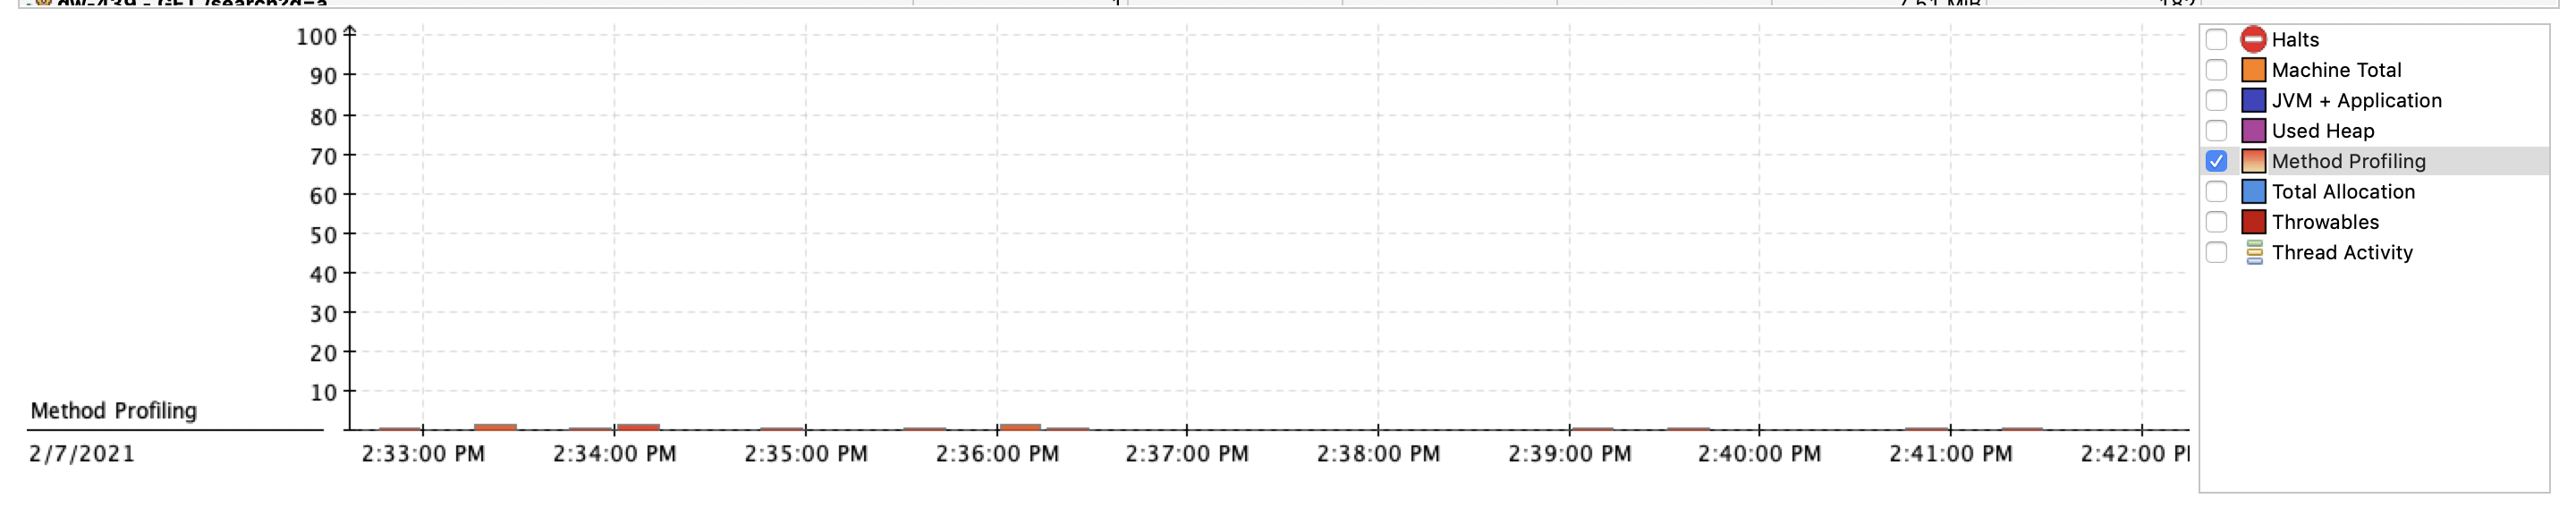
Using the checkboxes on the right of the Graph, select only Method Profiling to narrow down the set of events on the graph:
The Stack Trace view from this page can give you a better count of sampled methods (not just the ones from a specific Method Profiling event)
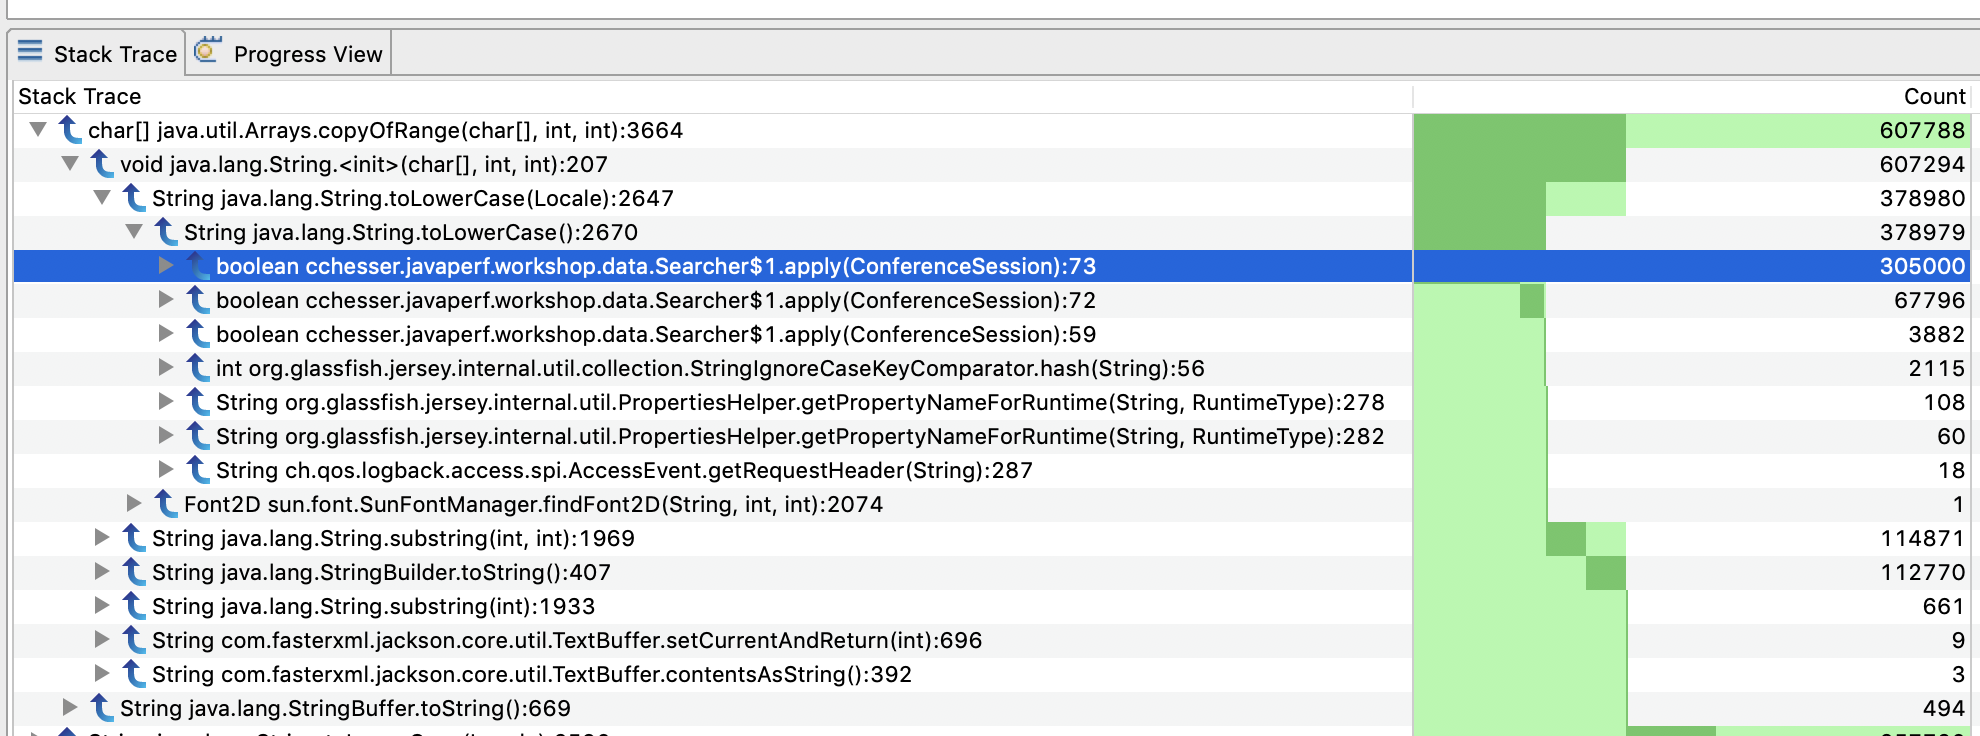
This information is the equivalent of the Hot Methods tab in JMC 5, see forum discussion.
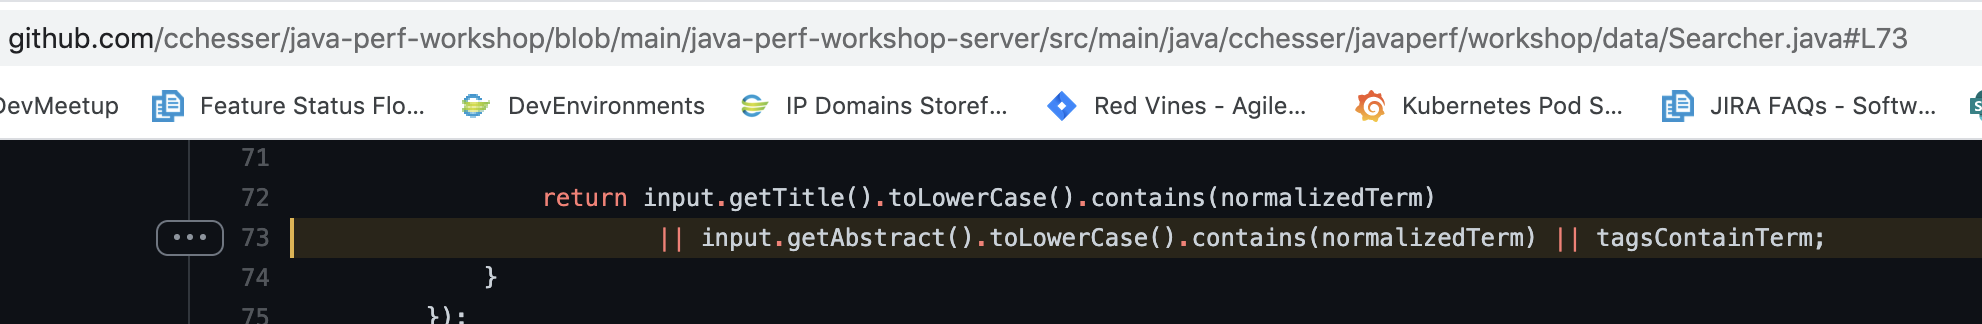
We can then use this information to correlate what is happening in our code:
Explore
- Walk around to look at other areas where you are spending time in your code.
- In many cases you find that there are very expensive areas of code that you cannot change (as you may not own it), but you can dictate whether or not it should be executed (or executed as frequently).
Follow Ups
- Is there any method that stands out to you that might be unnecessarily called?
In the next section, we'll look at the Exceptions thrown by our application.
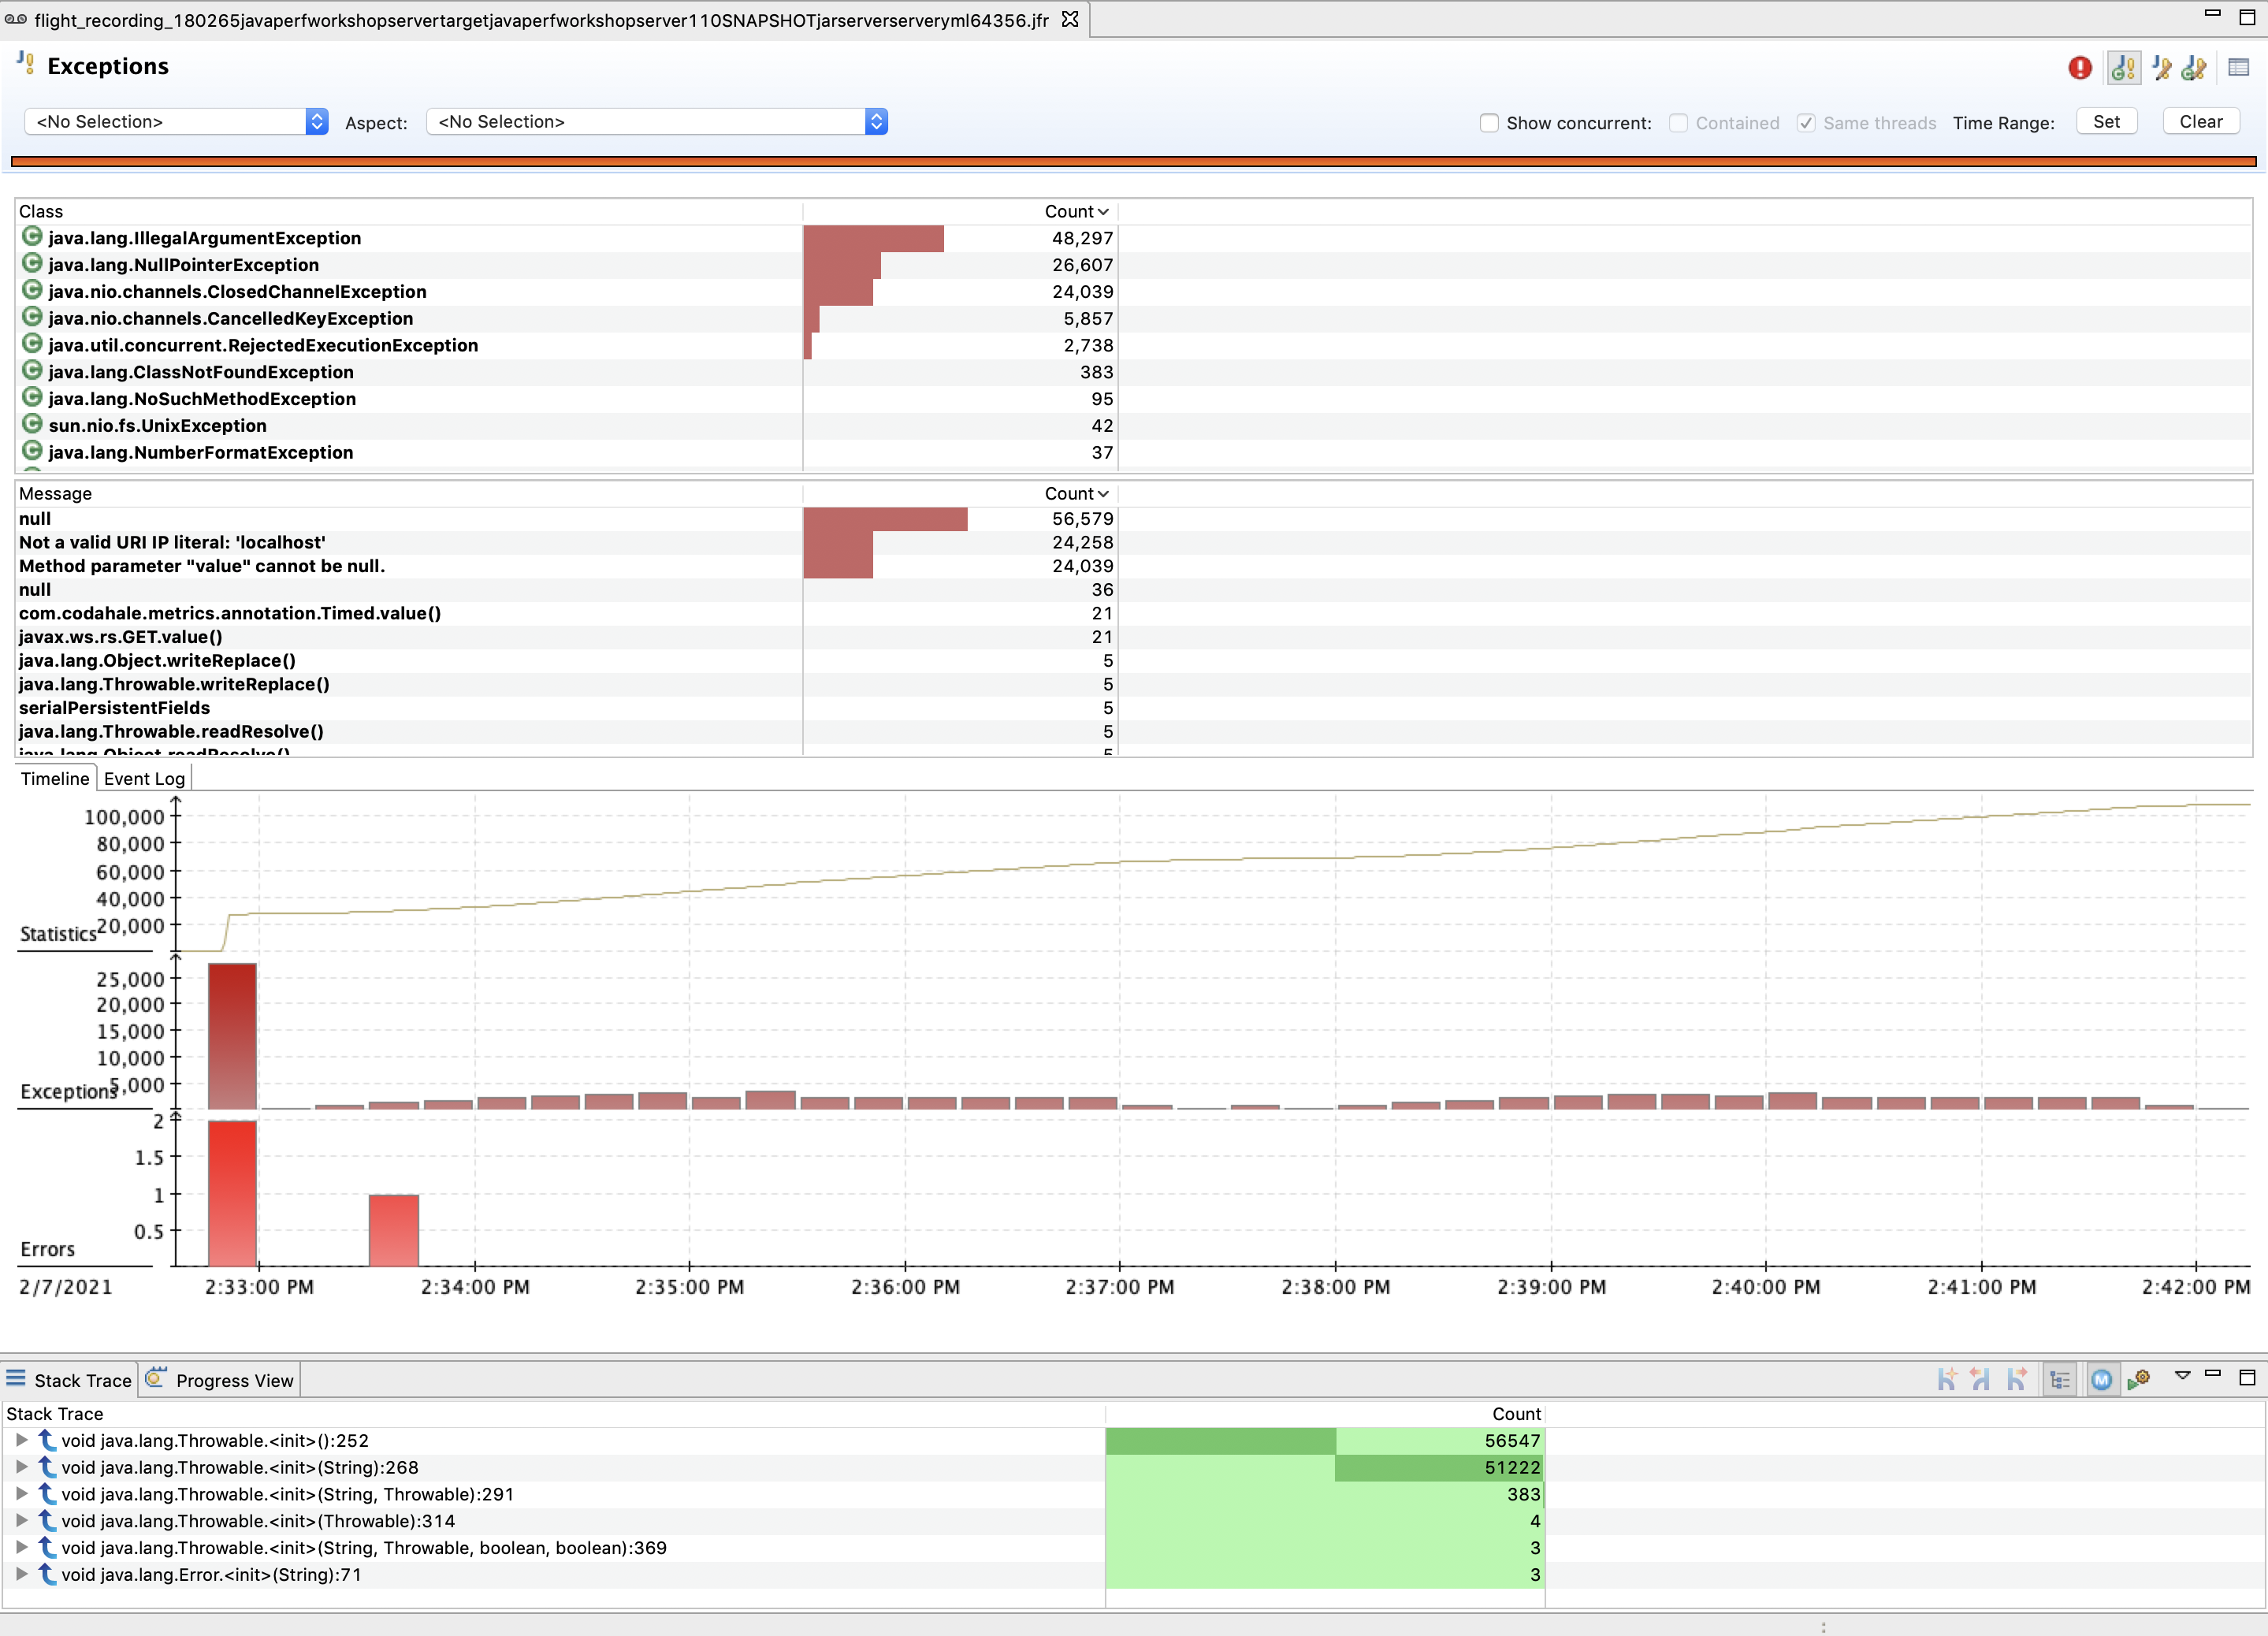
Exceptions4.3 - Exceptions
In this section we’ll dive into the Exceptions page and find out what information we can learn from it. Start by selecting the Exceptions page from the Outline.
This page offers the following sections:
- Overview: You can get Exceptions by Class and Count
- Message: View the detail messages for all exceptions and errors.
- Timeline/Event Log: View when a particular exception was thrown.
- StackTrace: Identify where the exception was thrown from.
 .
.
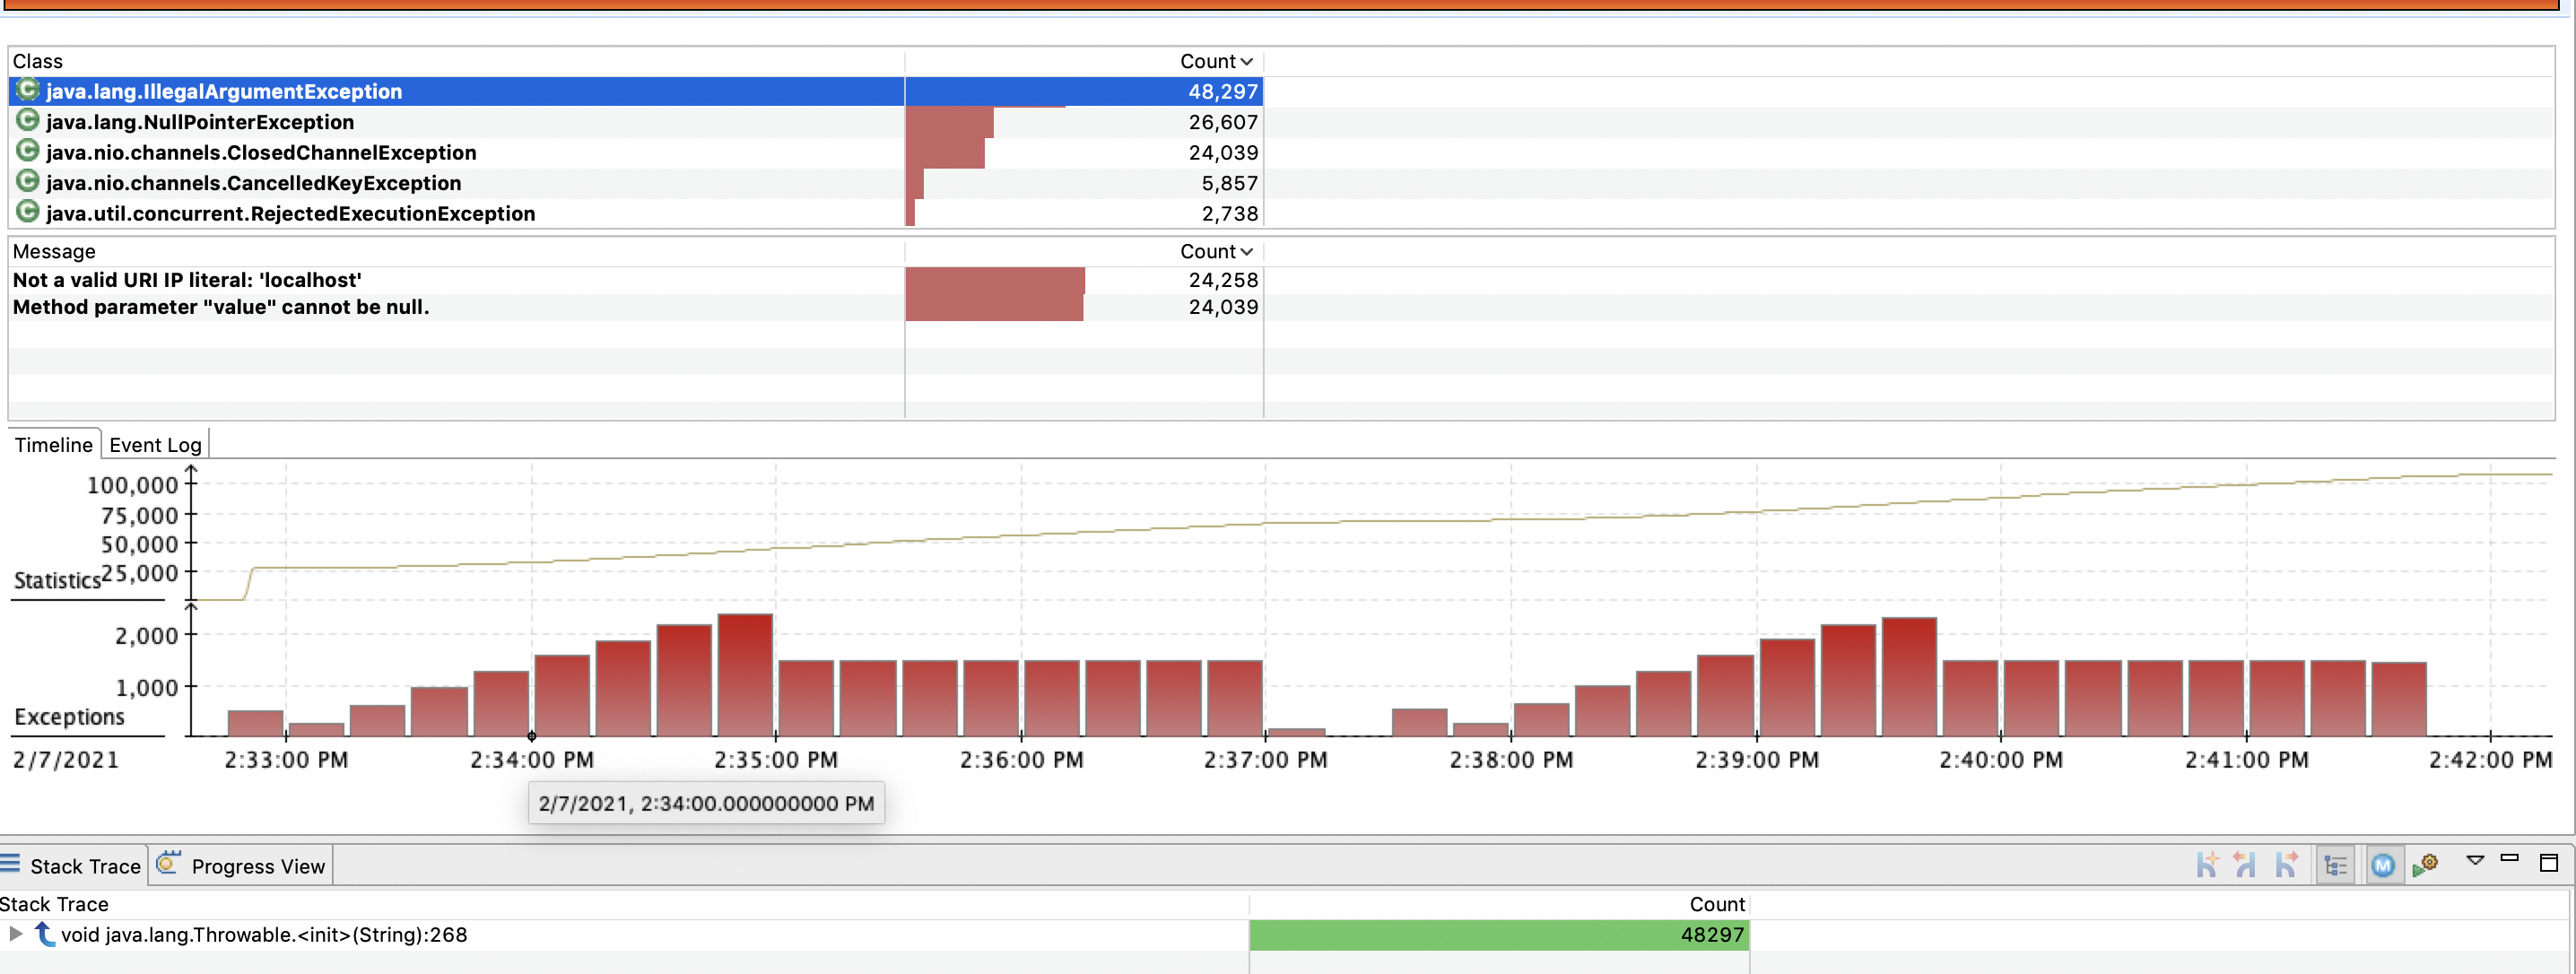
You can select an exception from the table to filter the information to that particular exception. You could also filter by a particular exception message.
Explore
NullPointerExceptions are a familiar exception you deal with in Java, and often times indicate a programming error. Other exception types often point to a common symptom.
Follow Ups
- What are the exceptions that are getting generated the most?
- What stack traces are the contributor?
- Can you find any areas in our code where we may have made an incorrect assumption regarding nullability?
- Are there any other areas in our code where we might have made an incorrect assumption based on an exception’s class?
- Are there any exceptions that might indicate a problem with our dependencies?
In the next section, we'll look at the Threads used by our application.
Threads4.4 - Threads
The Threads page provides a snapshot of all threads in our application, and we can use it to acquire information about computation and latency events.
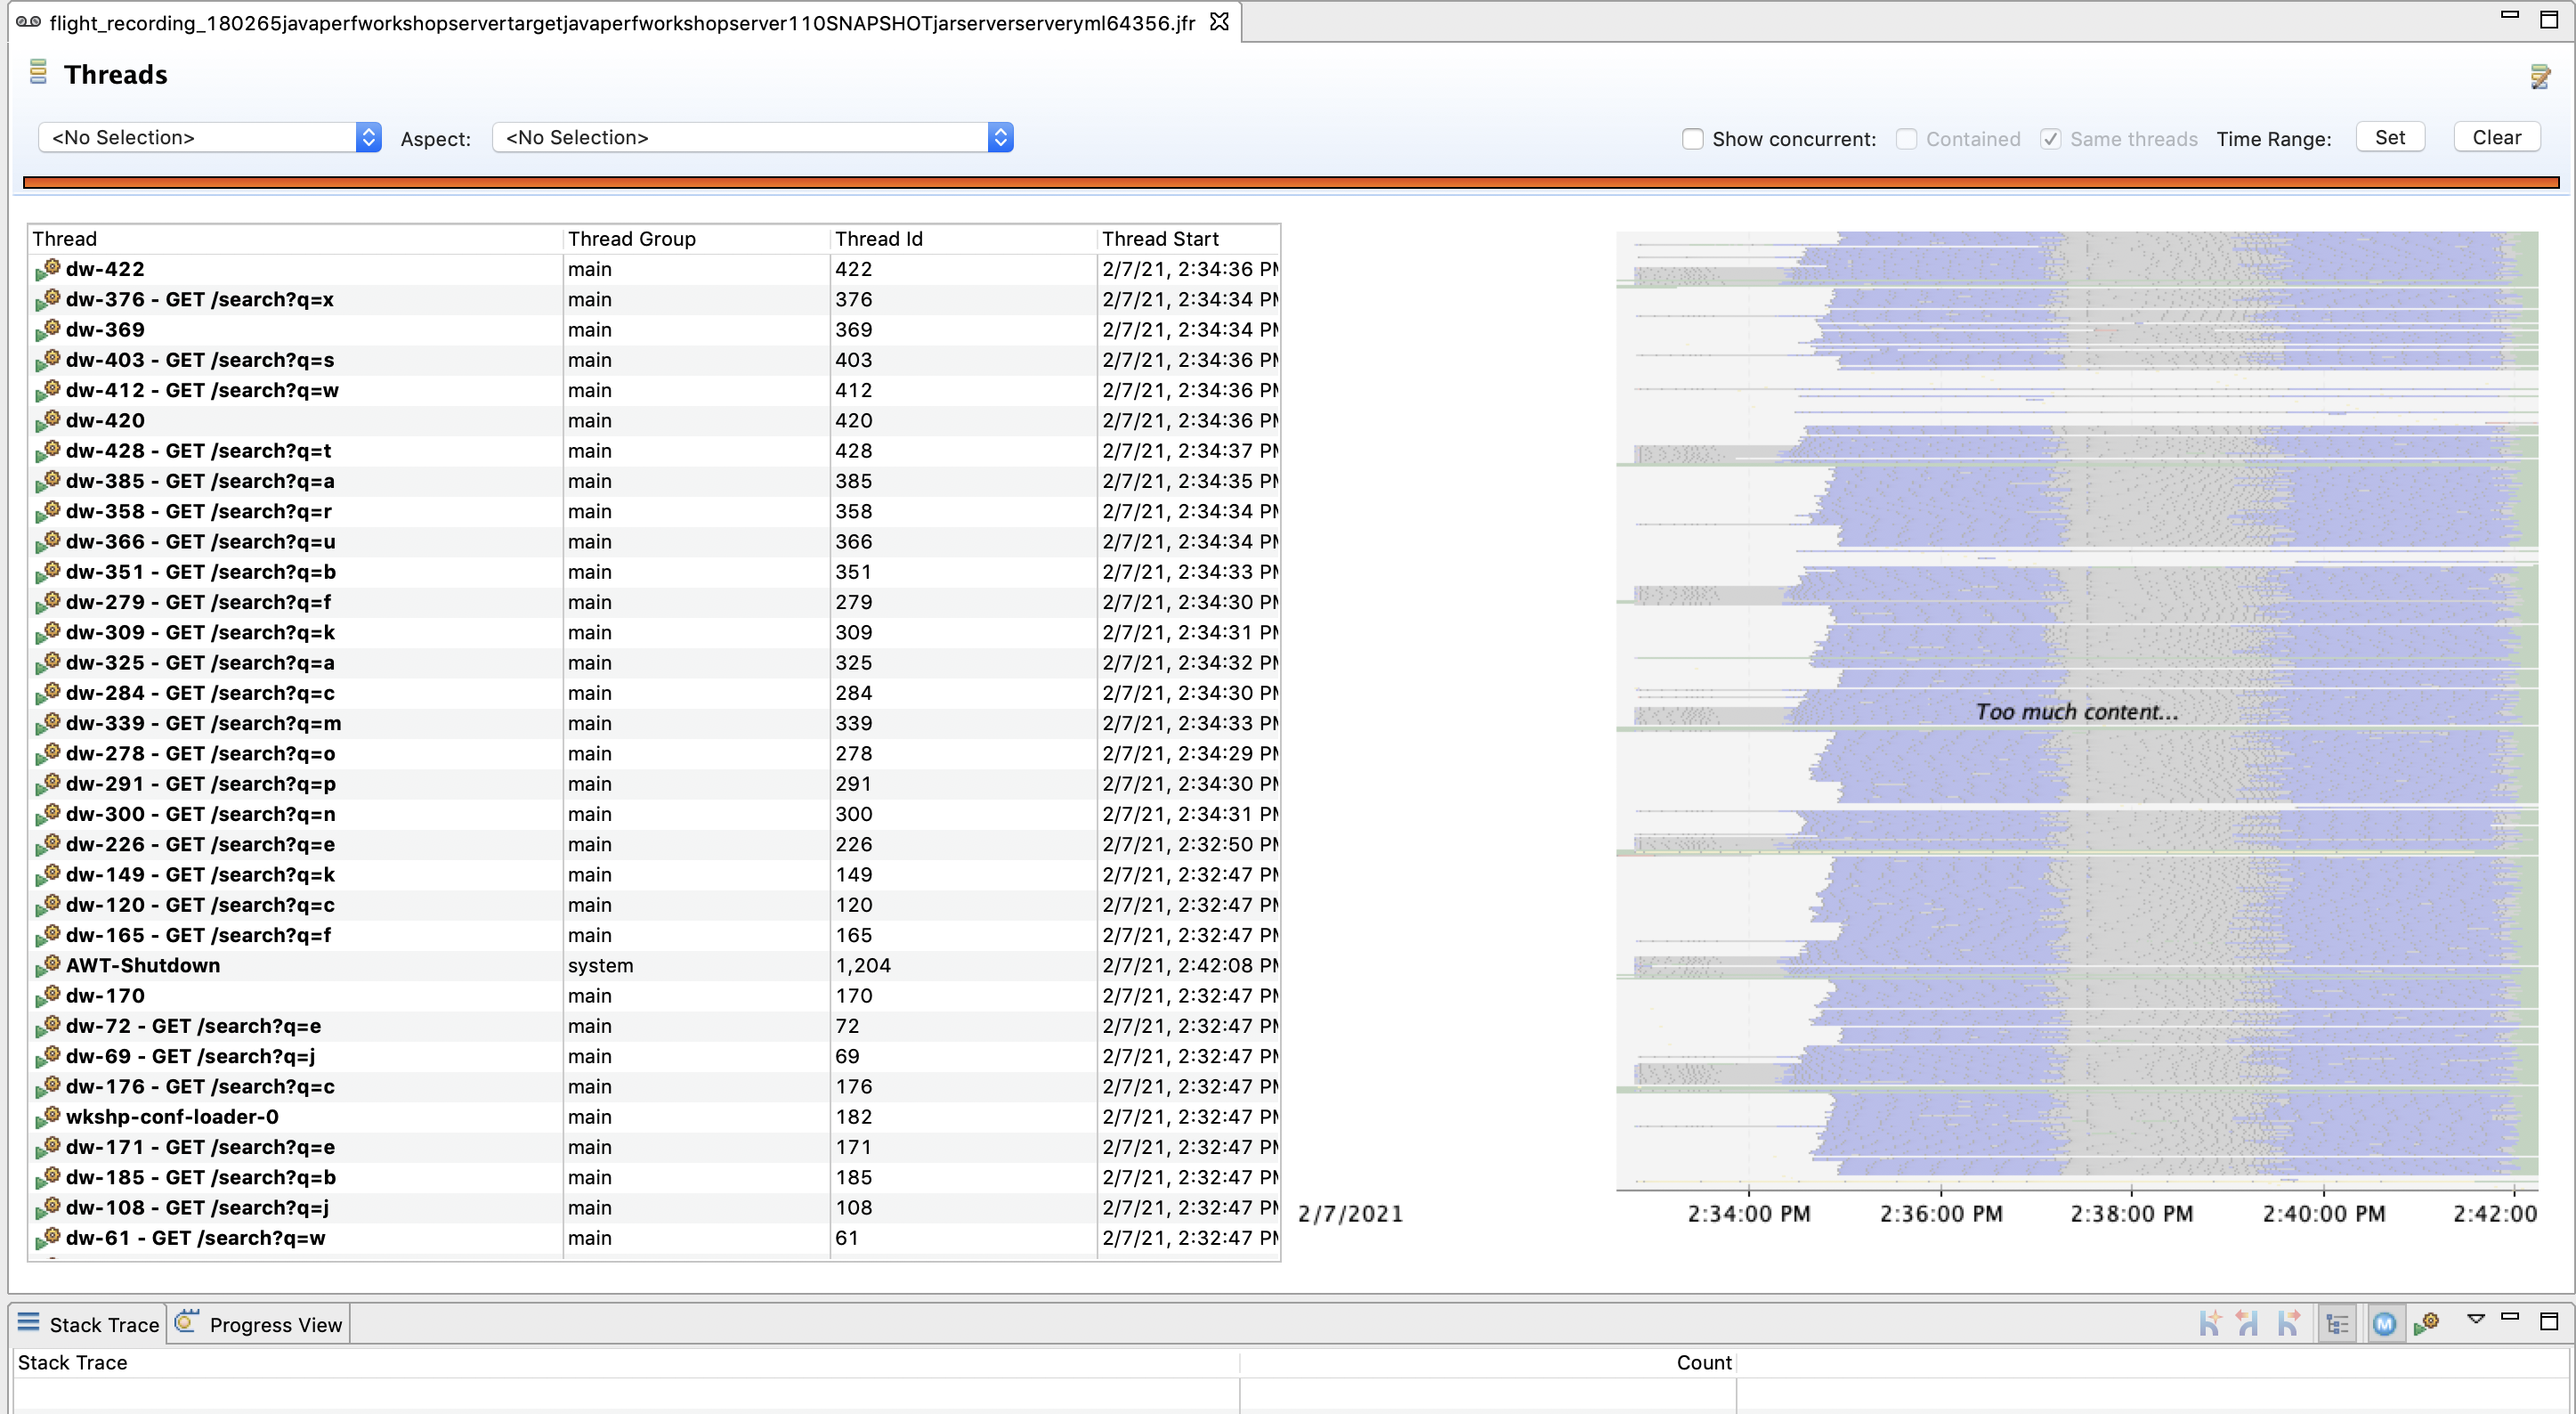
Thread Chart
We can use the Thread Chart view to select a region of time and view the state of threads and the most common stack frames for that particular time slice:
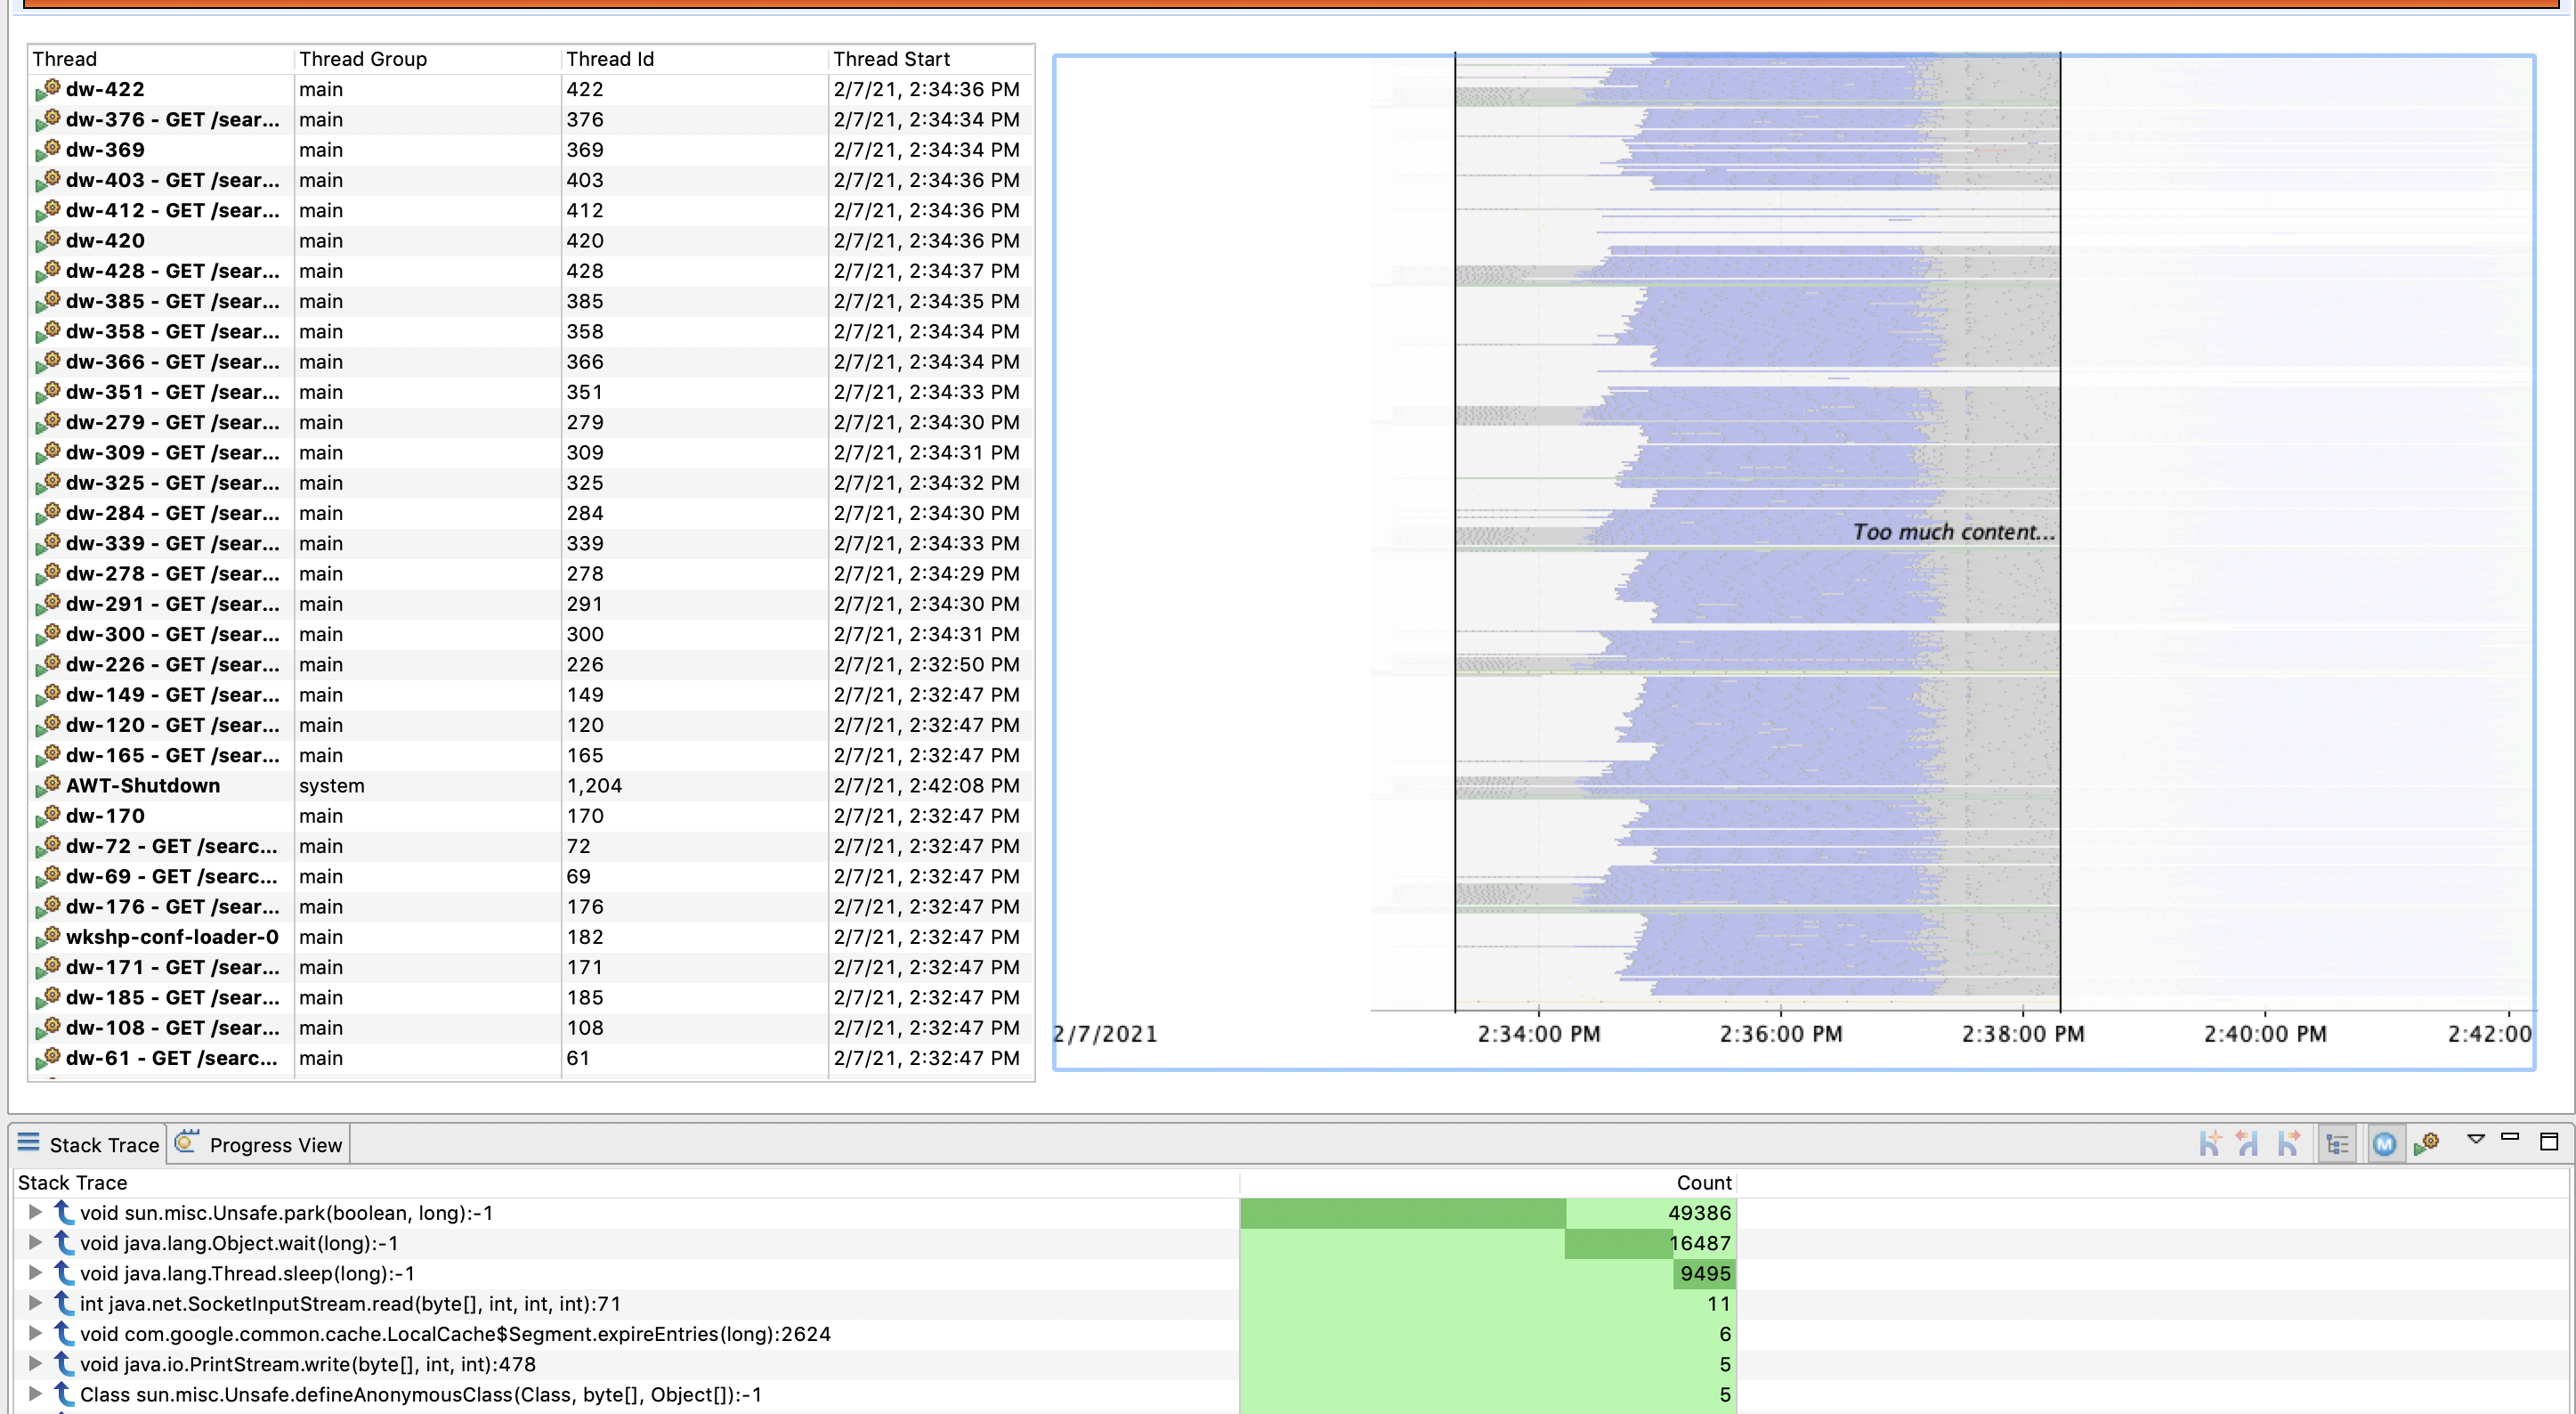
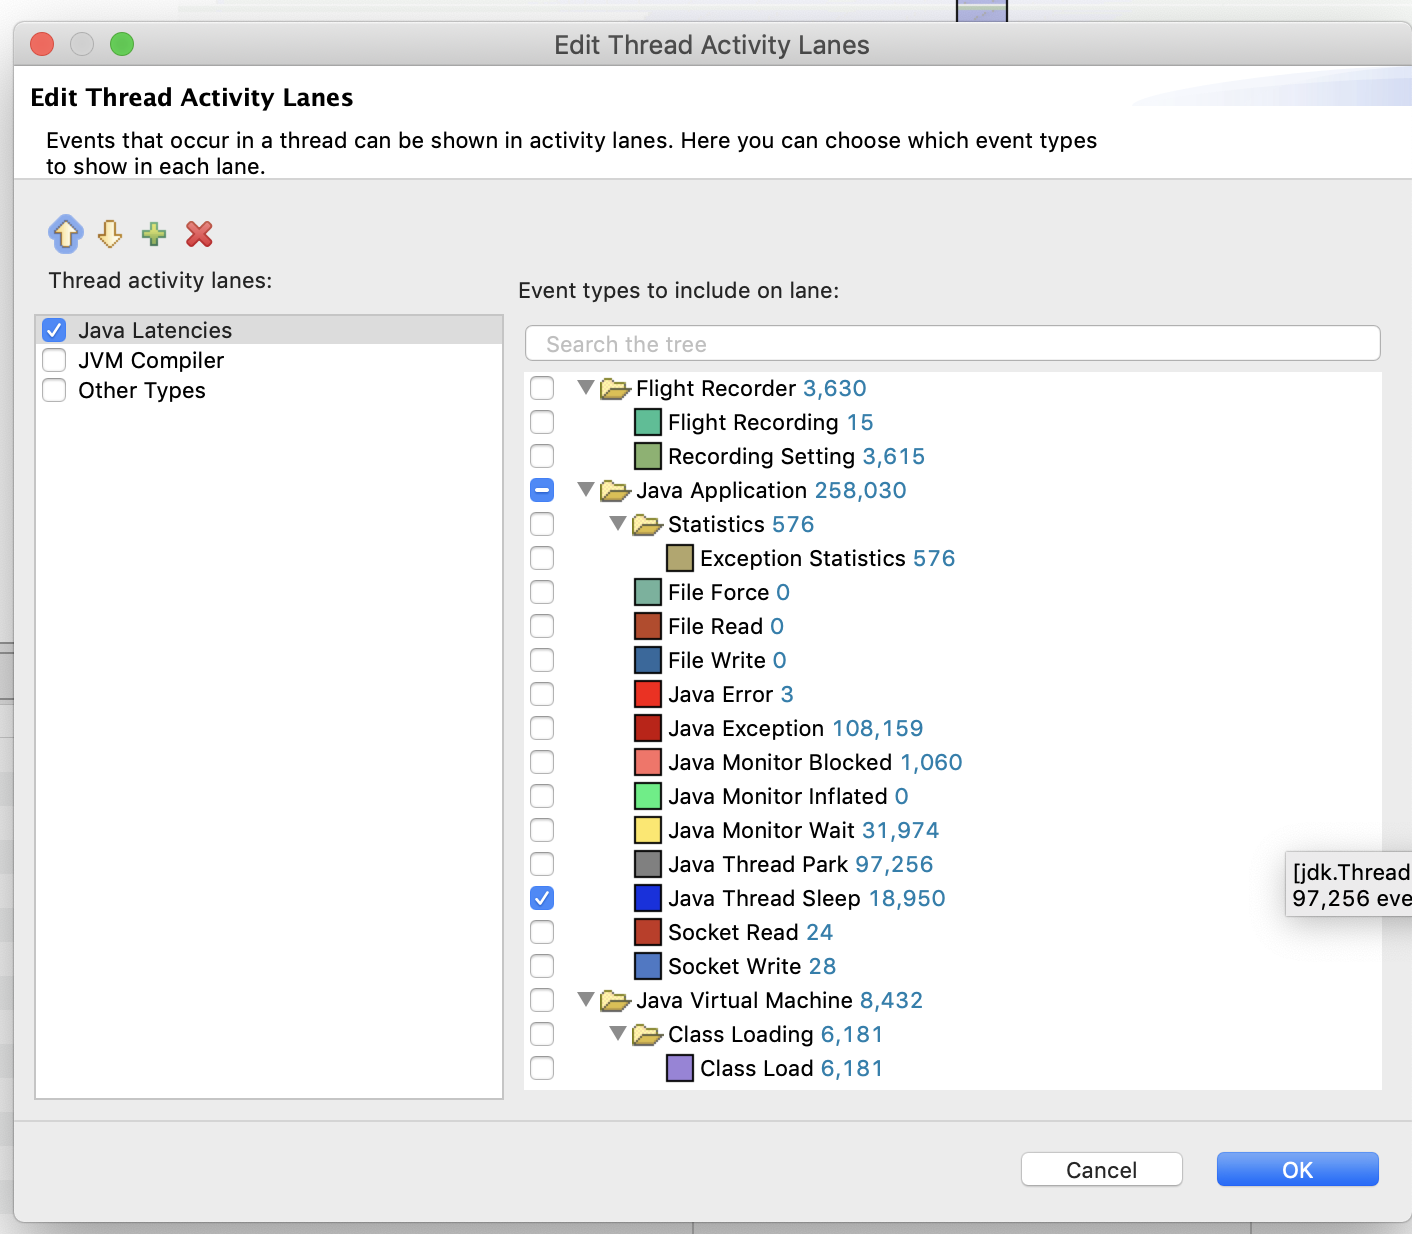
We can also edit the types of events shown by the chart. Right click on the chart, and select Edit Thread Activity Lanes
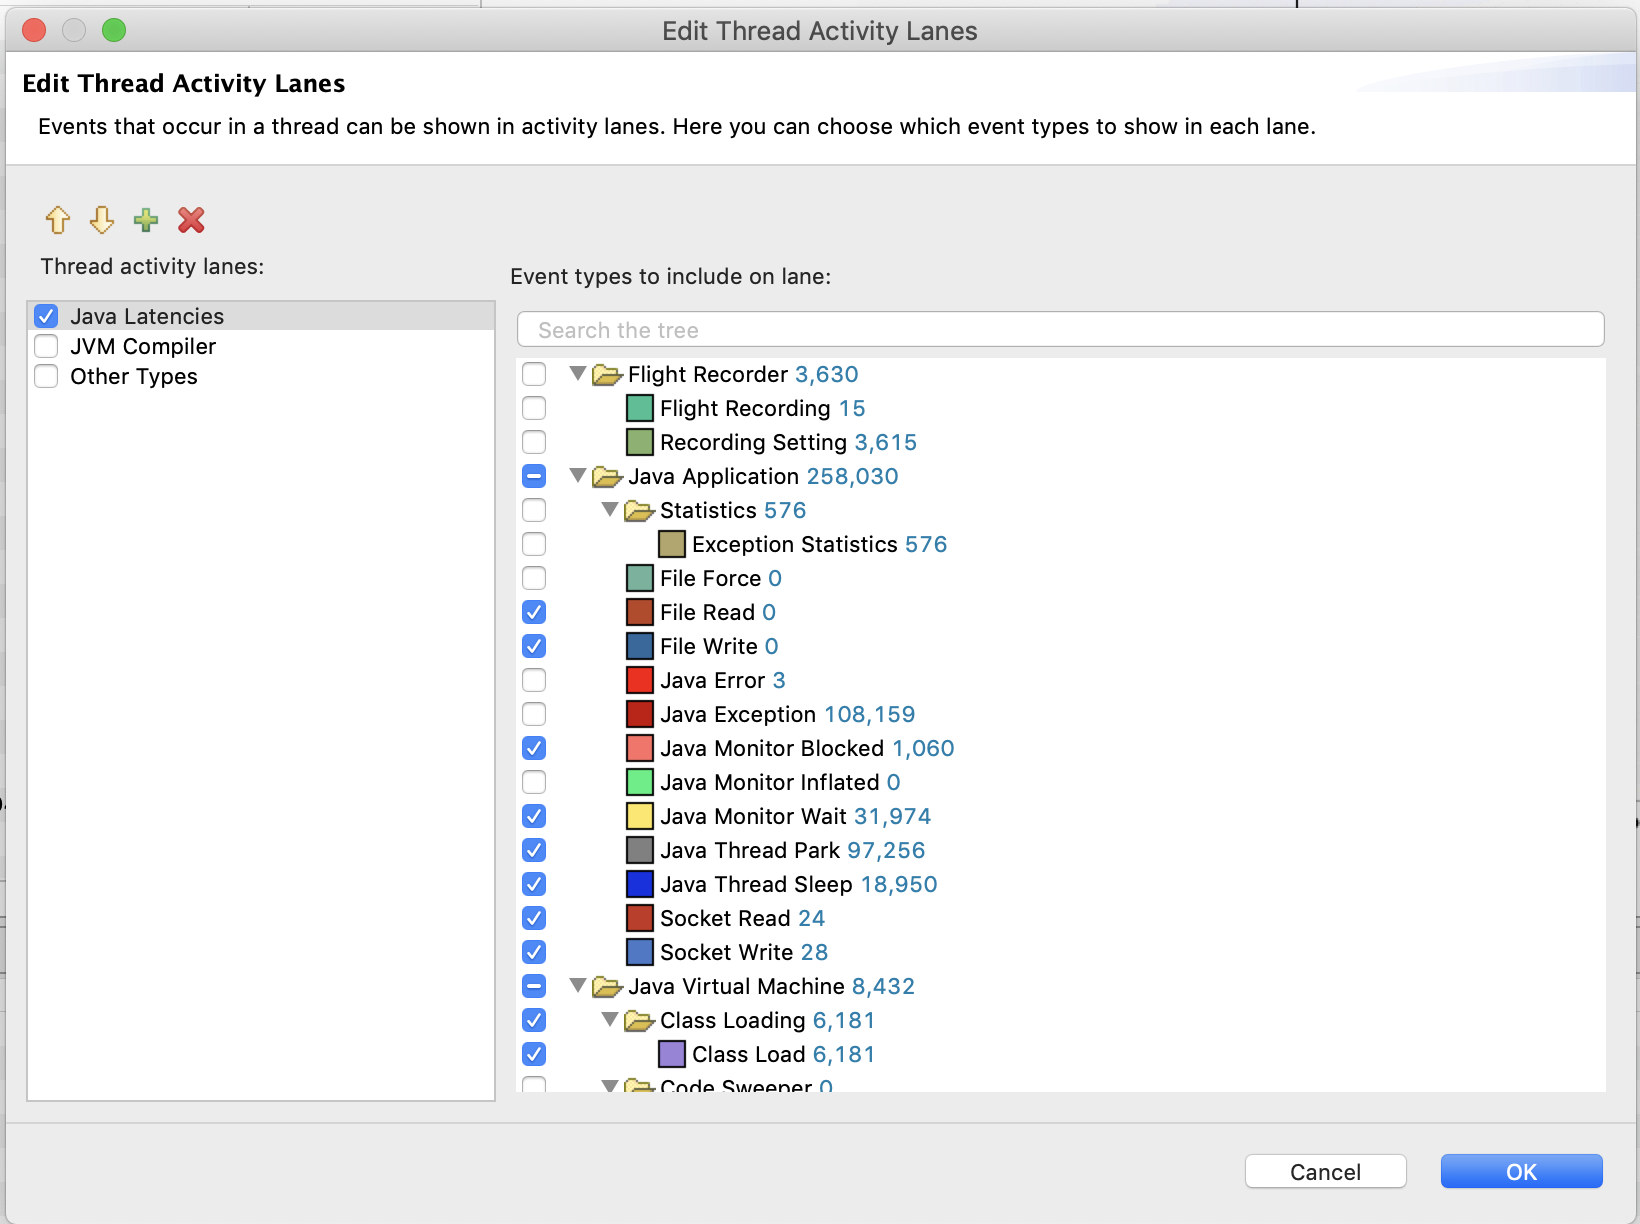
We can then narrow down on specific events.
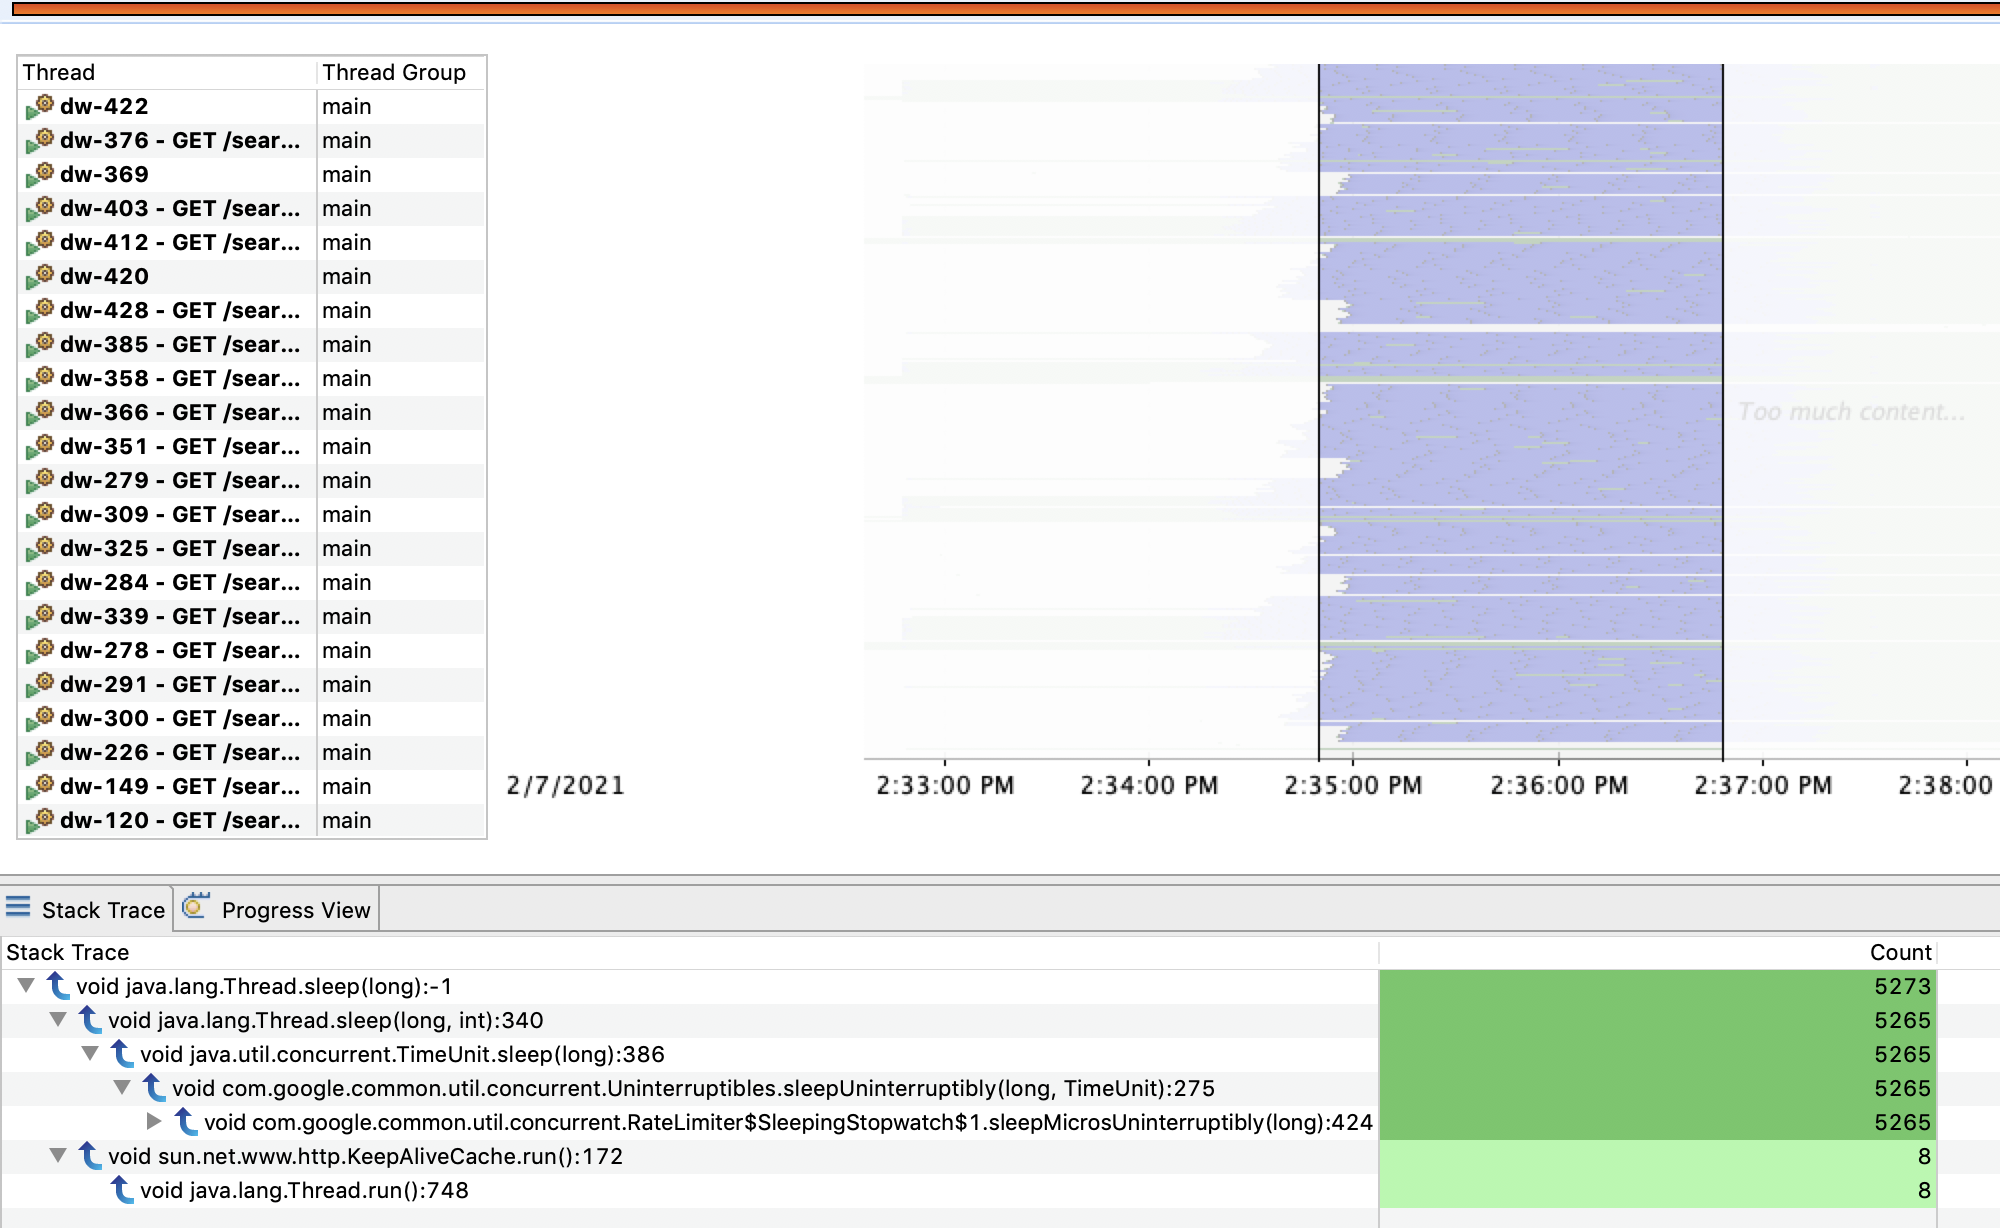
For the purpose of this section filter on only the Sleep events. Then, select a period of time and look at what has caused our threads to go to sleep for that particular period:
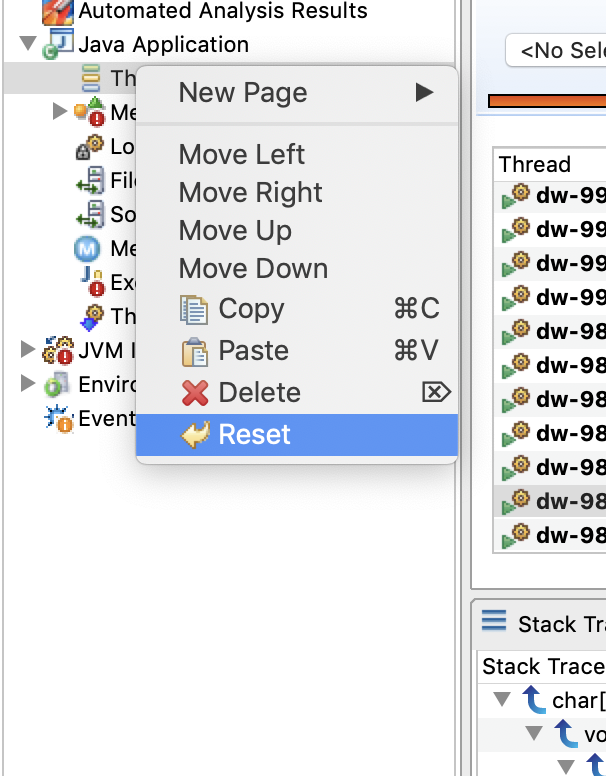
Once you’re done with the filtered view, right click on the Thread page and Reset the page (to return to the default state).
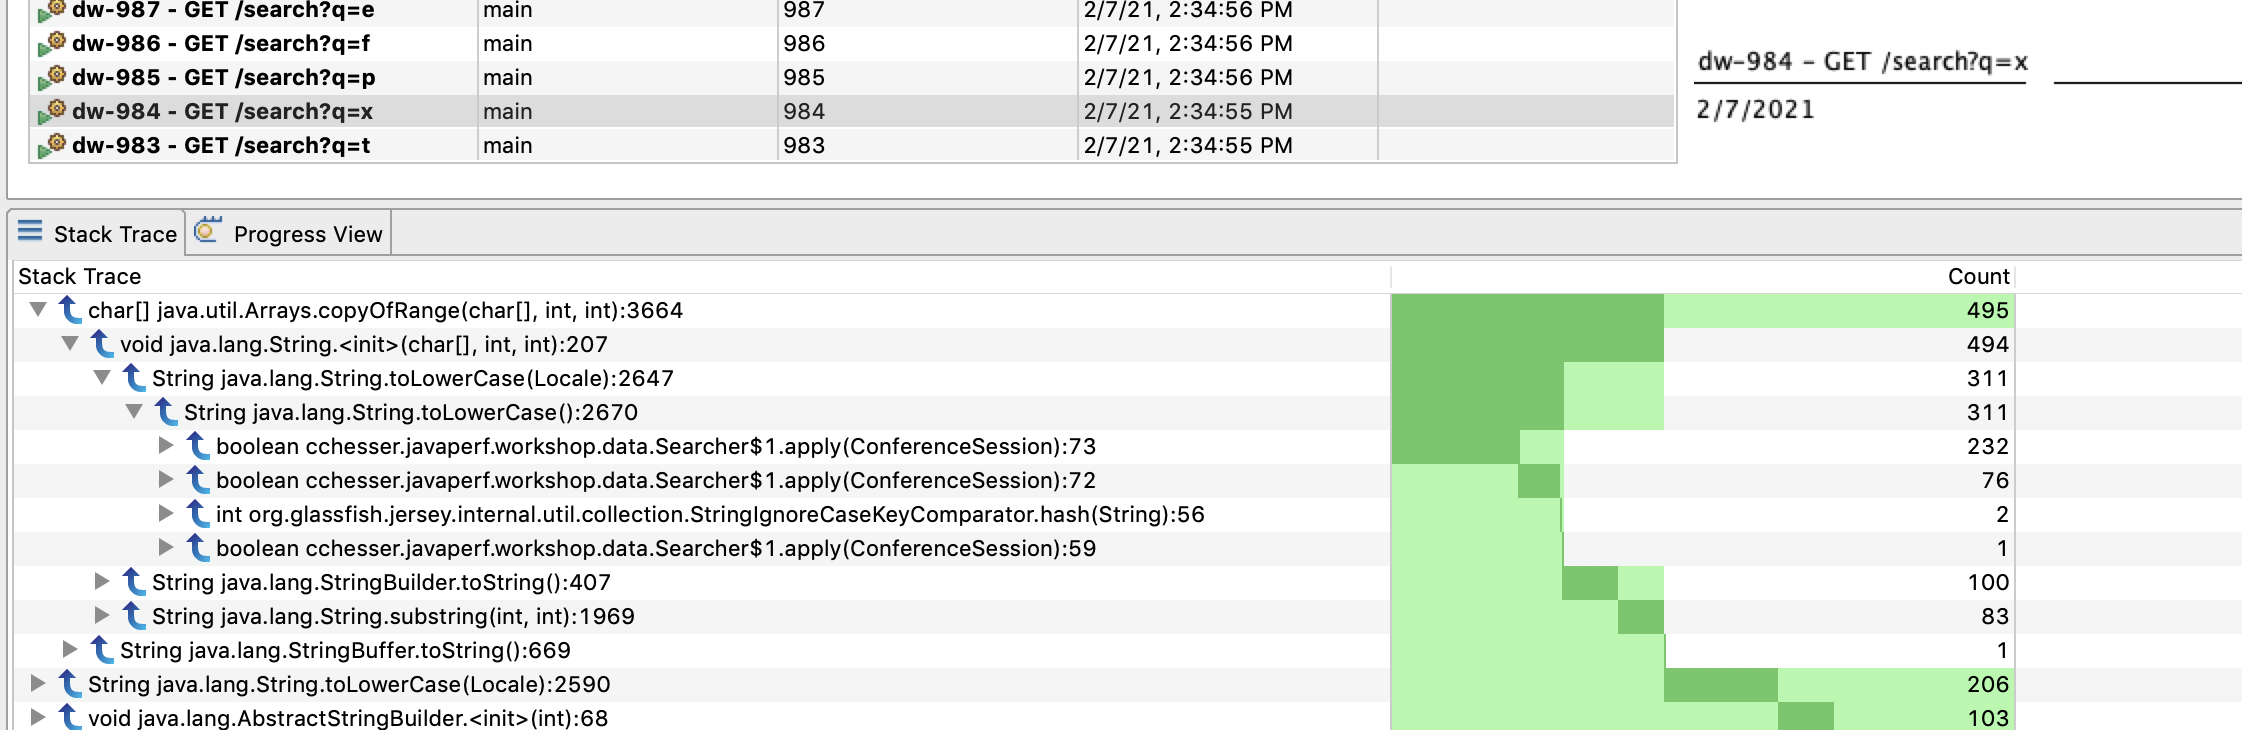
By Thread
We can select an individual thread from the Thread Table to further filter the data just for that thread. From this filtered view, we can inspect what the commonly executed methods are for a particular thread.
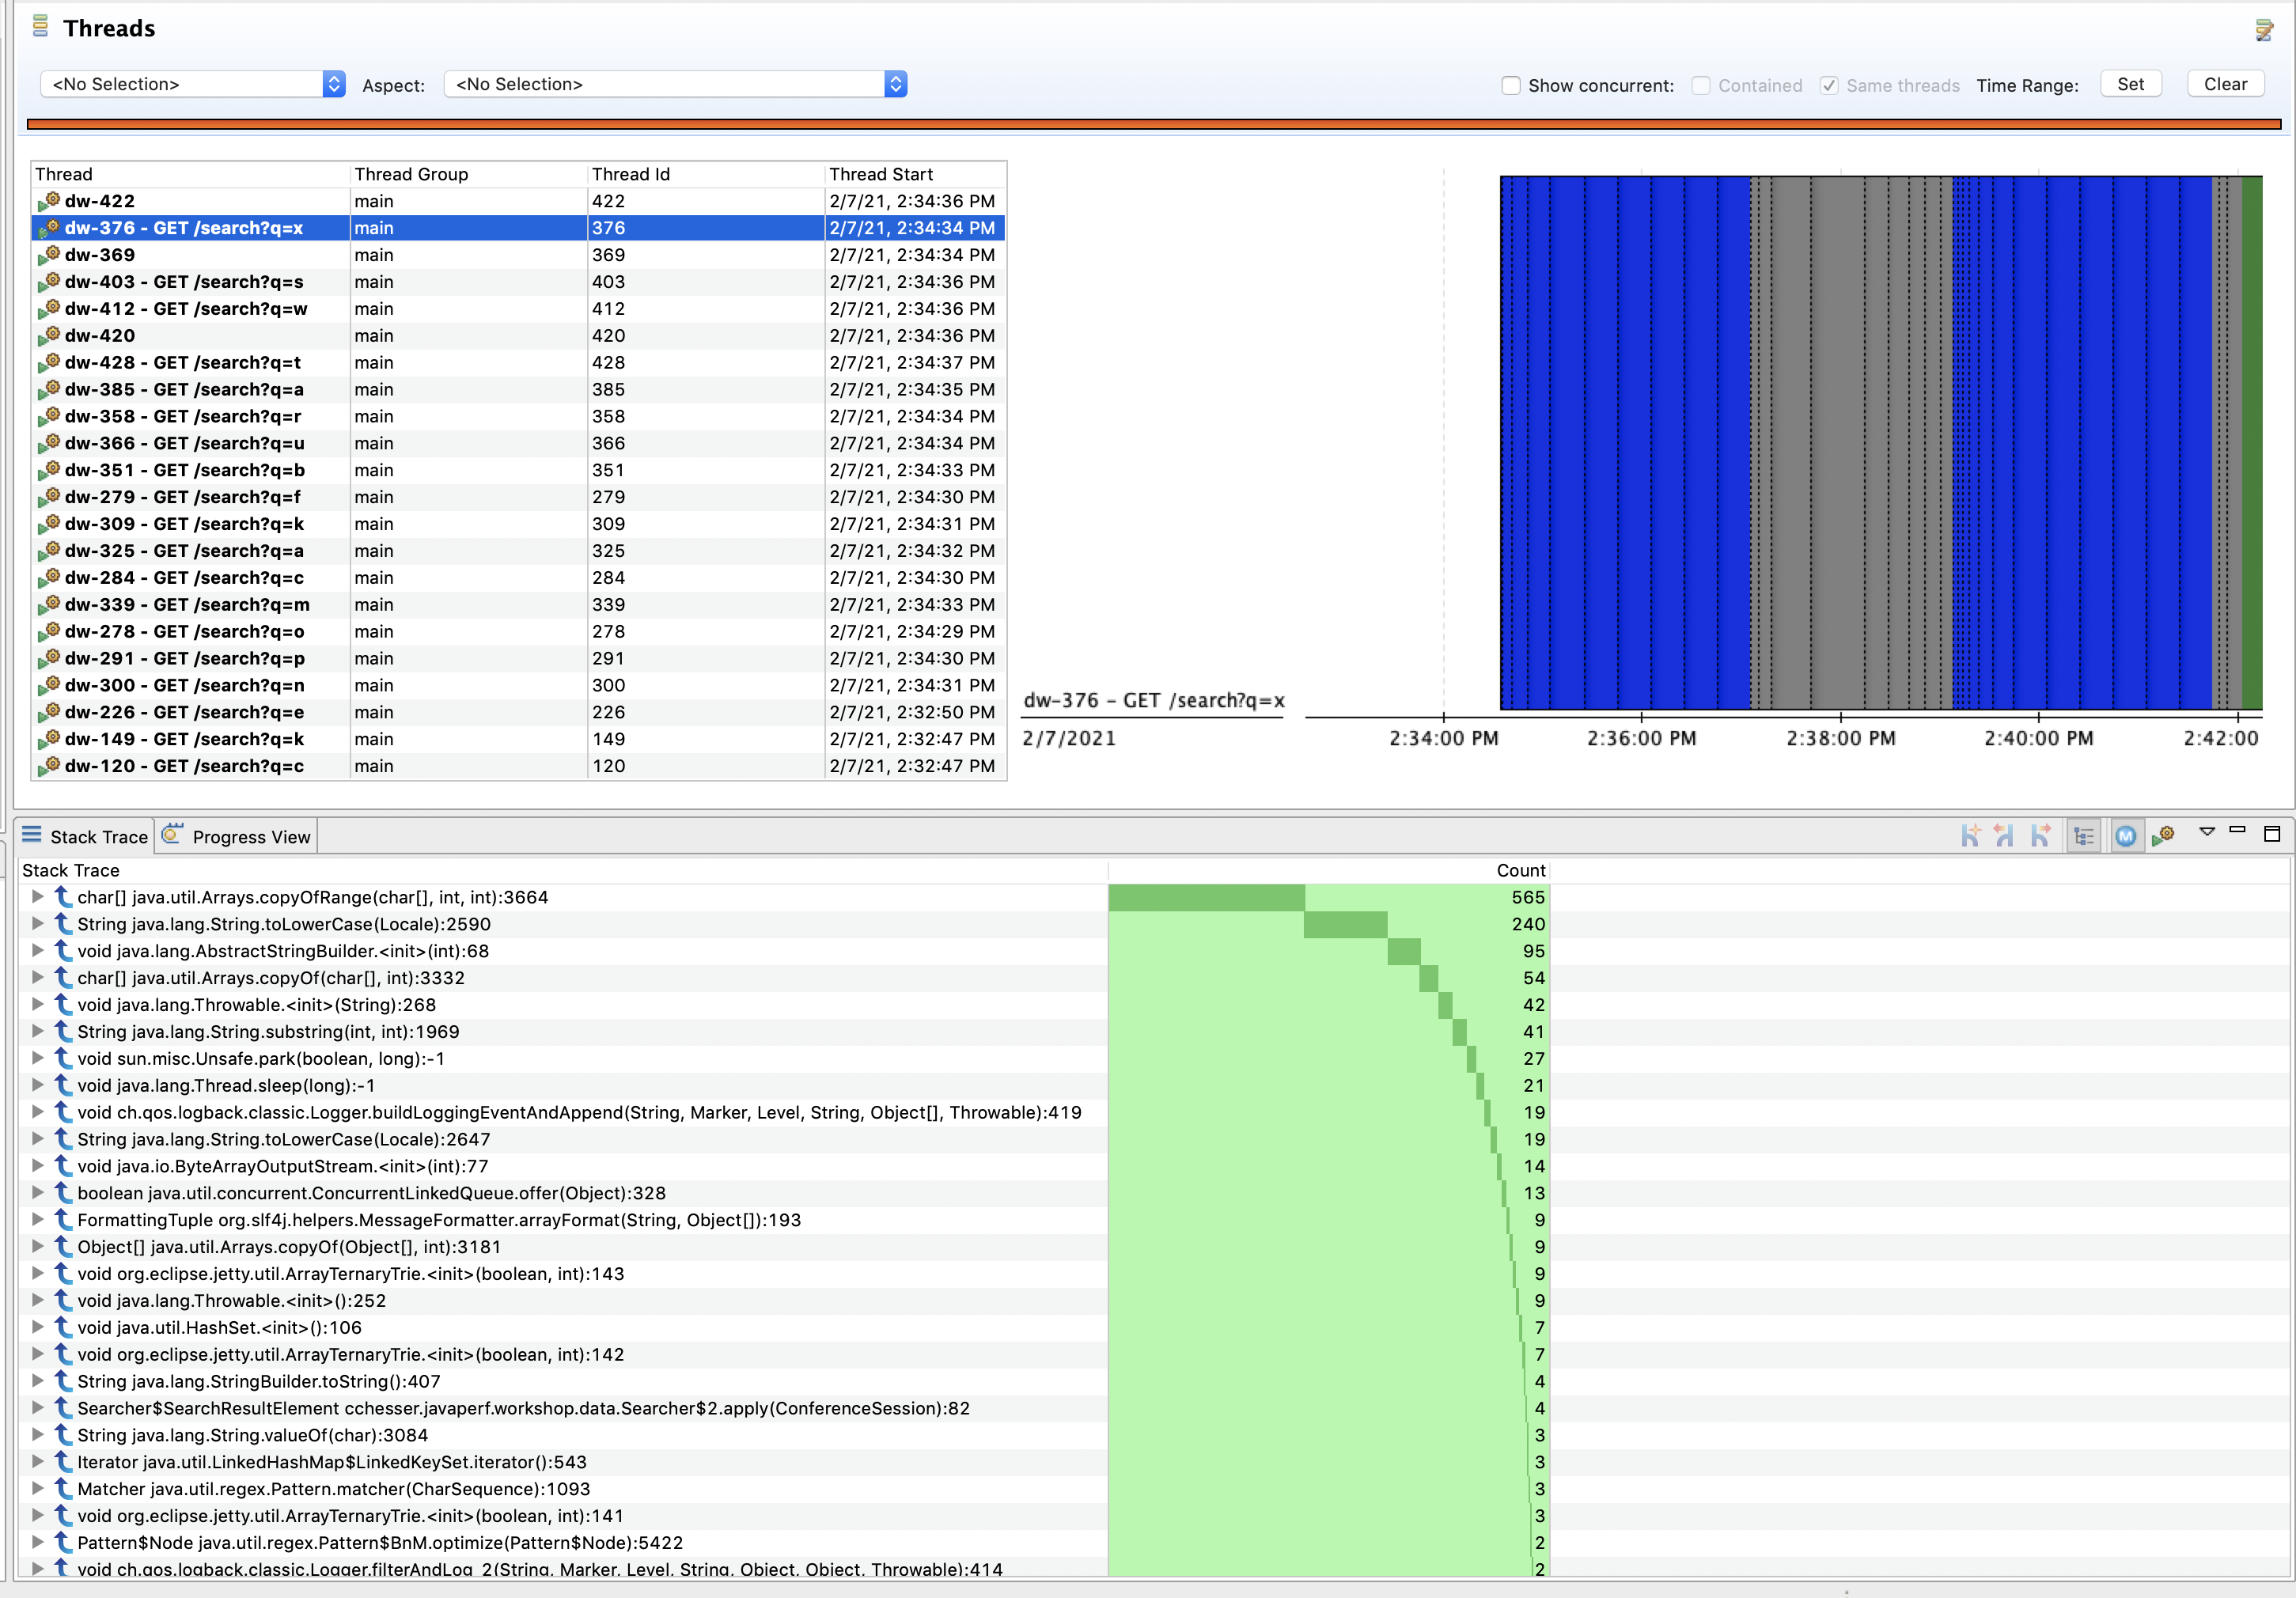
We can then use the stacktrace view to correlate what piece of code executed the most.
Explore
There’s a couple of threads specifically created by our application, these are the wkshp-conf-loader named threads. The dw-* named threads are threads created by DropWizard to handle specific requests (you might have noticed this based on the name containing a REST Resource). Explore the state of some of these threads while thinking about the follow up questions.
Follow Ups
- Where are we spending most of our time sleeping? What is causing this?
- Are there any unnecessary method invocations? Are any threads doing work that isn’t visible?
In the next section, we'll look at the Memory state of our application.
Memory4.5 - Memory
The memory page shows us the overall memory usage and garbage collection events for our recording.
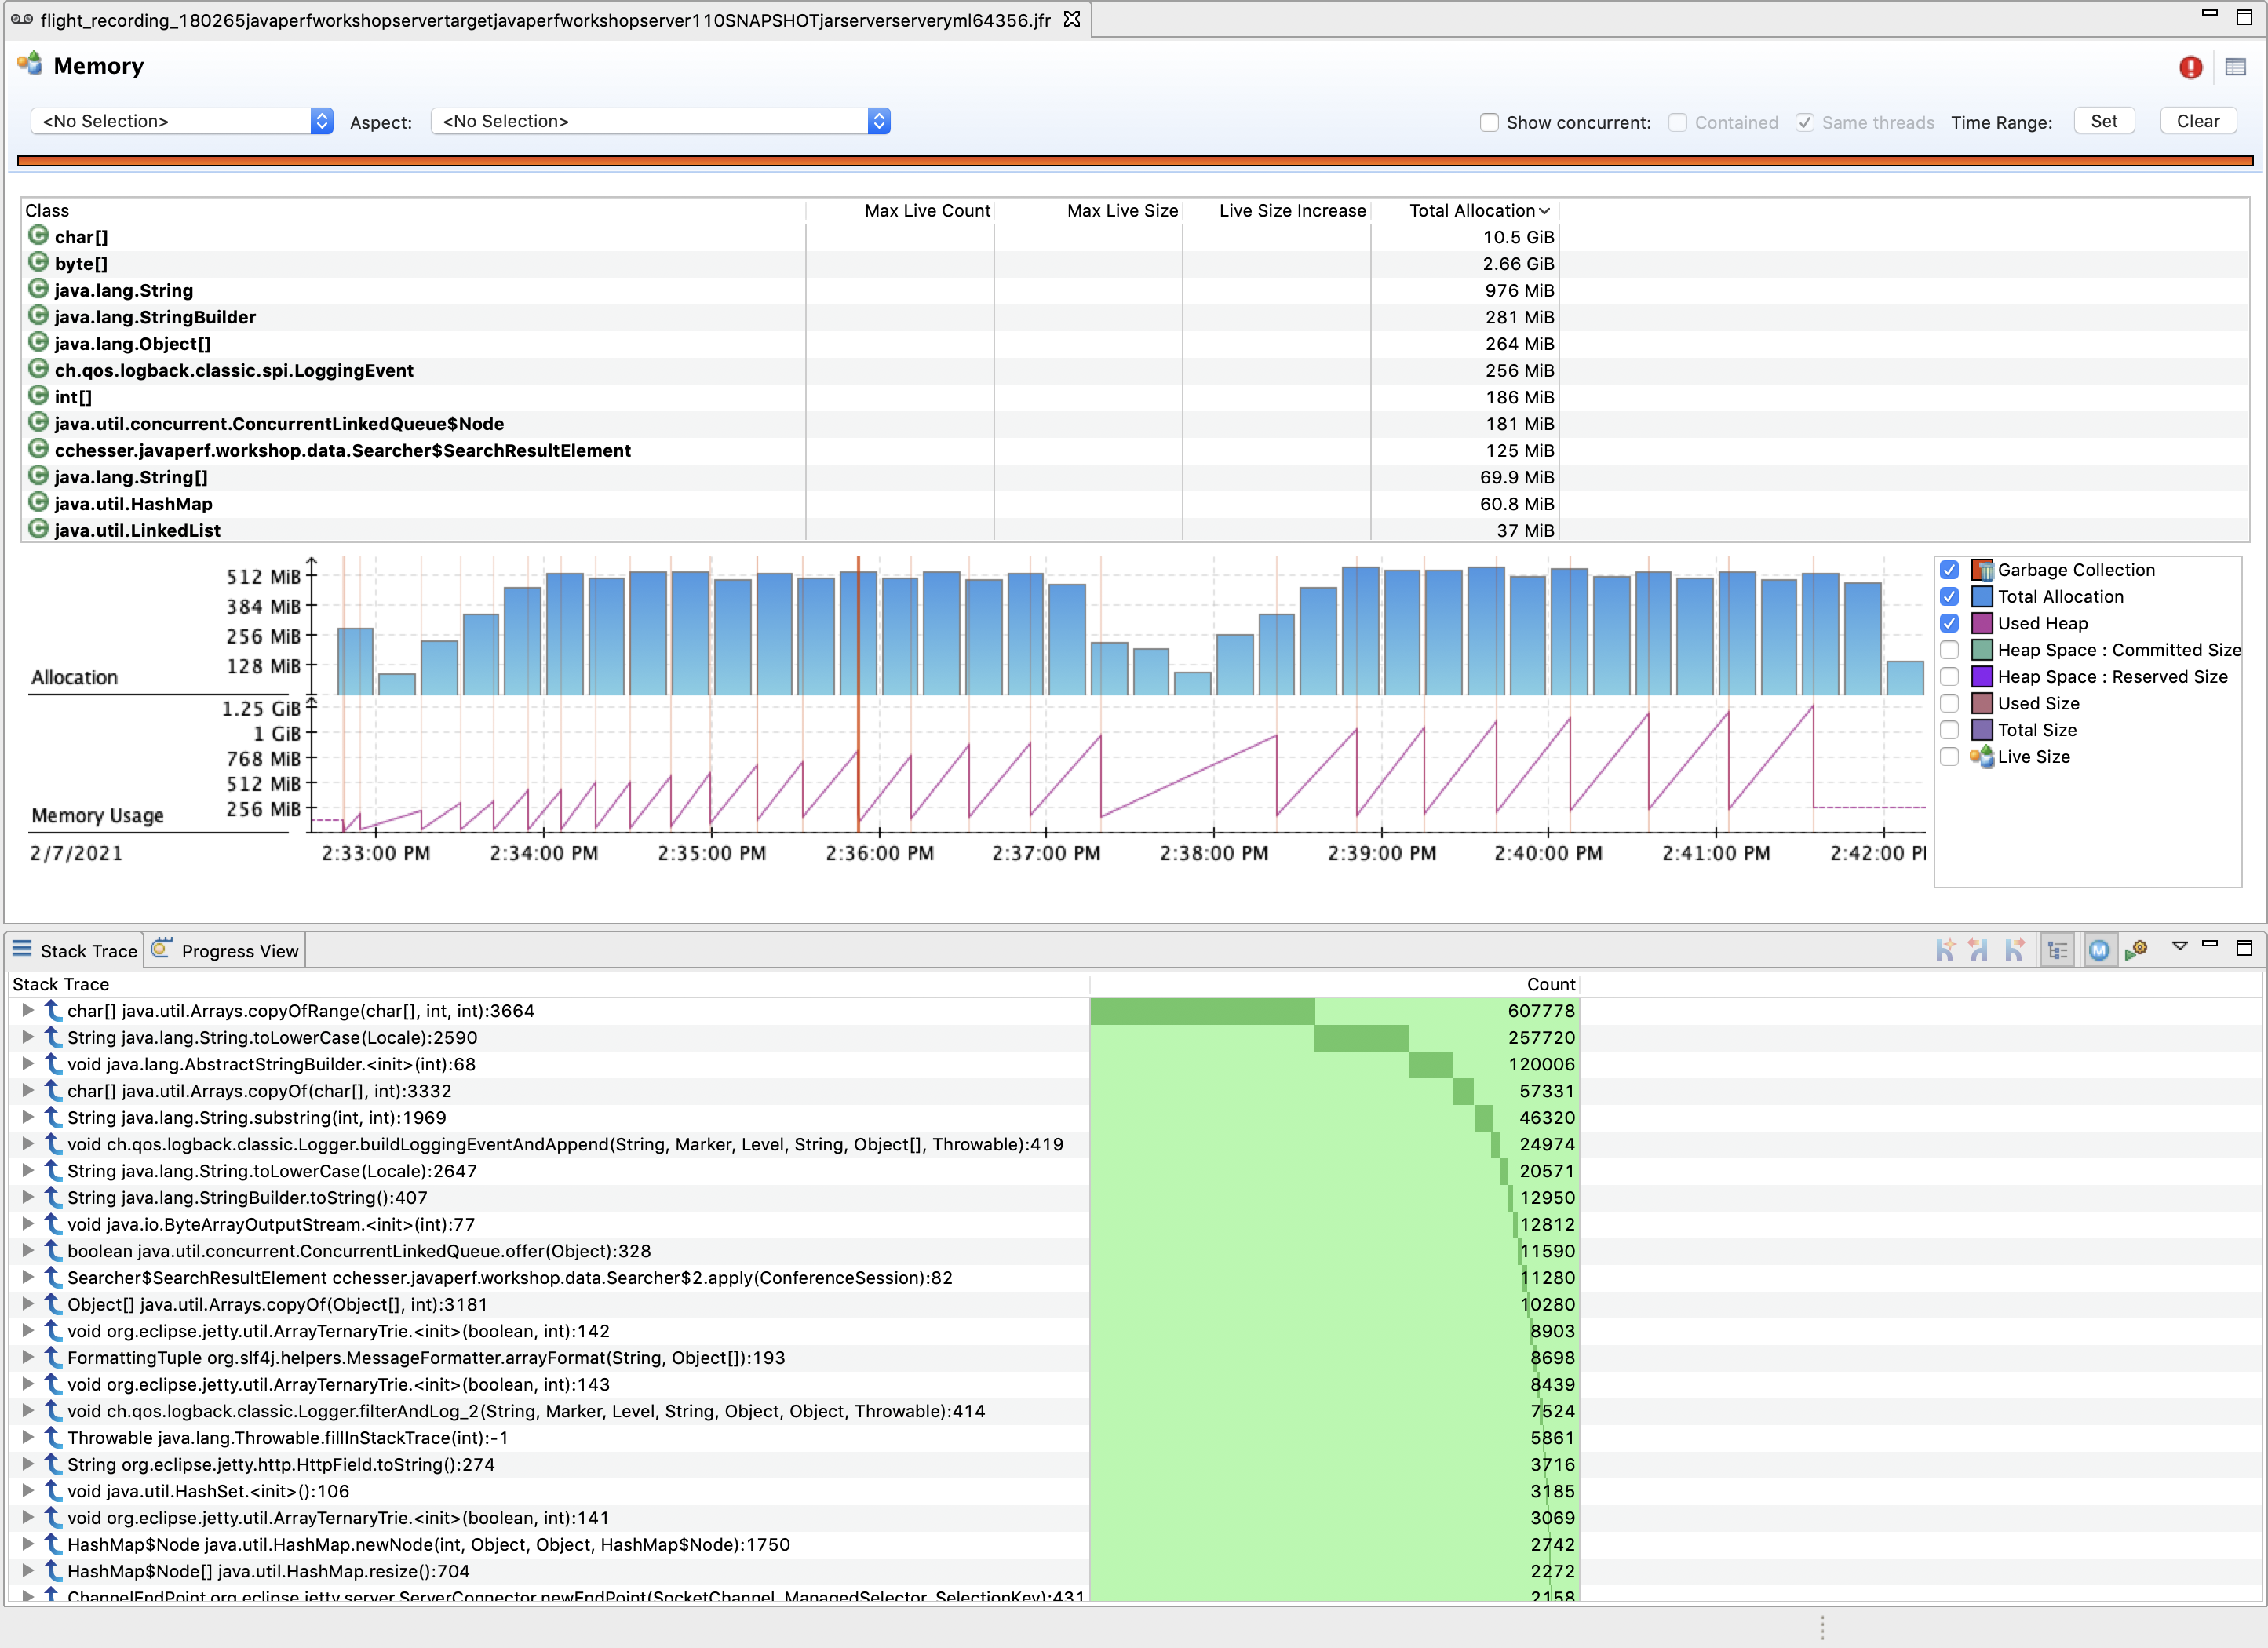
The Class Table lets us view the total memory allocation dedicated to particular instances of that class. Selecting a particular class will allow us to view what code paths are responsible for creating those objects.
We can also filter this view to a particular range in time, for example a range where we went from low to high heap usage:
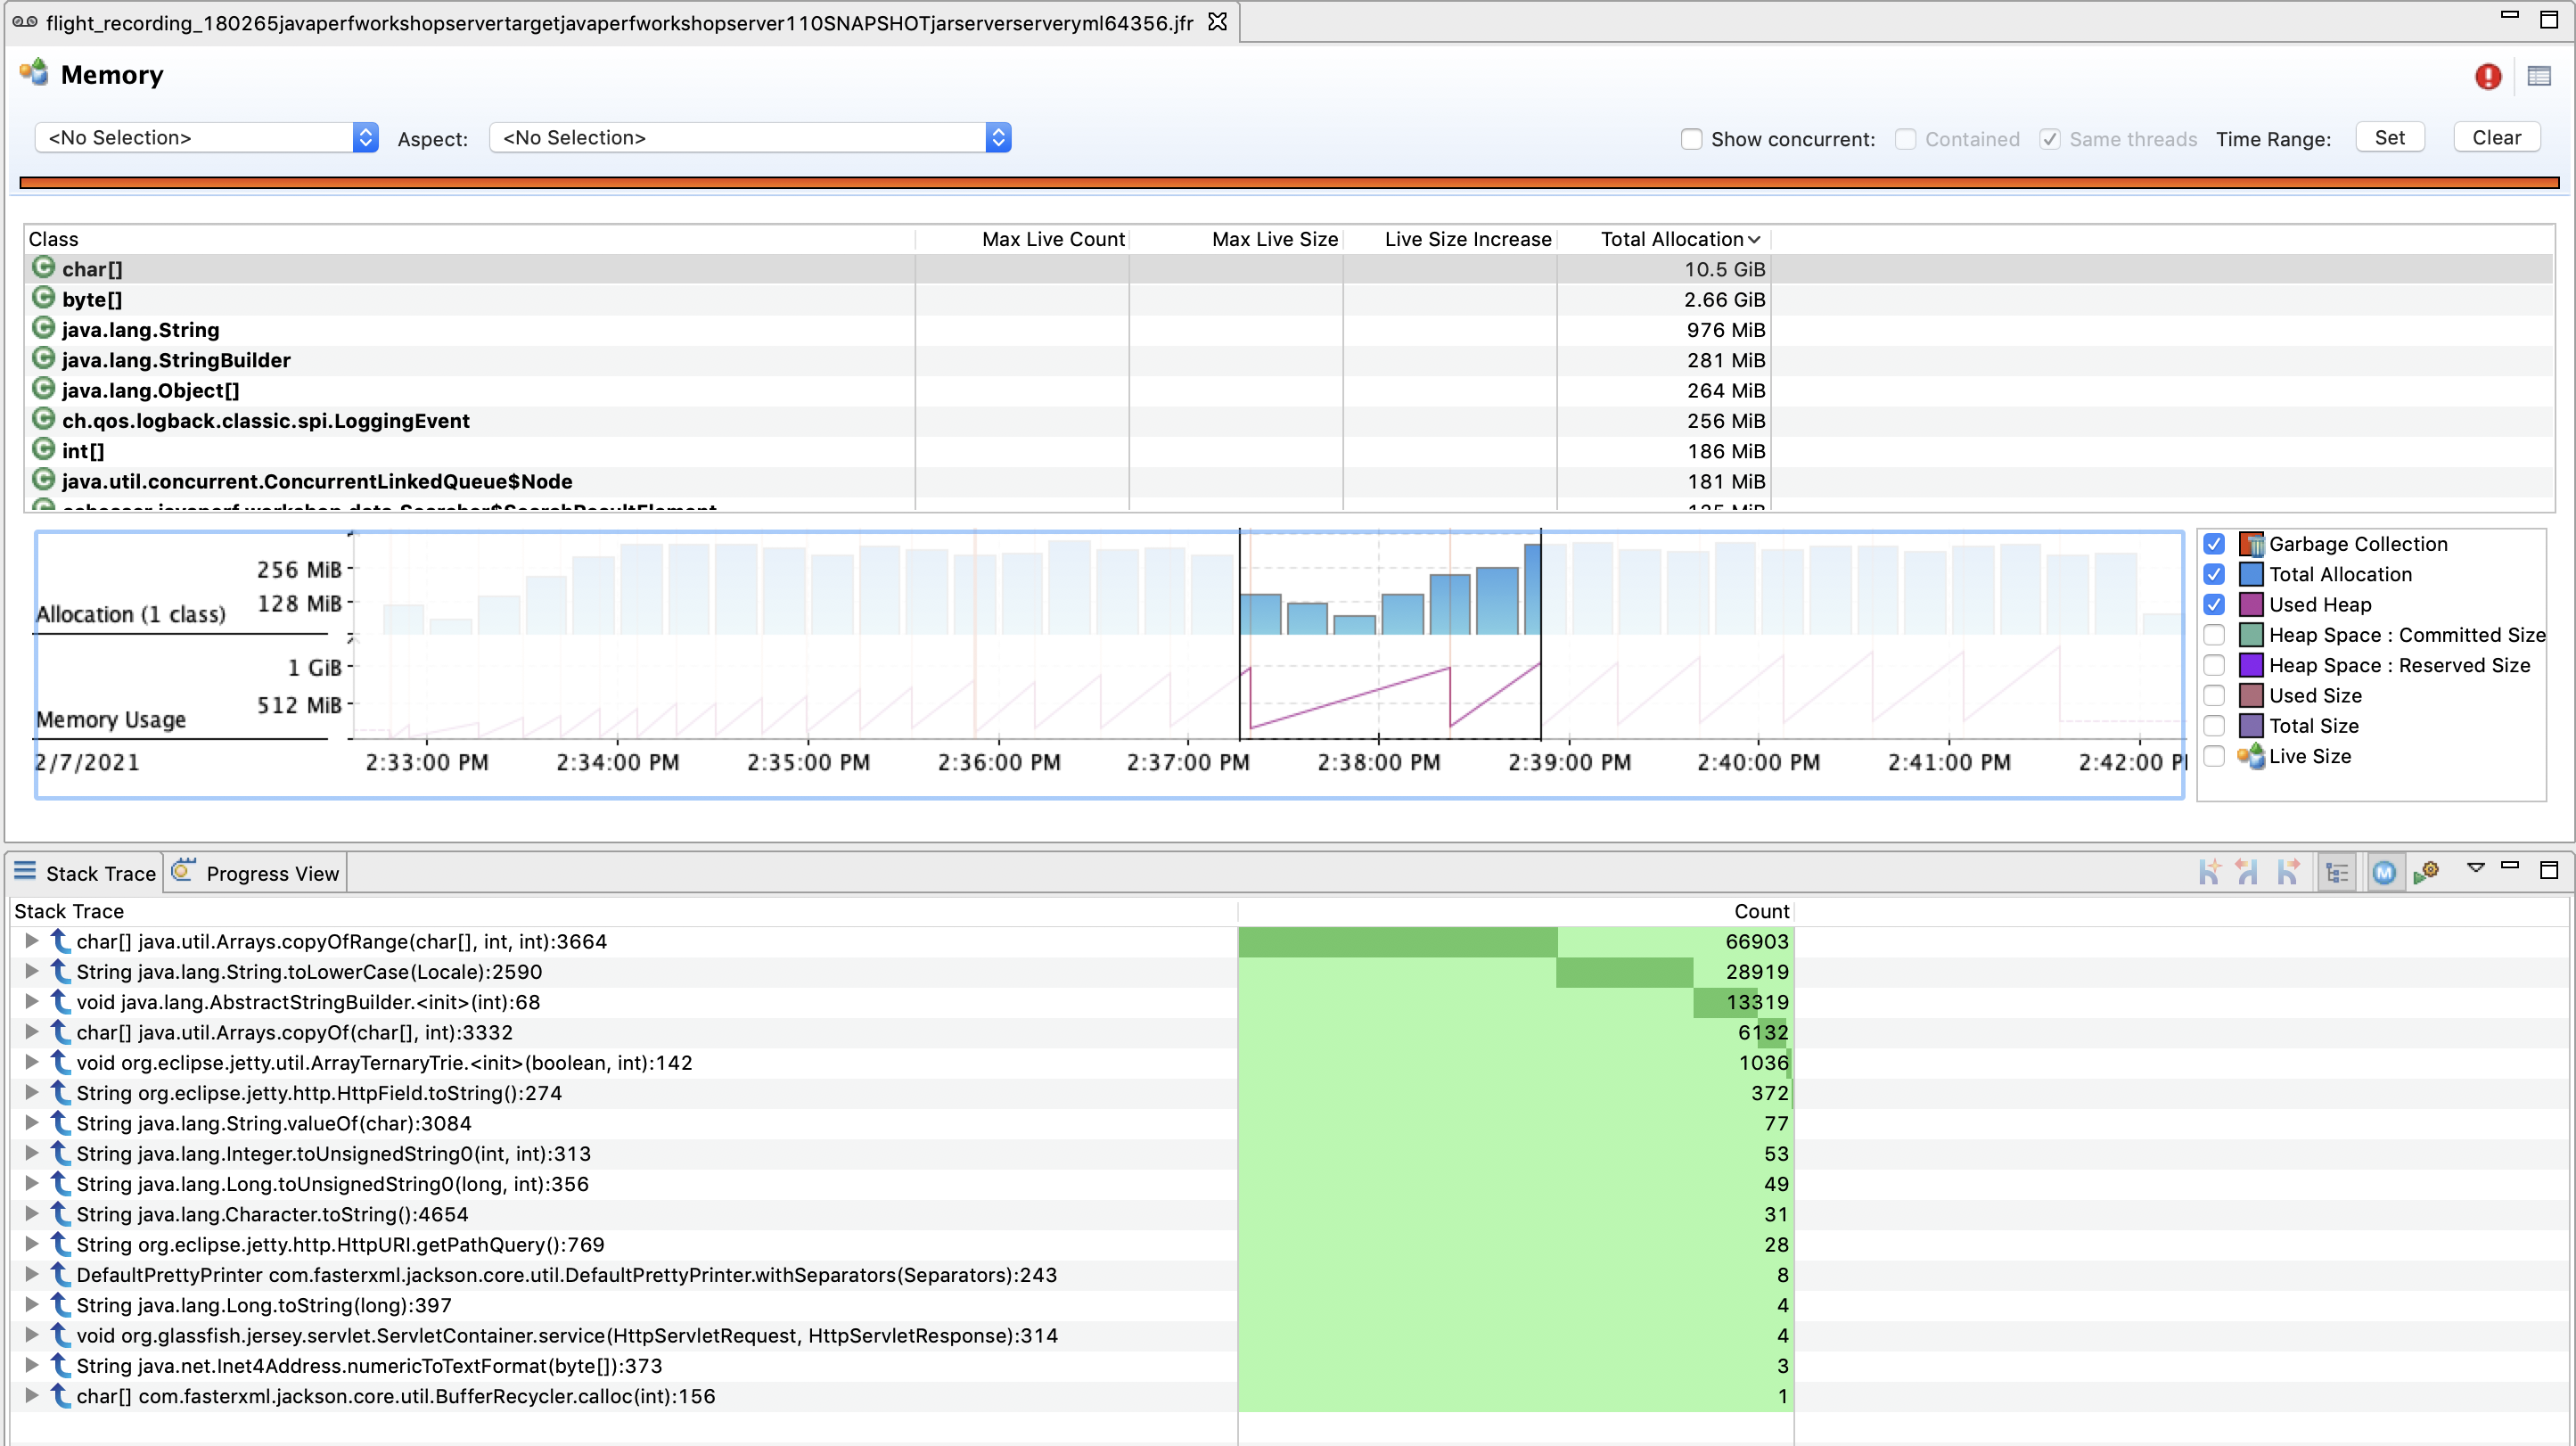
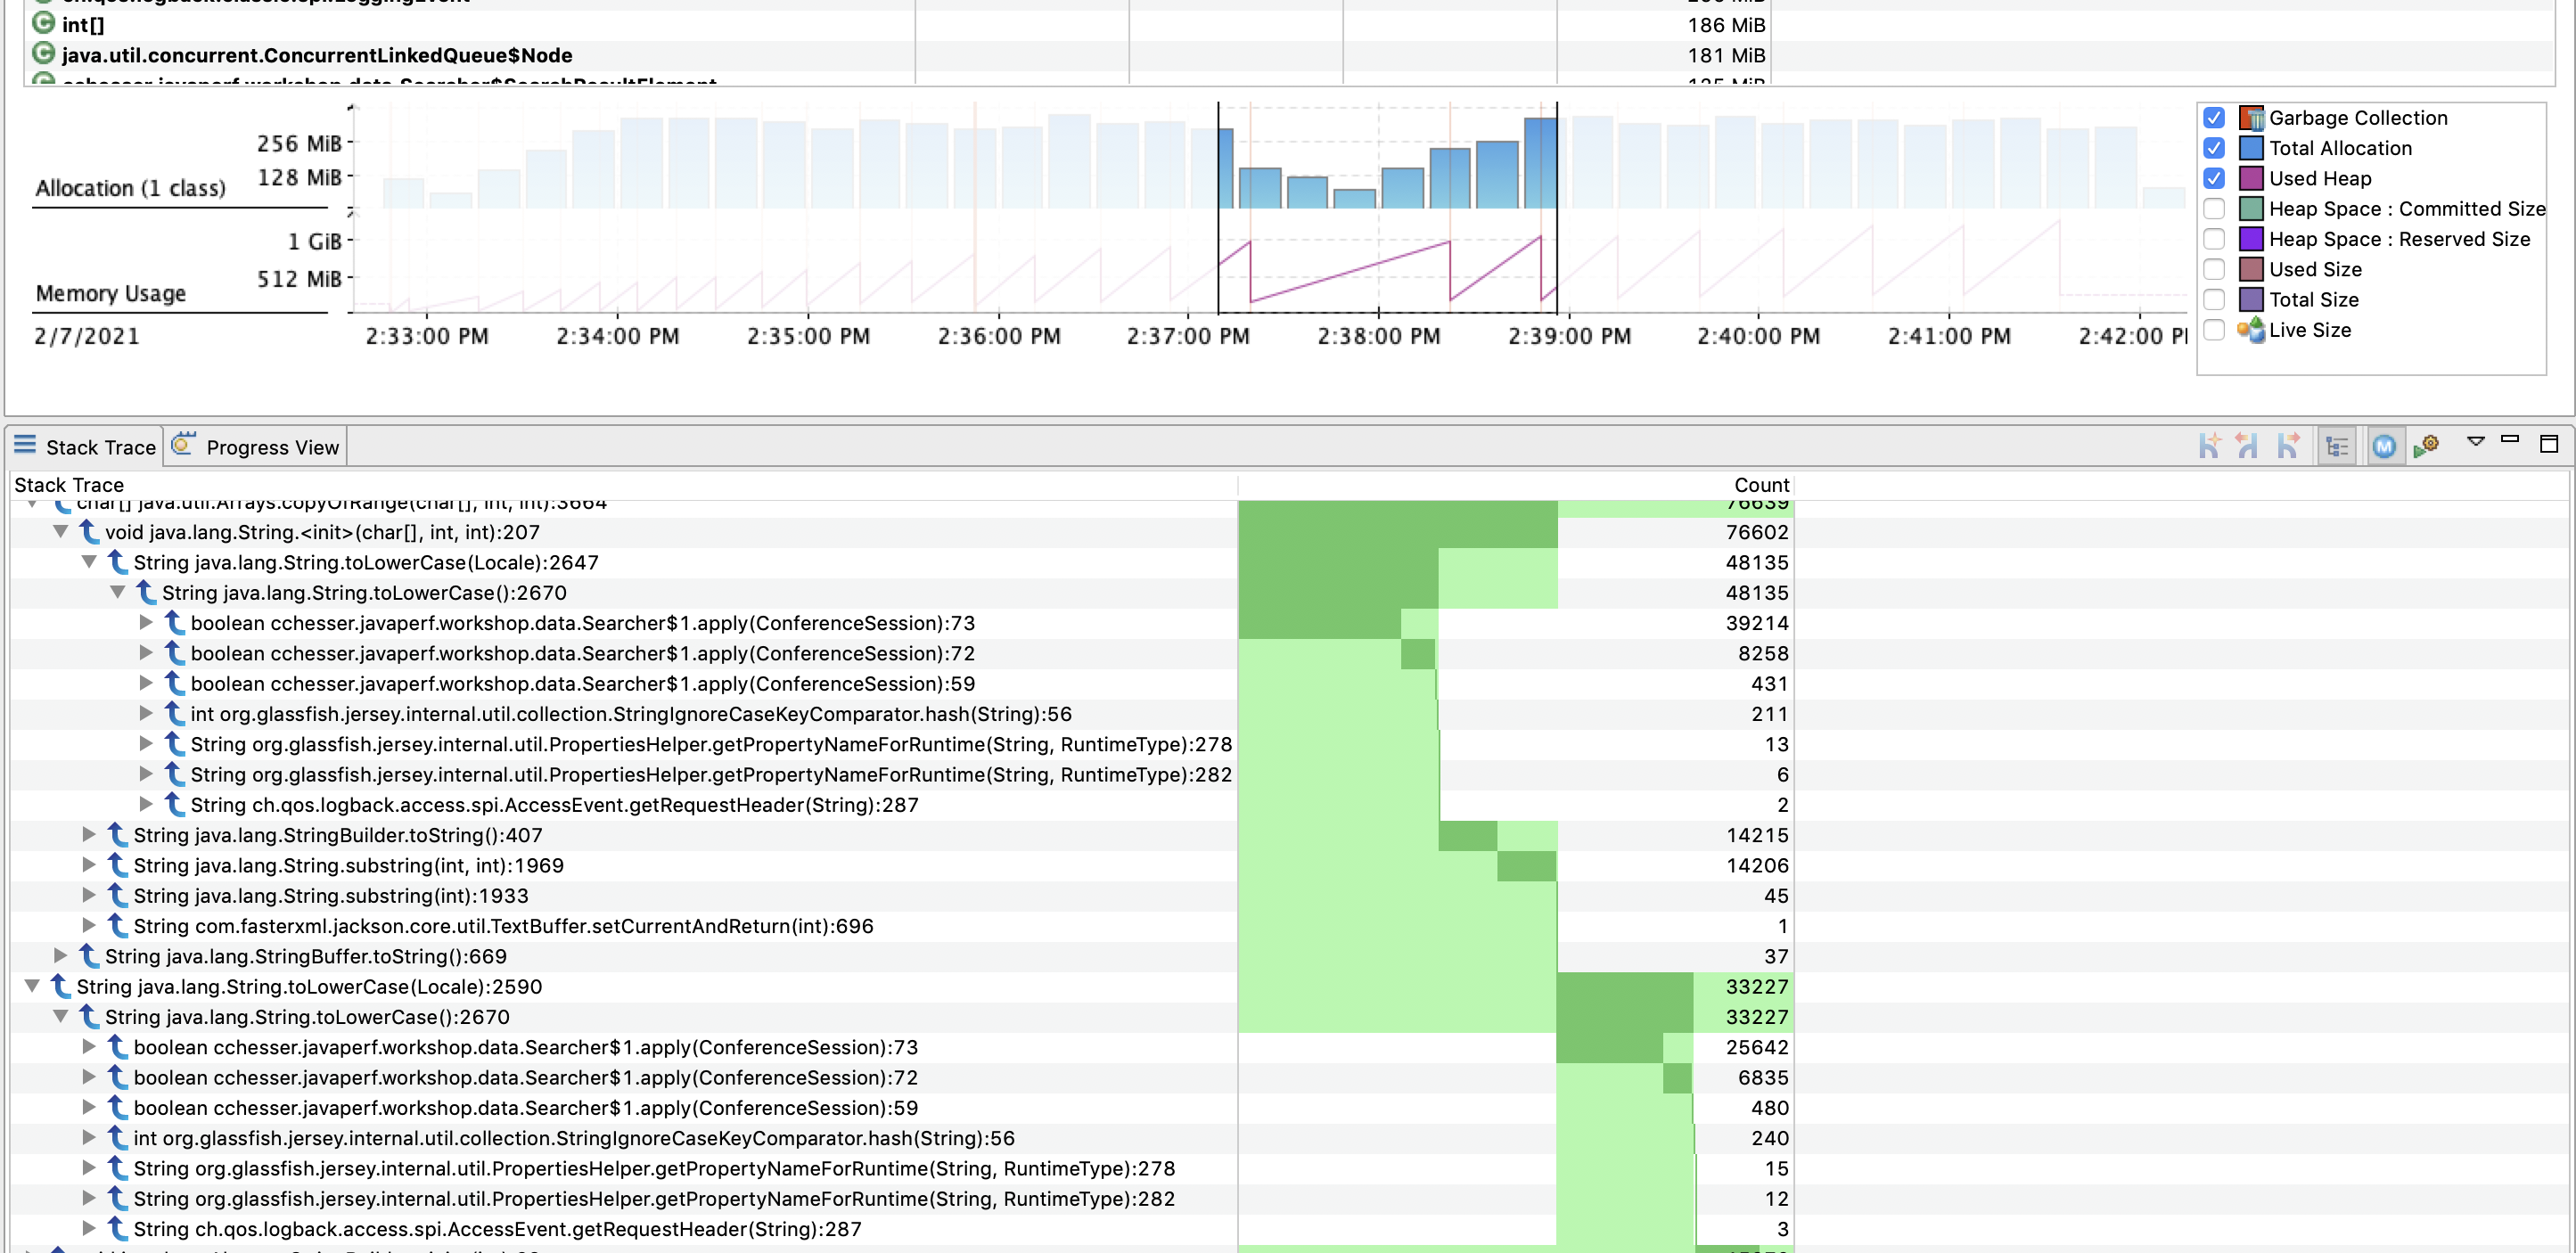
We can then use this filtered view and drill down through the stack trace to find methods of interest:
Explore
Narrow down through some periods of time where our heap rose quickly and then was collected. Look at the memory reclaimed after each collection.
Follow Ups
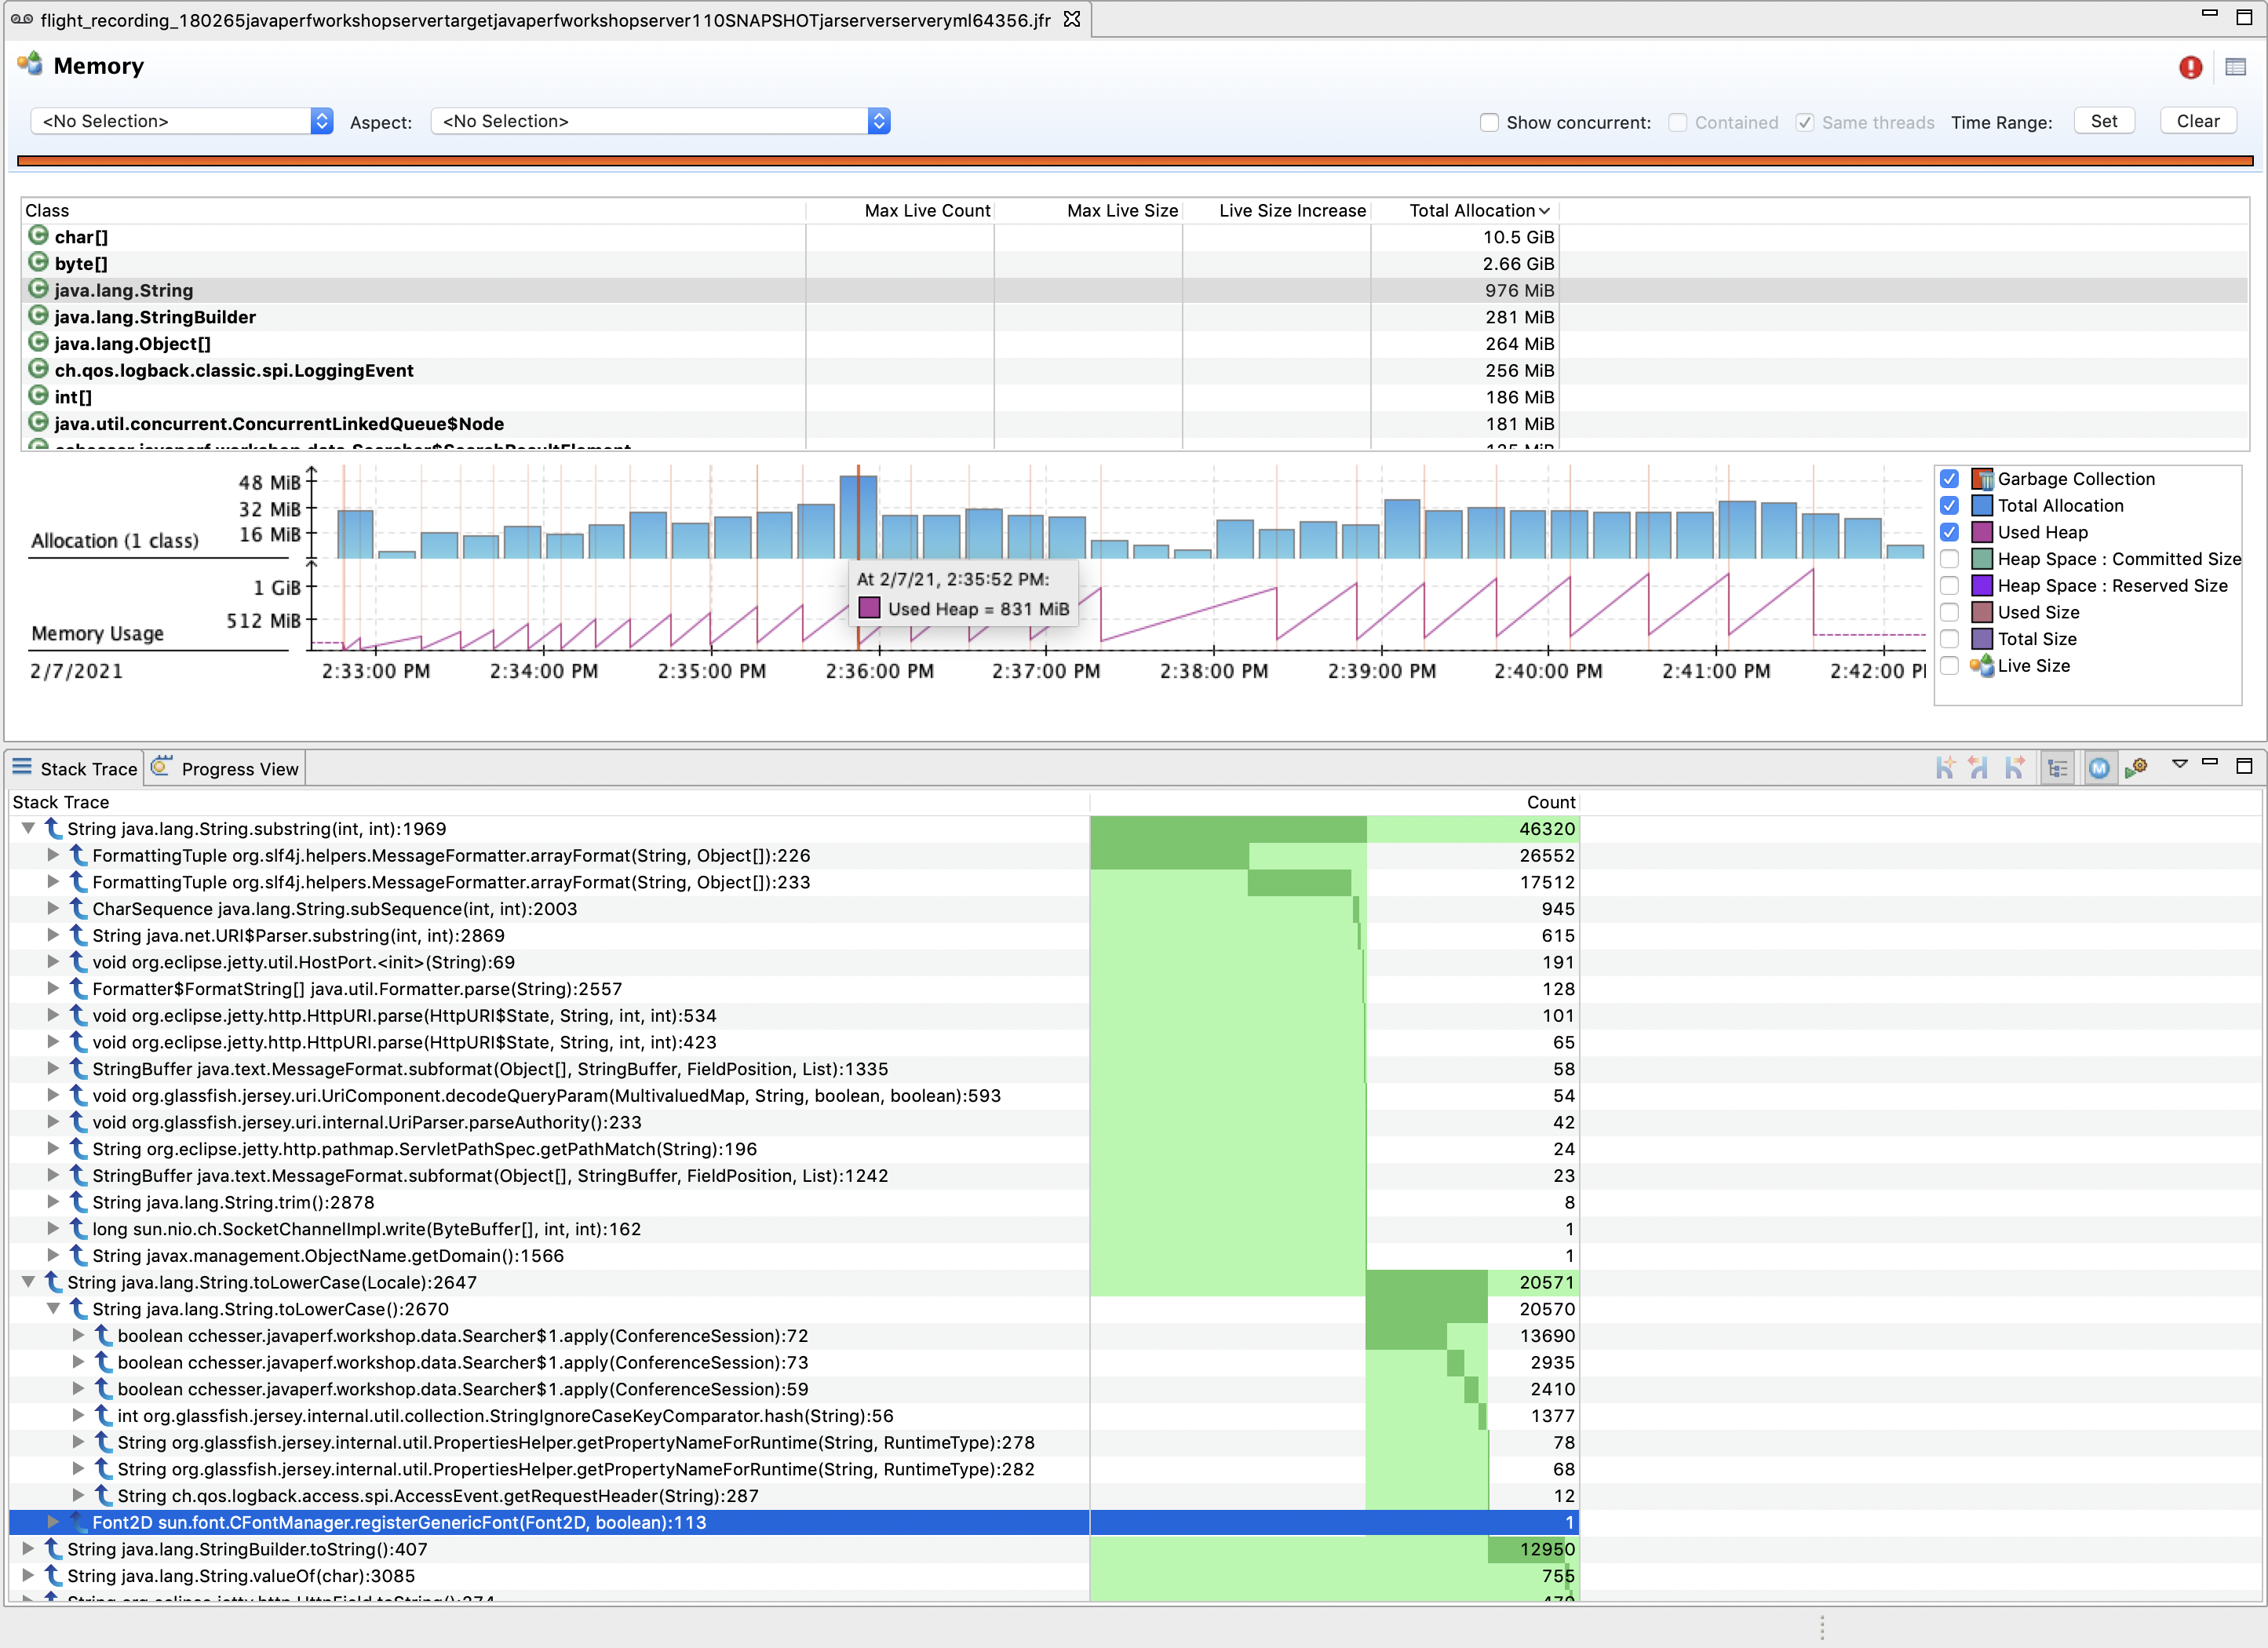
- What are the most commonly allocated classes? Where do they come from?
- Are there any classes we own that are also high on the allocation list?
- Expand the memory usage chart and only chart the Used Heap, do you notice a pattern?
- What do you think caused the flat line at the end of the chart?
In the next section, we'll look at the I/O used by our application.
I/O Operations4.6 - I/O Operations
The I/O pages can provide context of what external resources you are utilizing from you code base, and relate it to other latency events.
For the purpose of our workshop service, we are doing network I/O, and therefore will look at the Socket I/O page.
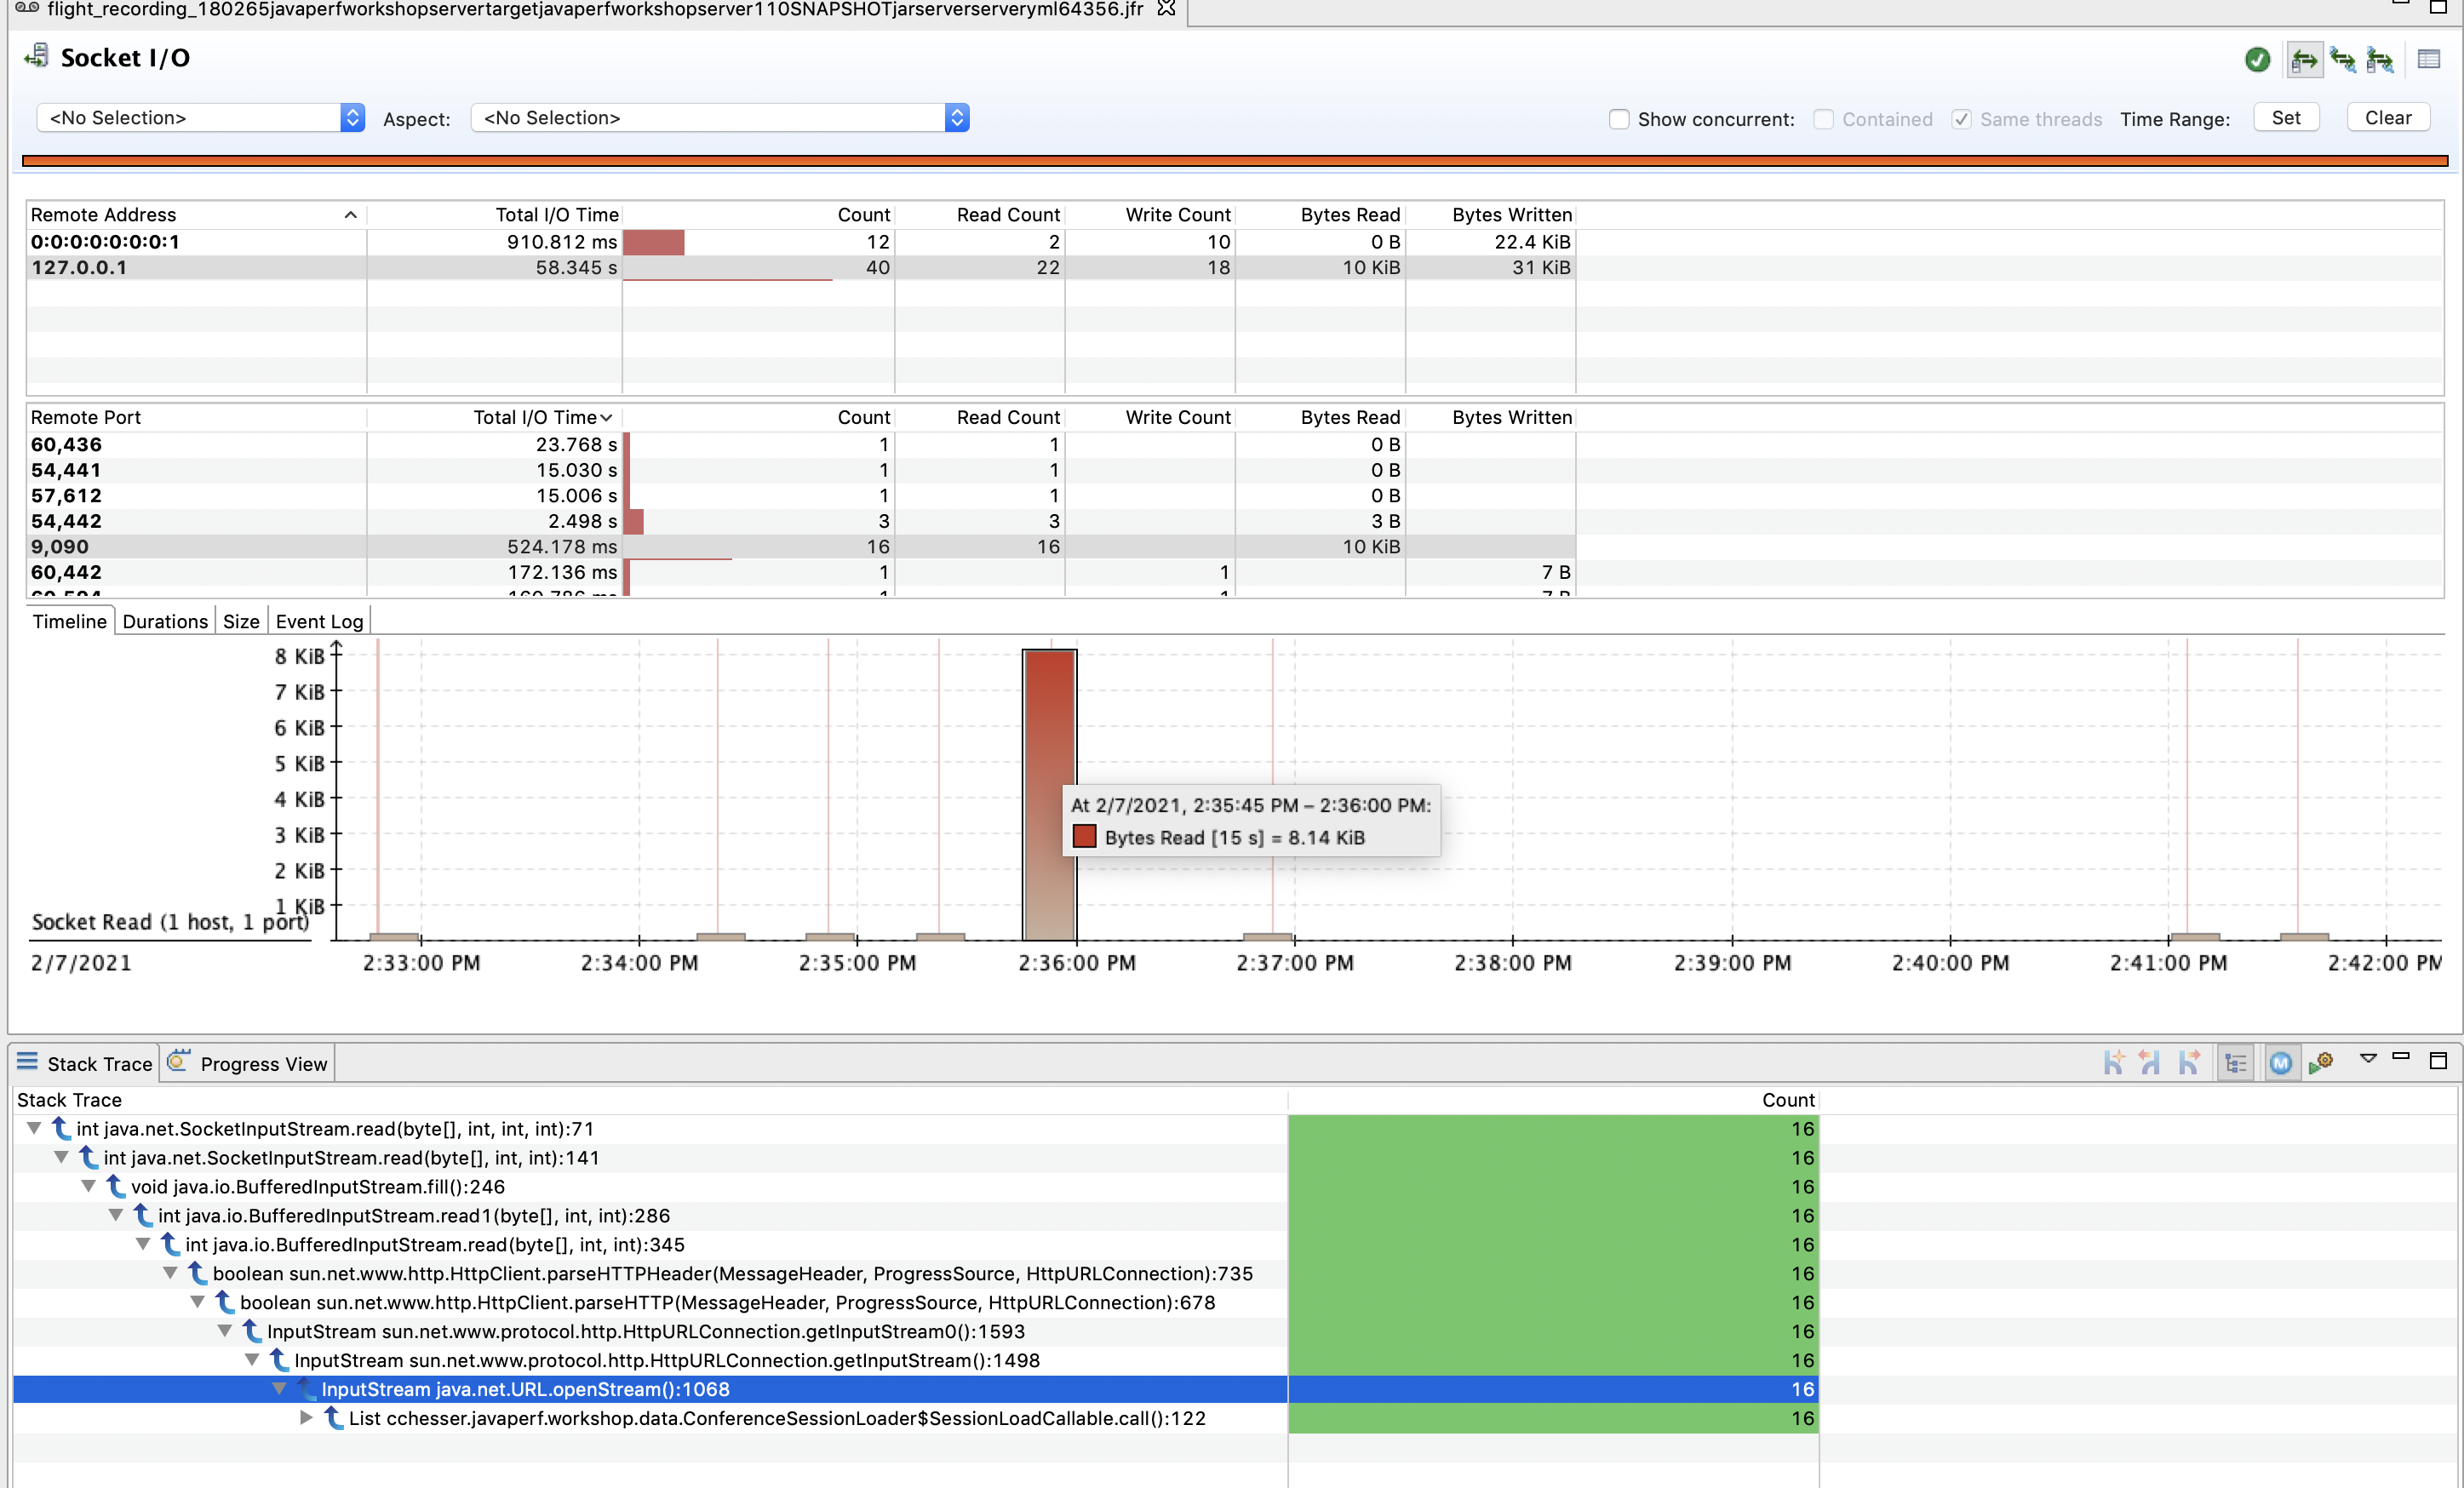
From this page, we can gain context of what host(s) we are calling, with what frequency, and the cost associated with those calls:
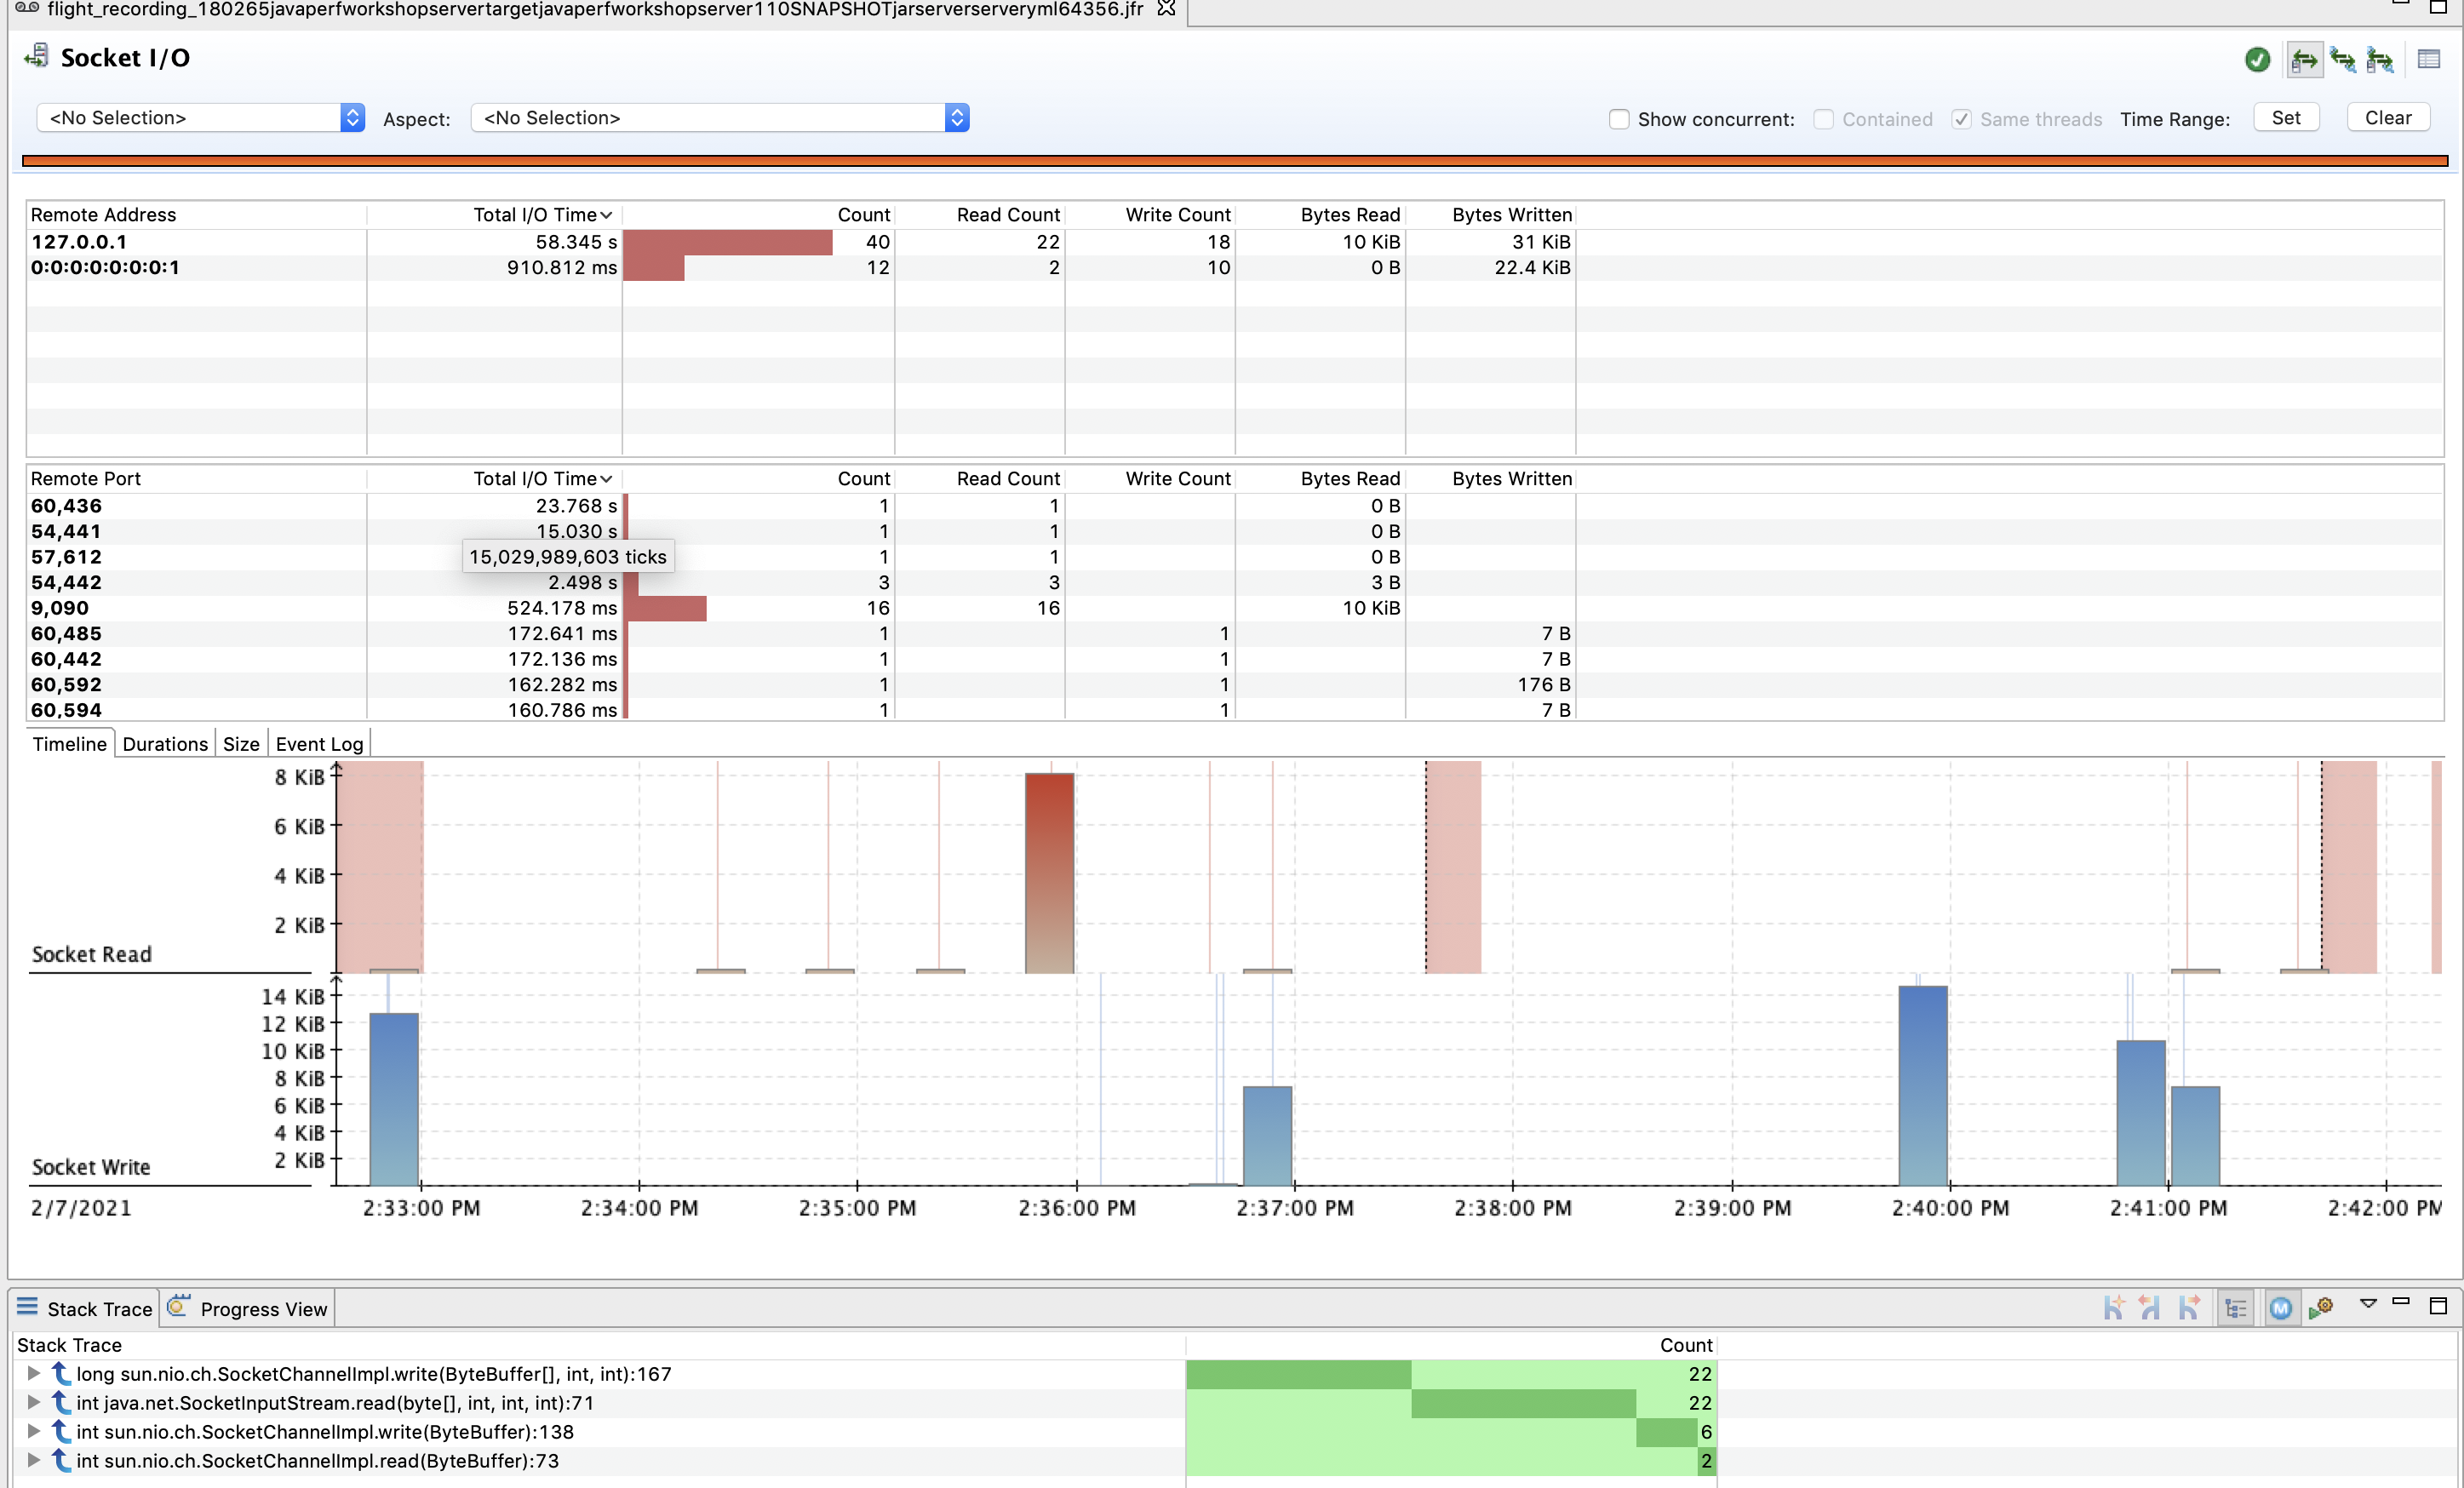
We can then filter on a particular host and port and drill down into a particular piece of code responsible for that call:
Explore
Filter through the total I/O time and explore a couple of events with high I/O.
Follow Ups
- What remote services are we interacting with?
- How long are we interacting with them and how many invocations?
- How many times did we make calls and what threads were tied to those calls?
4.7 - References
5 - Memory Analysis
5.1 - Memory Heap Analysis
In the following sections, we are going to do some analysis of the JVM’s heap dump.
Note
Make sure you’ve gone through the PrerequisitesFirst, we’ll need to capture a heap dump:
We will then go through three common tools in which we can do some analysis of a heap dump. All of which are free. :smiley:
We will then tie all our knowledge together and attempt to solve a quick challenge:
In the next section, we'll learn how to acquire a Heap Dump.
Capturing Heap Dumps5.2 - Capturing Heap Dumps
You may be aware by now, there are many different ways of getting data from the JVM. Here are just a few ways to get heap dump of the JVM.
jcmd
With jcmd, you have the ability to invoke the GC.heap_dump command. This requires that you
are running as the same OS user as the target JVM process.
jcmd <PID> GC.heap_dump my_little_heap_dump.hprof
Note: If a full path is not specified, the heap_dump will be created relative to the location from where the process was started (when generated with jcmd)
jmap
A more traditional approach is using jmap and invoking the command on the target process.
jmap -dump:format=b,file=my_little_heap_dump.hprof <PID>
Core Dump
You can also use jmap to extract a heap dump from a core dump on the process:
sudo gdb --pid=<PID>
gcore /tmp/jvm.core
detach
quit
jmap -dump:format=b,file=my_little_heap_dump.hprof /usr/bin/java /tmp/jvm.core
💡 Capturing a heap dump from a core dump on Java 8, you may run into this issue: JDK-8073606.
HotSpot Diagnostic MBean
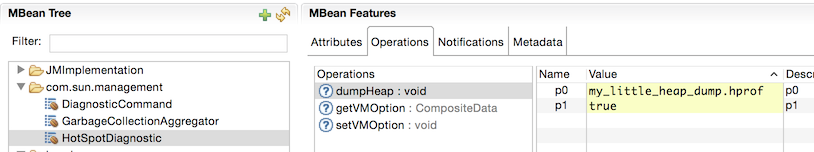
You can capture a heap dump by invoking a diagnostic MBean which is included in the Oracle JDK. You can do so by opening your favorite MBean browser (ex. jconsole, jmc) and invoke
the com.sun.management.HotSpotDiagnostic. The arguments are:
- Filename of the heap dump that will be created. 💡 Note, it will be created with file ownership of the hosting JVM process.
- Indicator to dump all live object (true will dump only live objects)
In the next section, we'll start analyzing our heap dump with JOverflow.
JOverflow5.3 - JOverflow
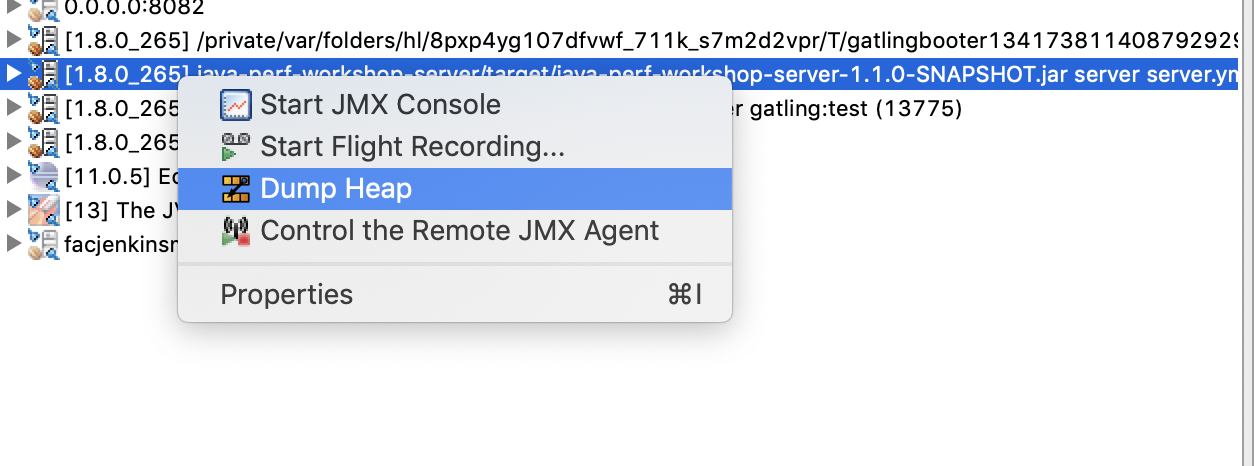
Included in JDK Mission Control is a plugin that used to be a separate instance, the JOverflow Heap Analyzer. This plugin now adds a context menu selection to Dump Heap of JVMs from the JVM Browser.
JOverflow is a great tool to start our analysis with since it is tailored to identifying common anti-patterns present in most heap dumps. This should give us an idea of the kinds of problems we can see in our JVMs.
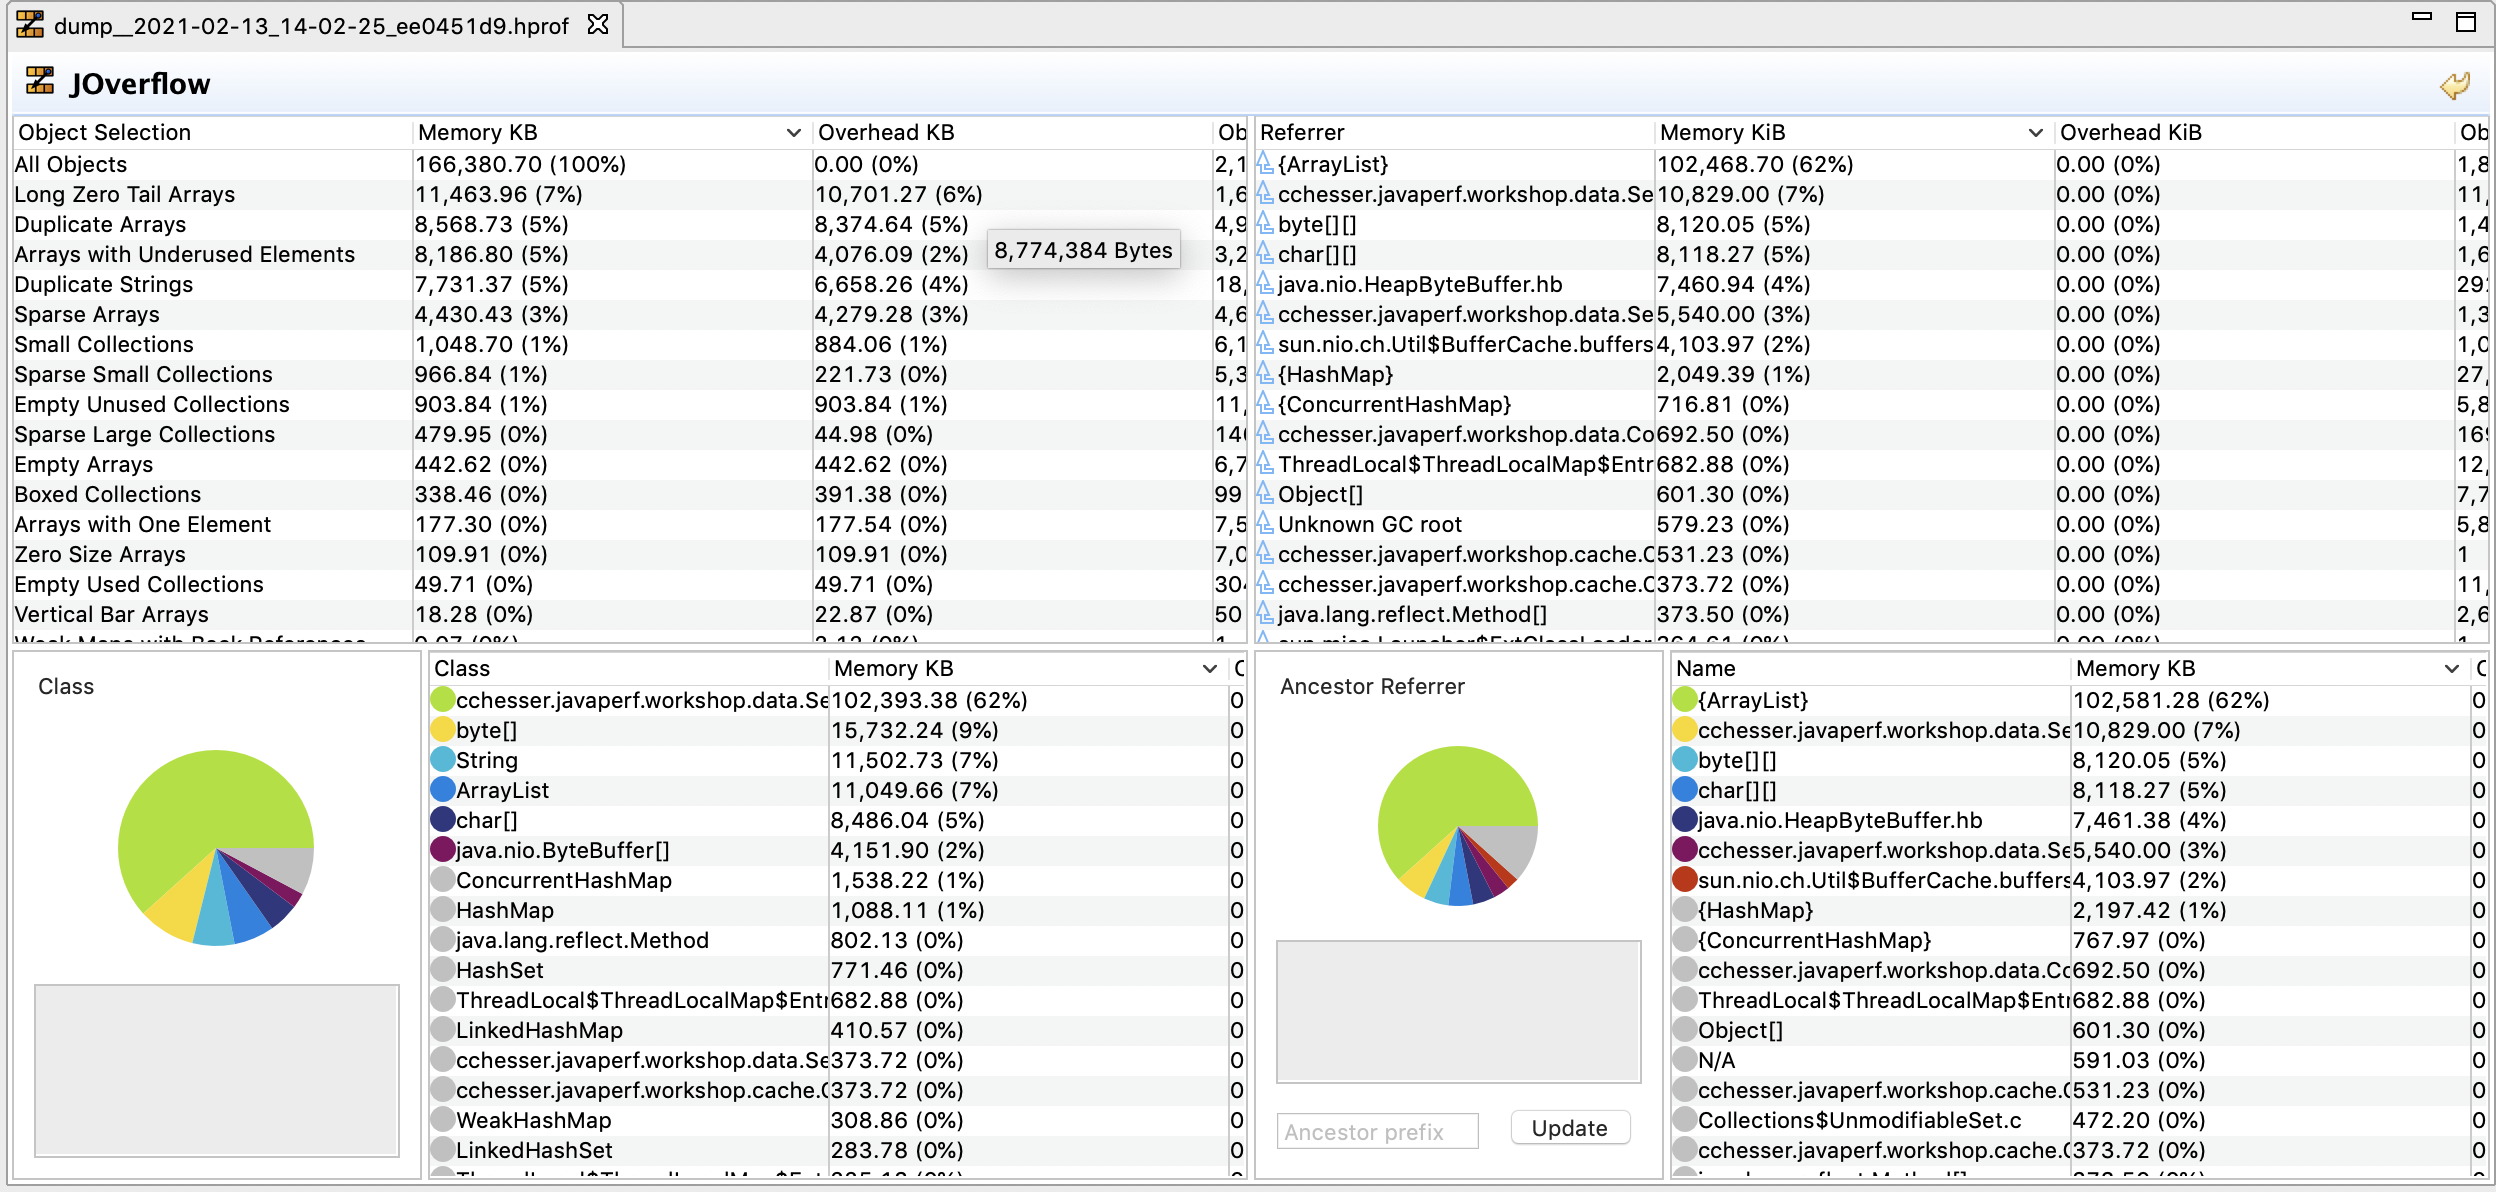
Anti-Patterns
Here is a listing of some the patterns that JOverflow identifies:
- Empty Unused Collections: Empty collection, where modification
count == 0. - Empty Used Collections: Empty collection, where modification
count != 0. - Small Sparse: Only for array-based, where less than half the slots are occupied. Small is considered: size <= default (ex. 16 for HashMap).
- Large Sparse: Only for array-based, where less than half the slots are occupied. Large is considered: Size > default.
- Boxed: Contains boxed Numbers (ex. java.lang.Integer). Each of these boxed number has overhead as compared to their primitive counterpart due to object references.
- Small Collections: Collections with 1 to 4 elements. There are fixed costs of collections, which may lend this set of data better hosted in an array vs. a full Java collection type.
- Vertical Bar Collections: Collection which is a list of lists, where the outer collection is large, and it’s elements are all small collections (ex. List(1000) of List(100))
- Zero Size Arrays: Array where length == 0 (still consumers 12 - 16 bytes).
- Vertical Bar Arrays: Similar to Vertical Bar Collections, but for arrays.
- Sparse Arrays: Less than half of the elements are not null.
- Long Zero Tail Arrays: Ends with a consecutive series of zeros, where the tail length is >= size / 2.
- Empty Arrays: Only null elements.
- Duplicate Arrays: Where an array contents are the same in another instance, but they are separate array instances.
- Duplicate Strings: Same as Duplicate Array, where
string1.equals(string2)andstring1 != string2.
Reference: JOverflow: Advanced Heap Analysis in JDK Mission Control
Filtering
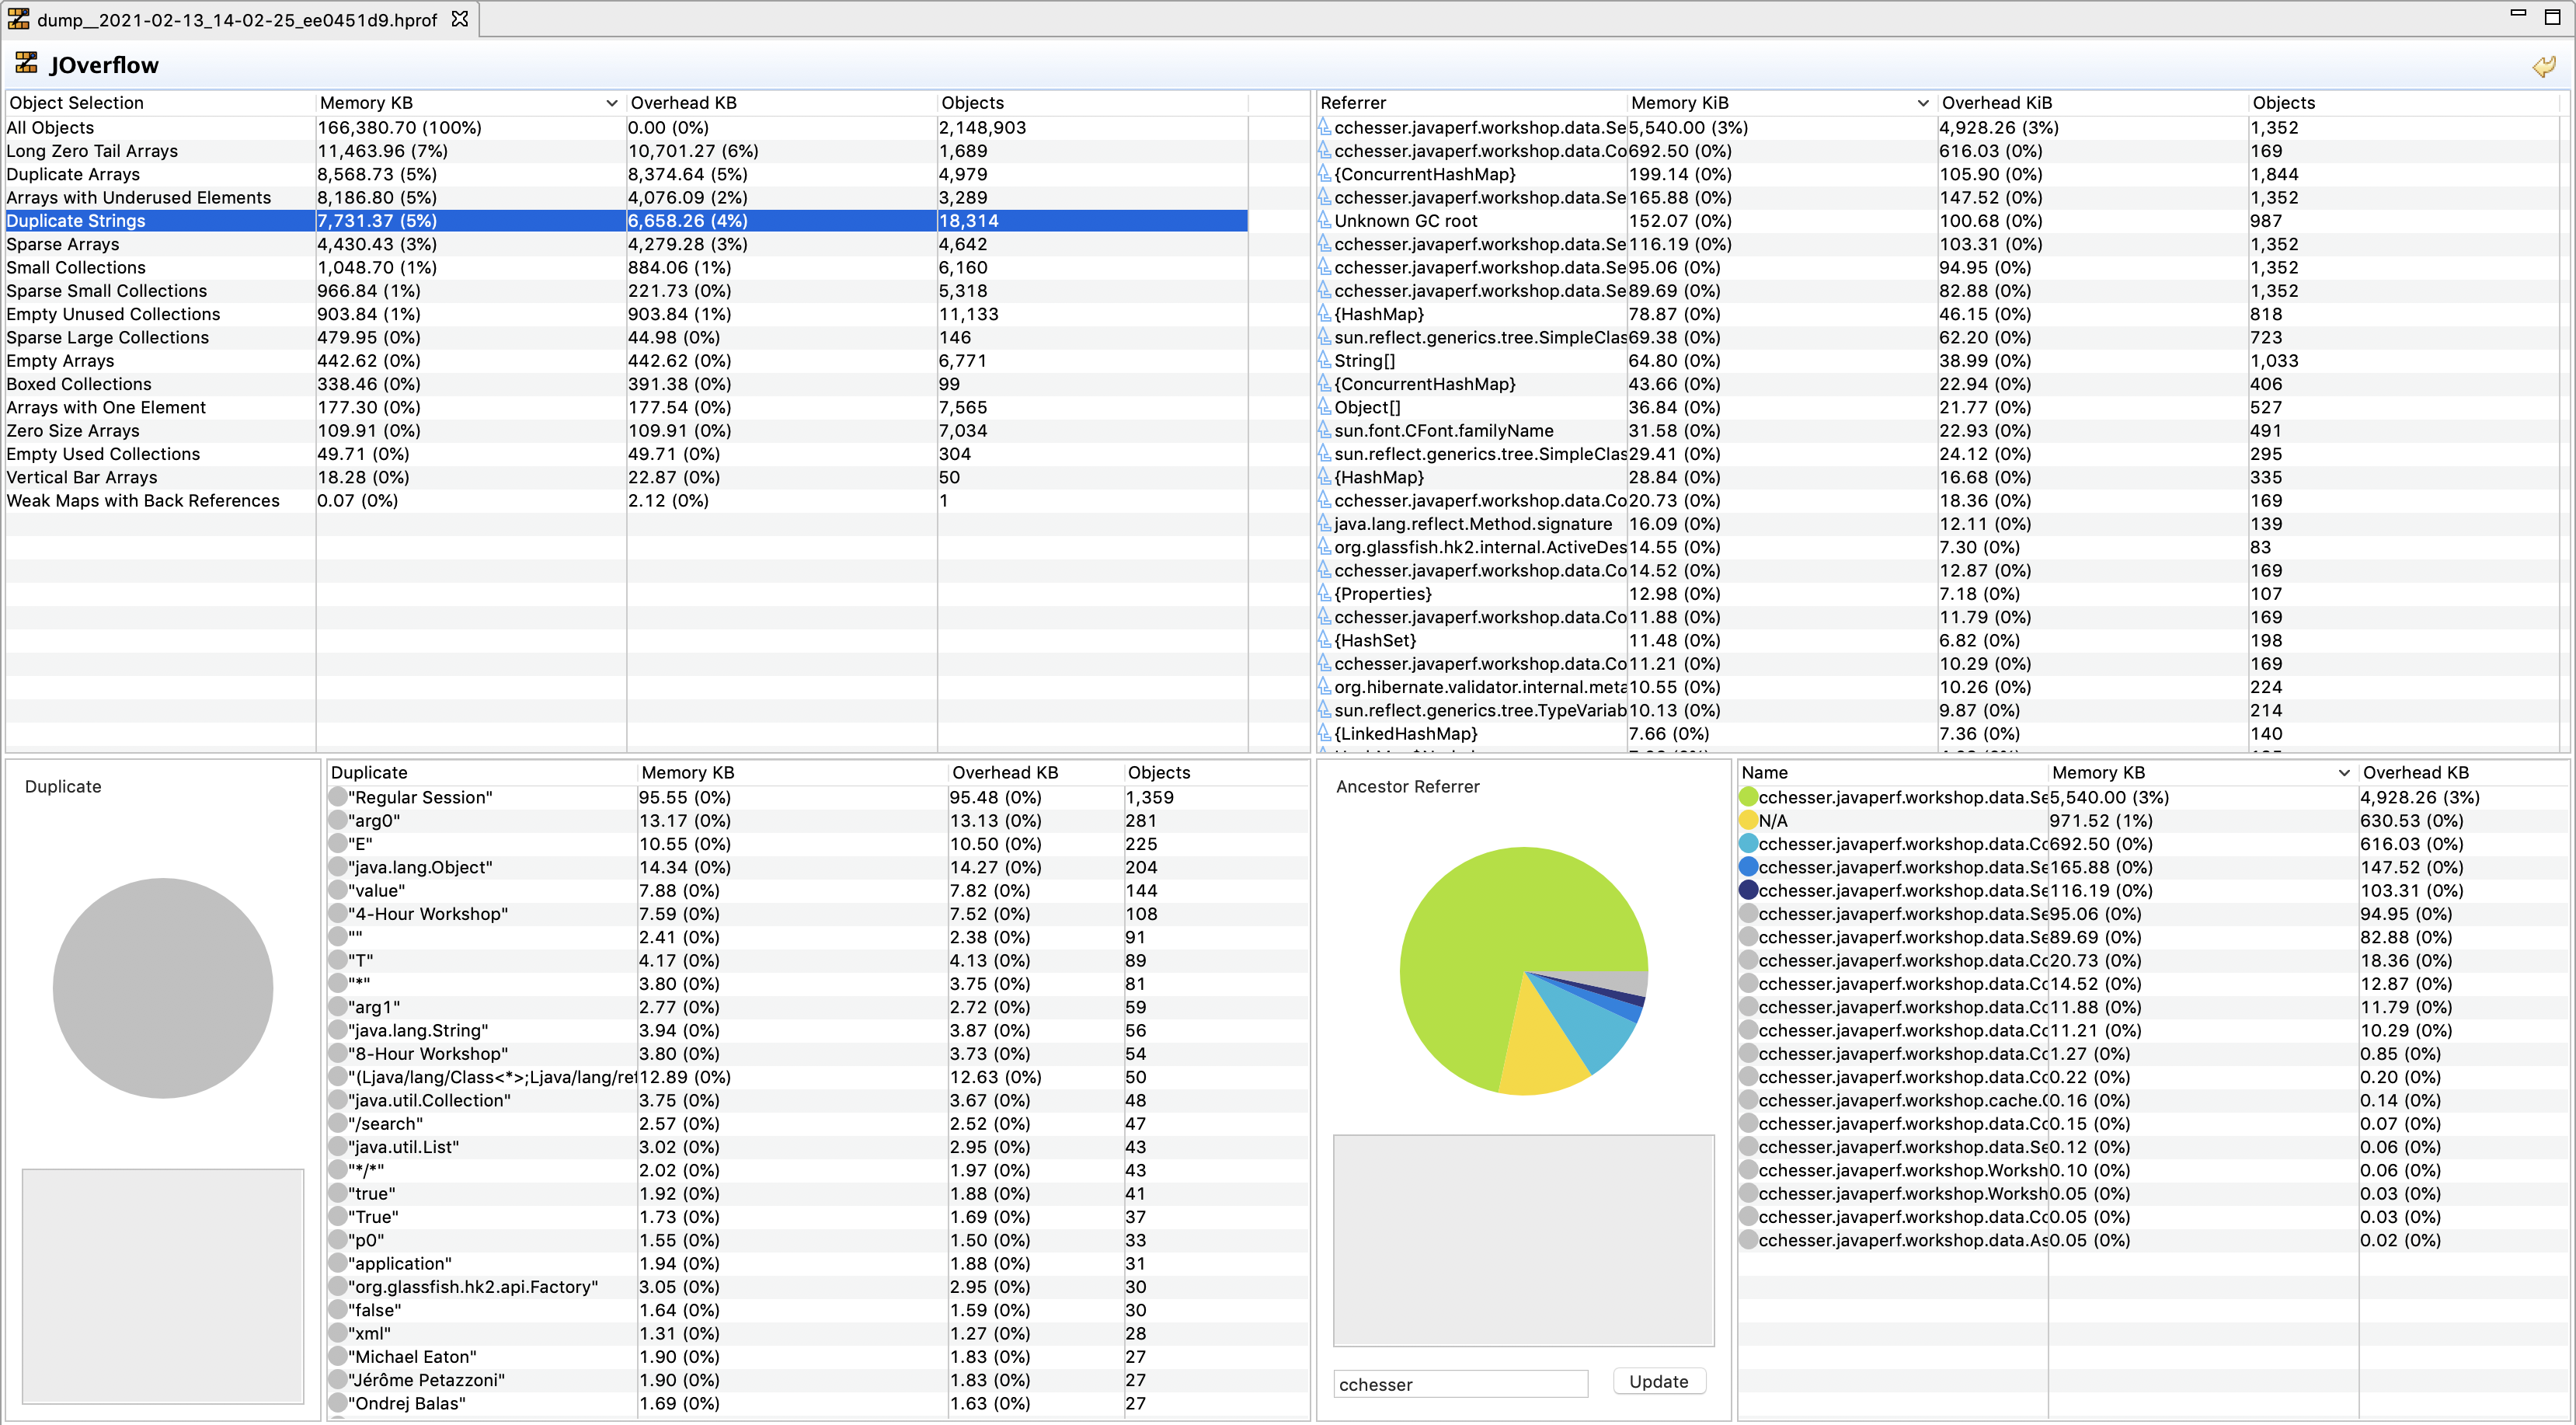
As you play with JOverflow, once you click on something, it will begin filtering down your content. If you wish to reduce down to code that you may own, you can start doing a package filter on the ancestor section.
In this example, I want to see duplicate strings for code under cchesser. In this case, I can see that our workshop service has several duplicate
strings (as this content is replicated on each object):
- Regular Session
- 4-Hour Workshop
- 8-Hour Workshop
However, the number of instances / overhead is extremely low (since this is a small service), it gives you visibility of areas that you could optimize.
Navigating
Since JOverflow’s mechanism of drilling down is by applying filters, it doesn’t have an easy way to undo most operations, and instead relies on resetting the state to the unfiltered state. You can undo all operations by using the backwards arrow button:

Instances
We can also use the plugin to drill down a bit into particular instances.
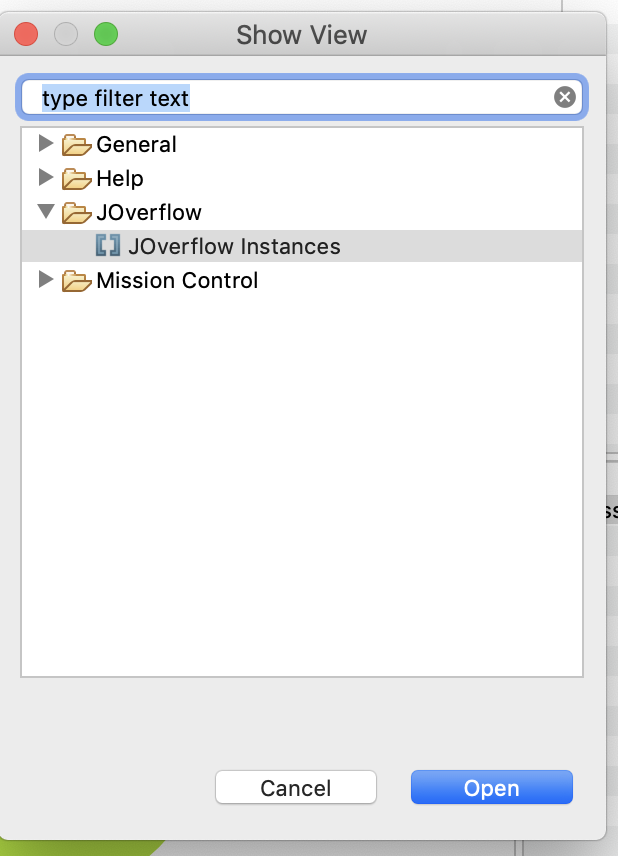
We can enable the instances view by navigating to:
- Window > Show View > Other
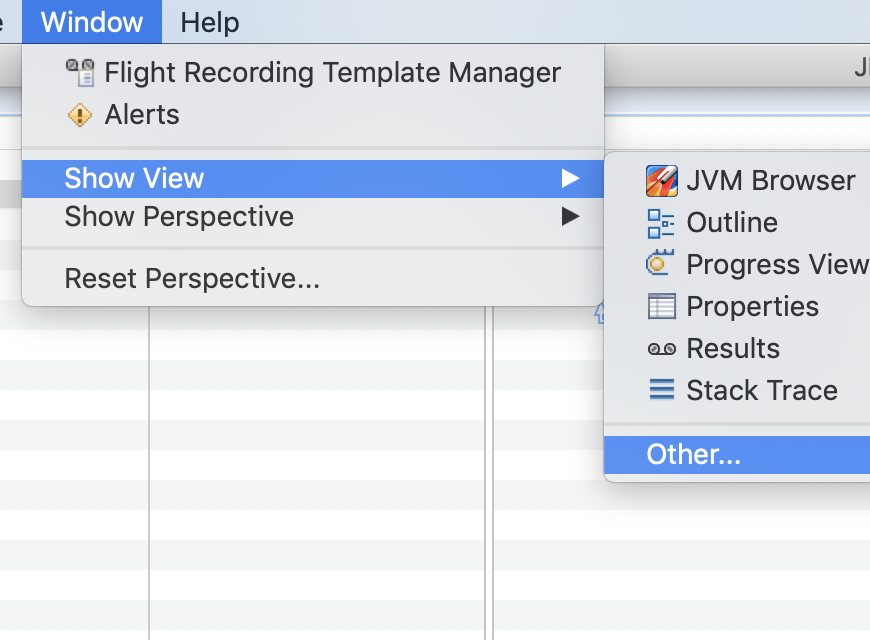
- Selecting JOverflow Instances
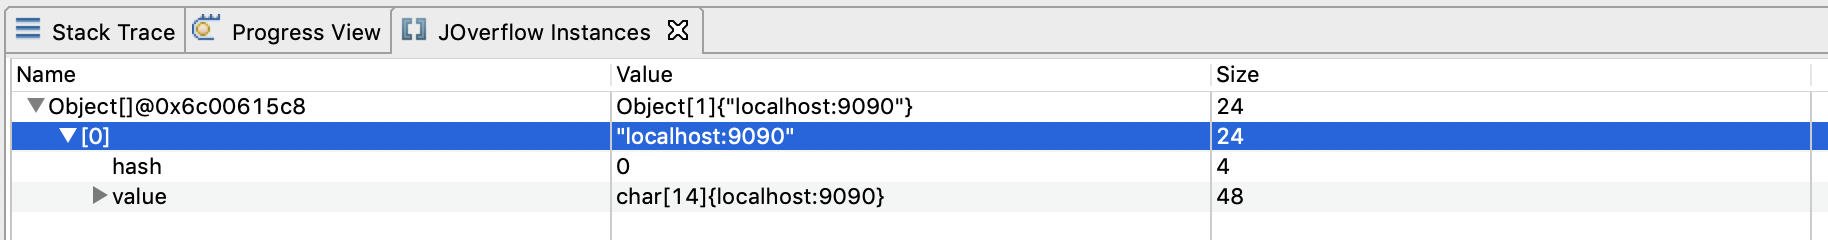
Example - Arrays Size 1
In the following example, we’re going to find:
- Arrays with One Element
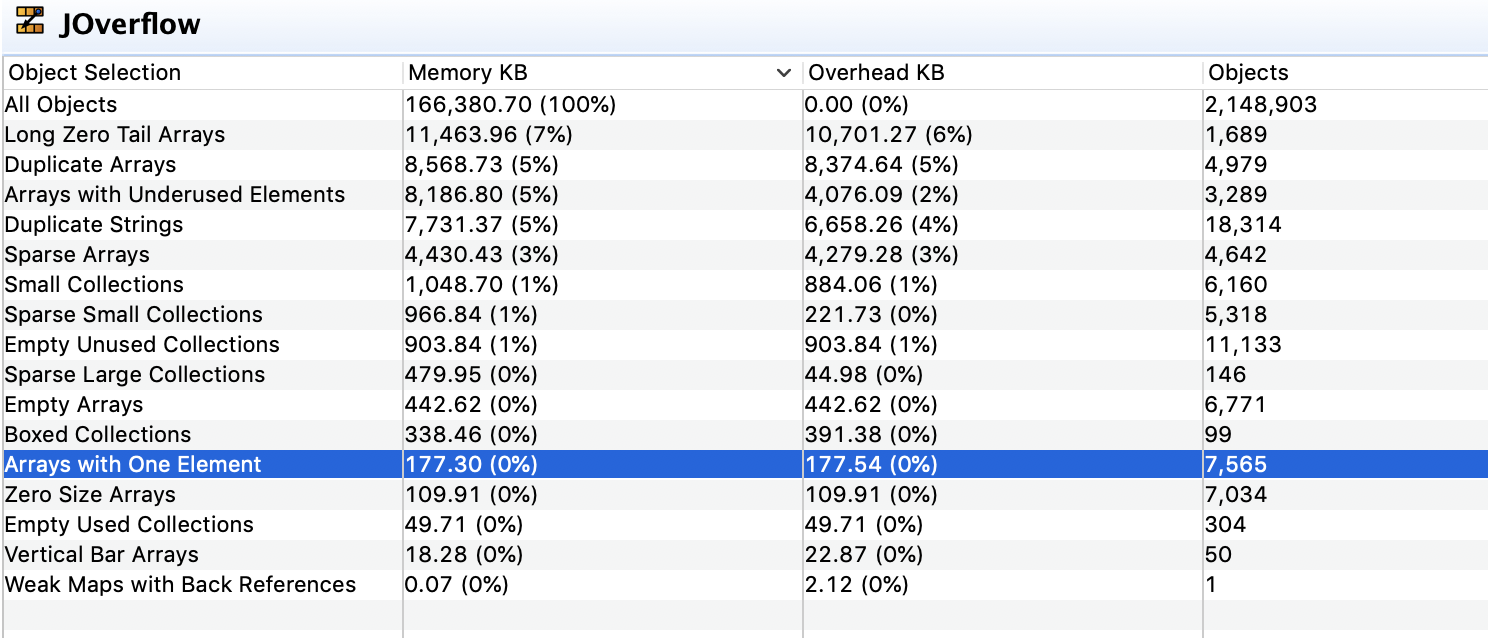
- Coming from our WorkshopConfiguration
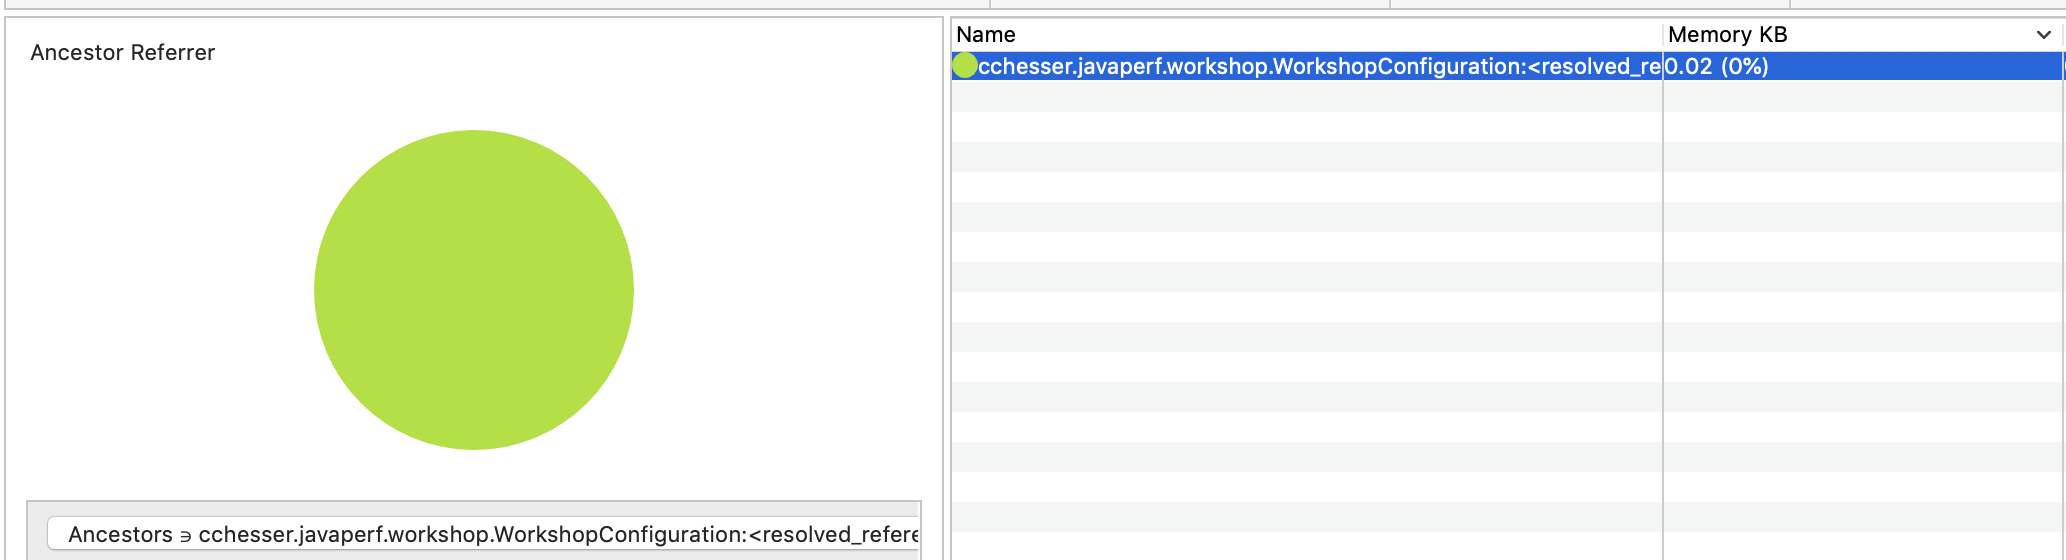
This should filter the Instances view down to that single object.
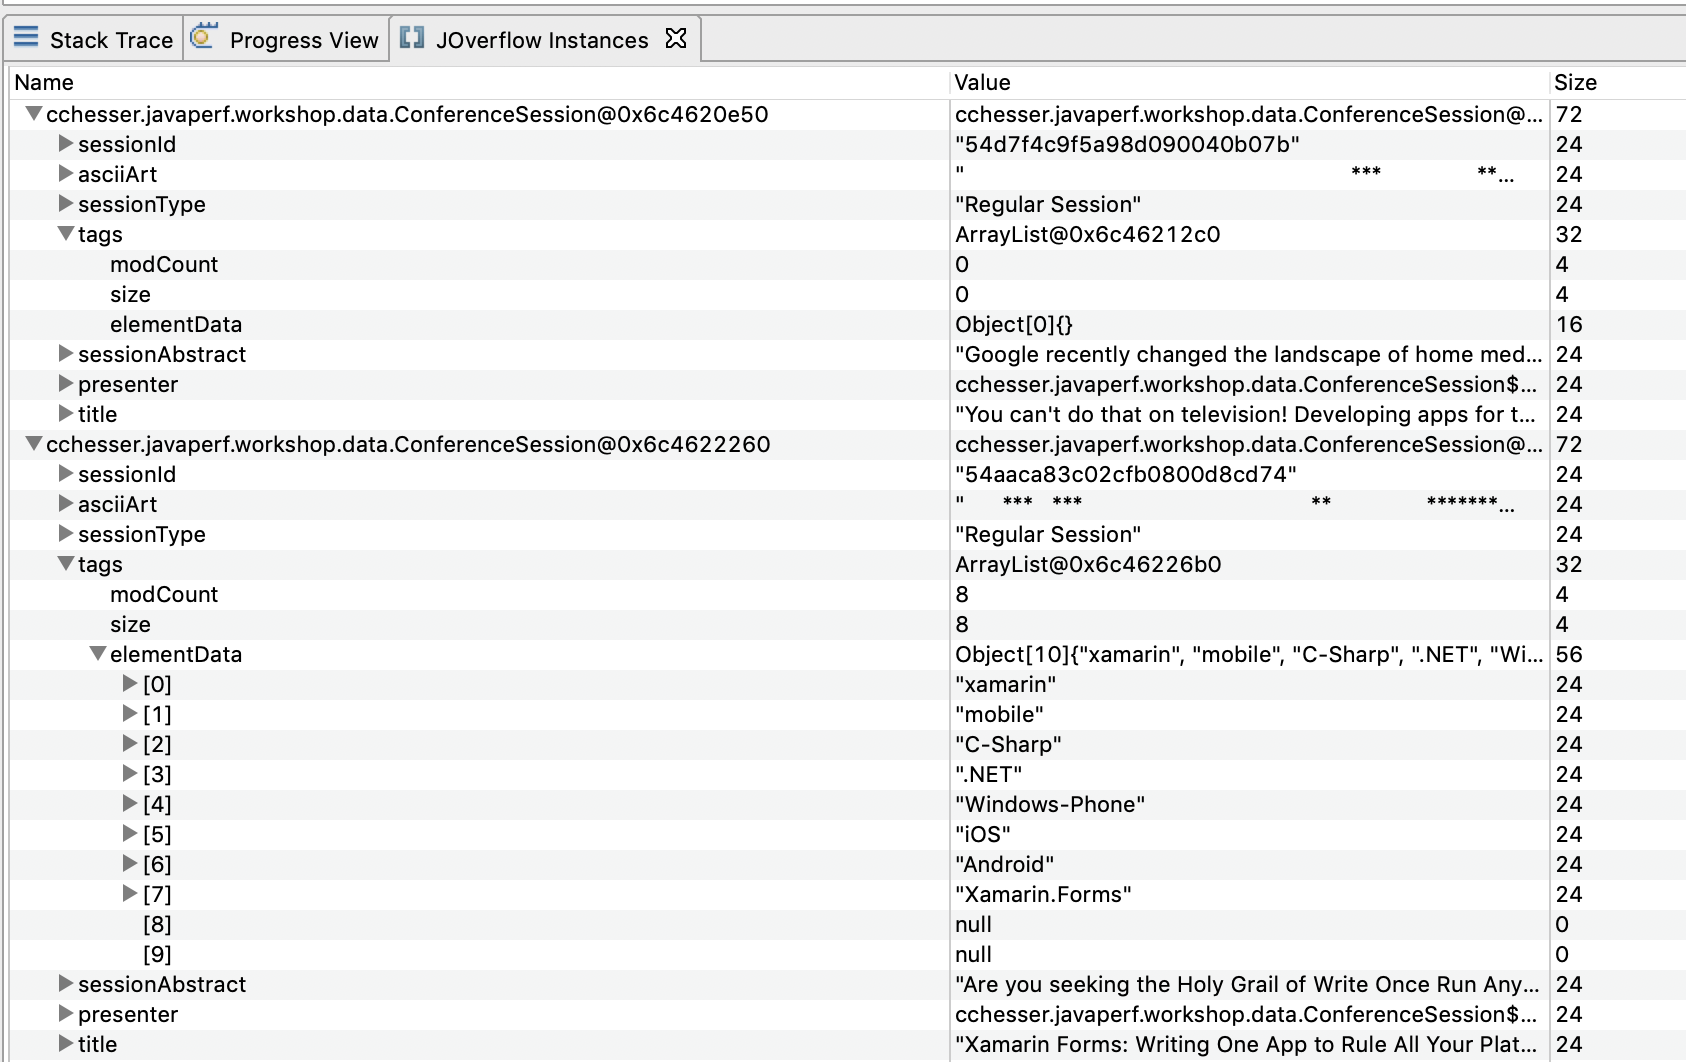
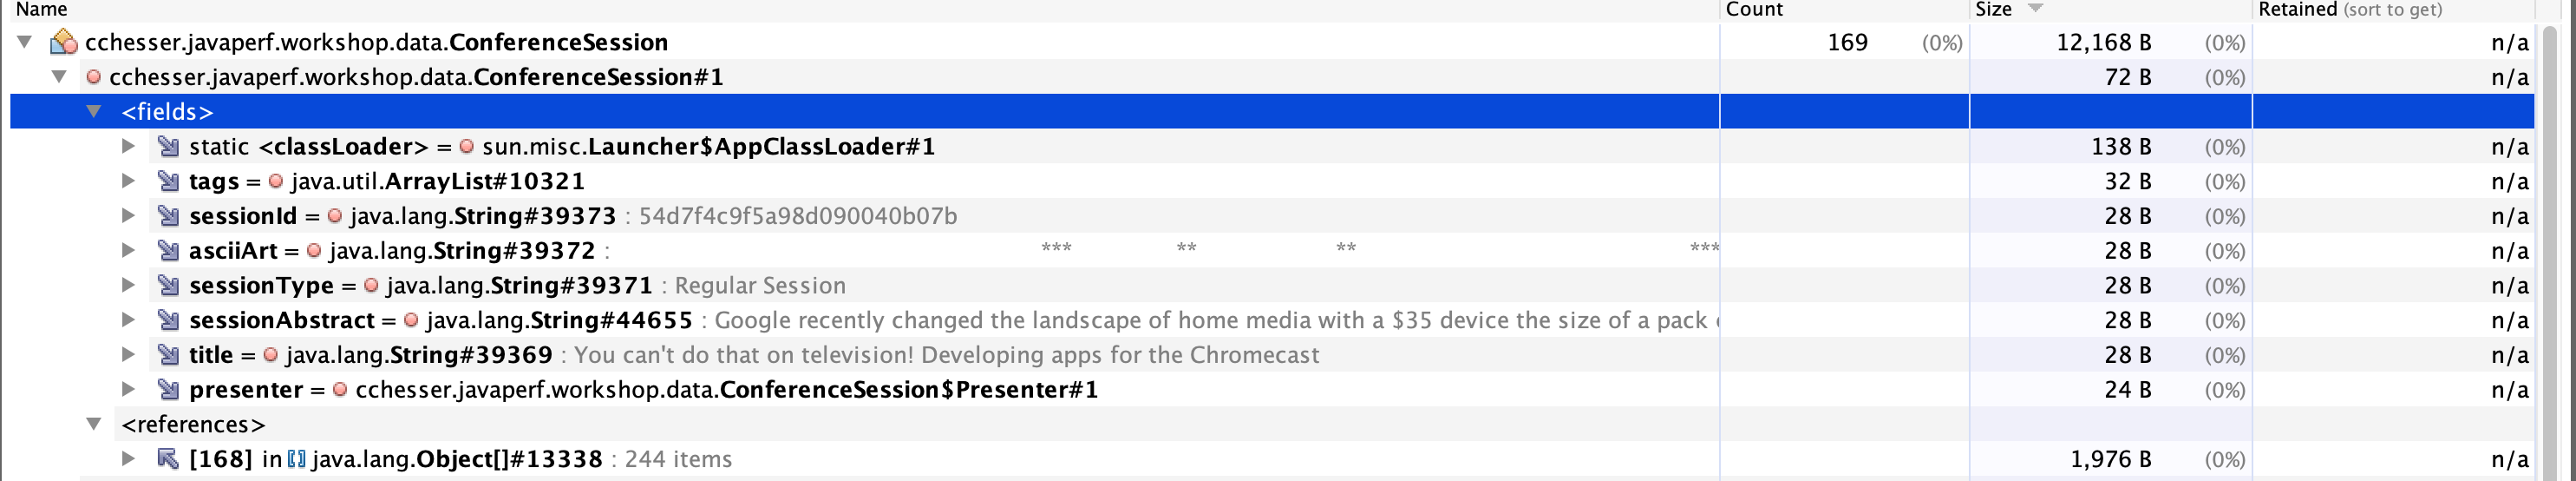
Example - Conference Session Details
We can use this same mechanism to also explore values of some of the classes we own, in the next example we’re going to:
- Use All Objects of type Conference Session
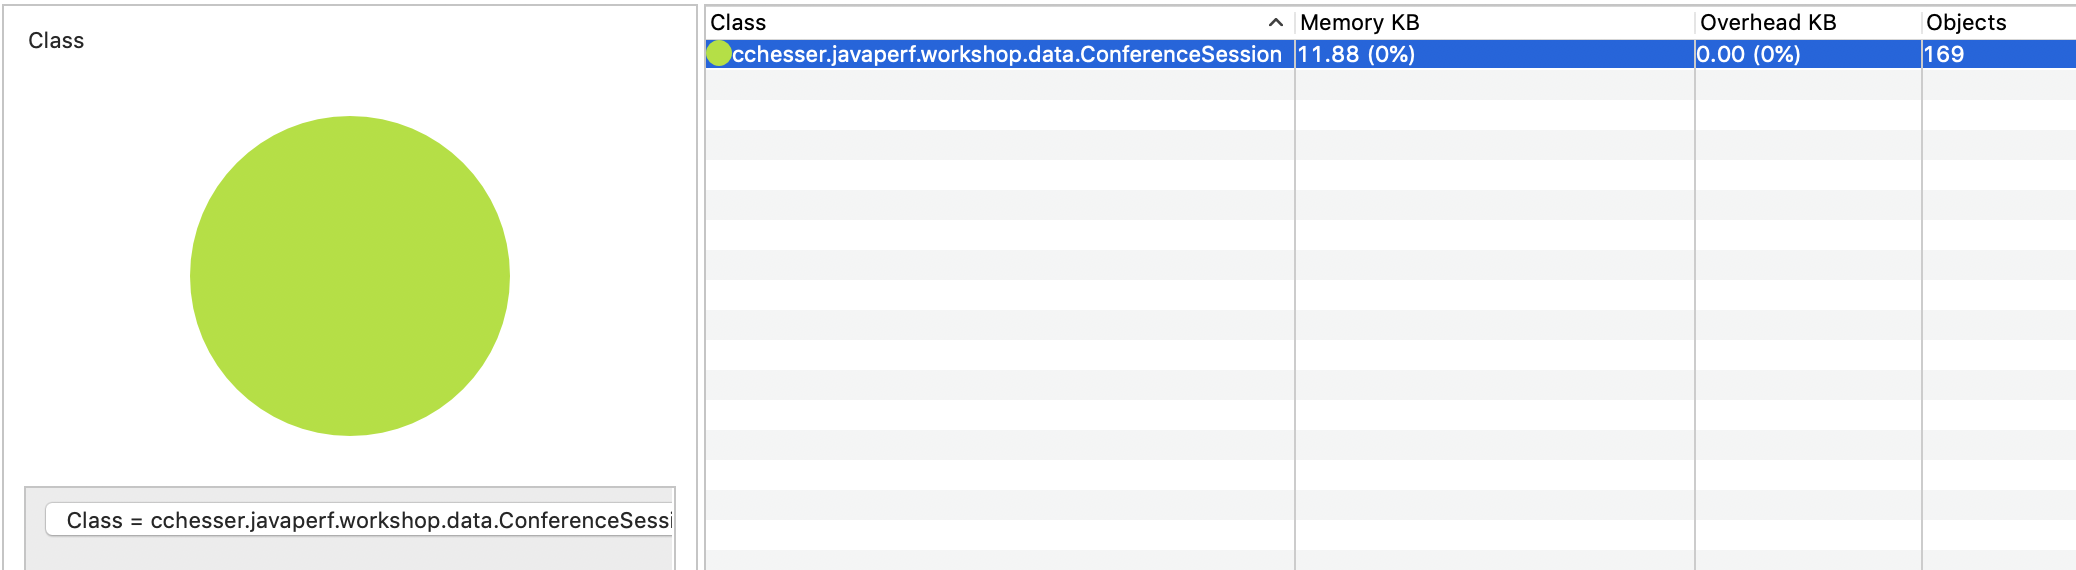
- Drill down into a couple of the instances
In the next section, we'll continue our analysis in Eclipse MAT.
Eclipse MAT5.4 - Eclipse MAT
Note
Make sure you’ve gone through the PrerequisitesEclipse Memory Analyzer is a fairly mature tool on analyzing heap dumps. It is a rich tool that includes the abilities to do OQL queries on the heap, general reporting on anti-patterns, and helpful common views (like the dominator tree). Eclipse Memory Analyzer tool is a separate install which can be a standalone install, or it can run as a plugin within Eclipse.
Opening Heap Dumps
After you have it installed, go to File and then Open Heap Dump… and specify the hprof file that you wish to analyze.
Index Files
💡 When Eclipse Memory Analyzer loads your hprof file, it will create many other index files to assist in optimally analyzing and navigating through your heap dump. It may make it easier to isolate your prof file in its own directory prior to opening it, based on the secondary files which are created. You can always just delete these files within Eclipse Memory Analyzer by opening the Heap Dump History window, right-clicking the hprof which was previously loaded, and selecting Delete Index Files. Example listing of index files which get generated by suffix:
.domIn.index.domOut.index.index.o2ret.index.a2s.index.idx.index.inbound.index.o2c.index.o2hprof.index.outbound.index.threads
Analyzing the Heap Dump
In the following section, we’ll go through a couple of the views and what sort of data we can gather from them.
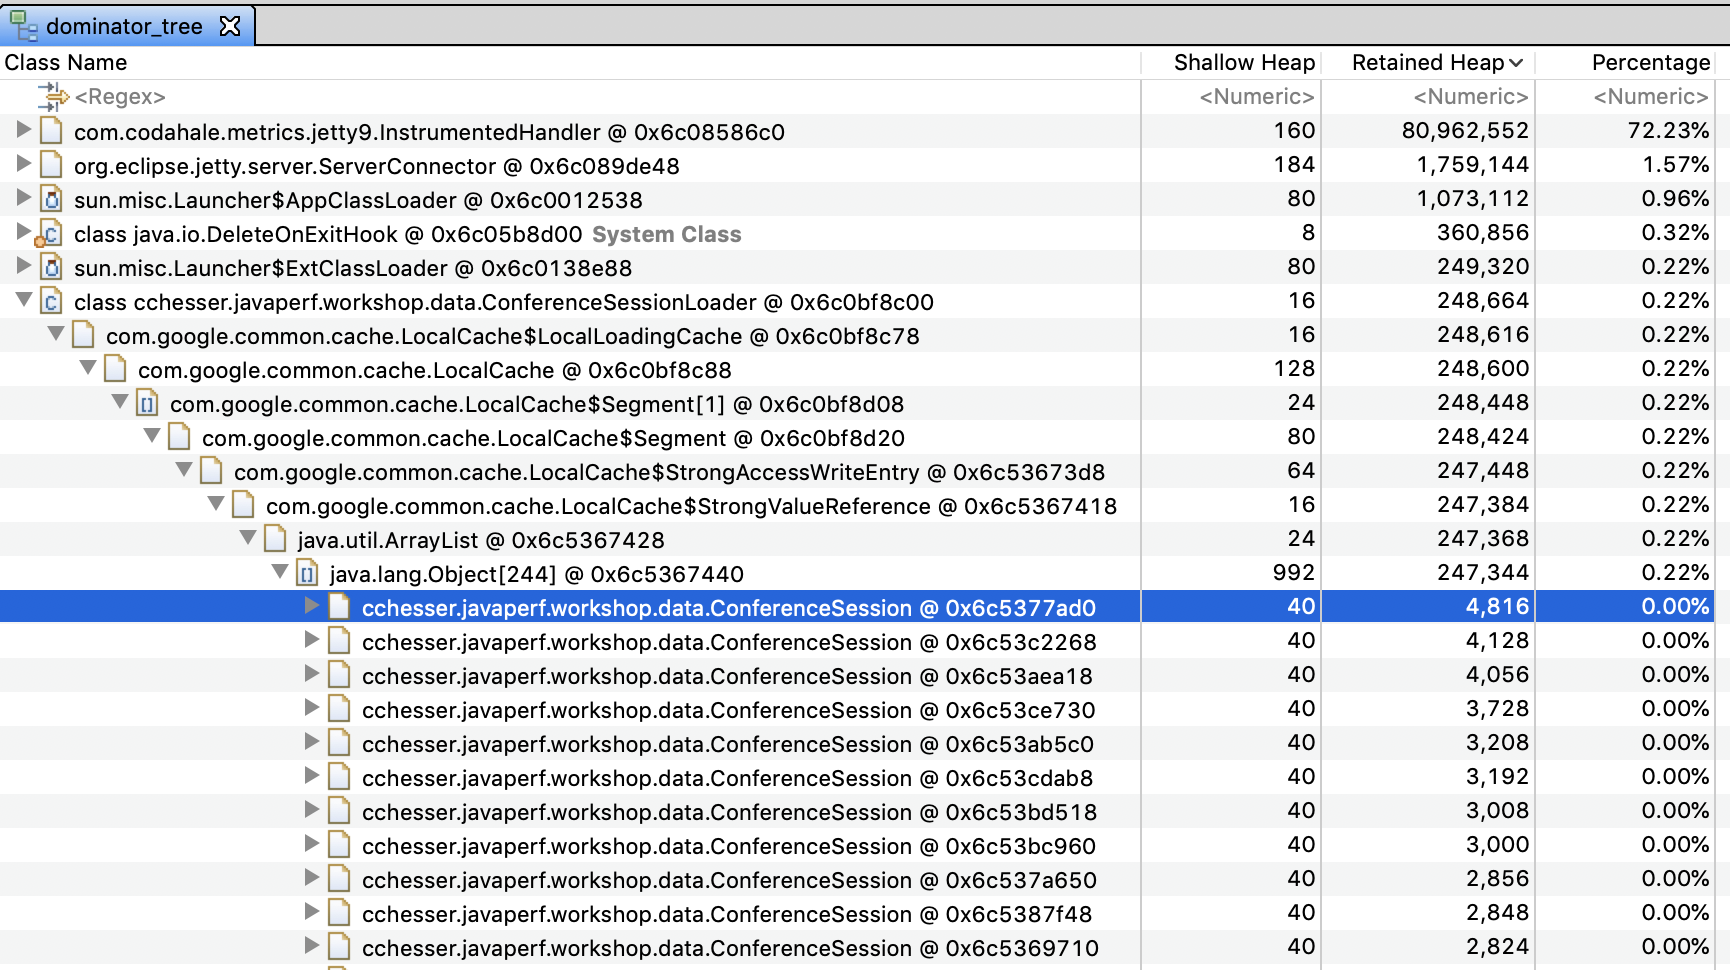
Dominator Tree
A common first area to look at your heap within Eclipse Memory Analyzer is the dominator tree. From the dominator tree, you can organize by the retained heap size, and then begin drilling down the tree to see the contributors to the largest GC roots.
Histogram
The histogram gives you a quick listing of all the top consumers by type. Typically this is going to provide context of the large consumers based on their “lower-level” types. For example, char[] is a common large contributor, which then will be followed by String which is a type that is predominately weighted by the size of the char[].
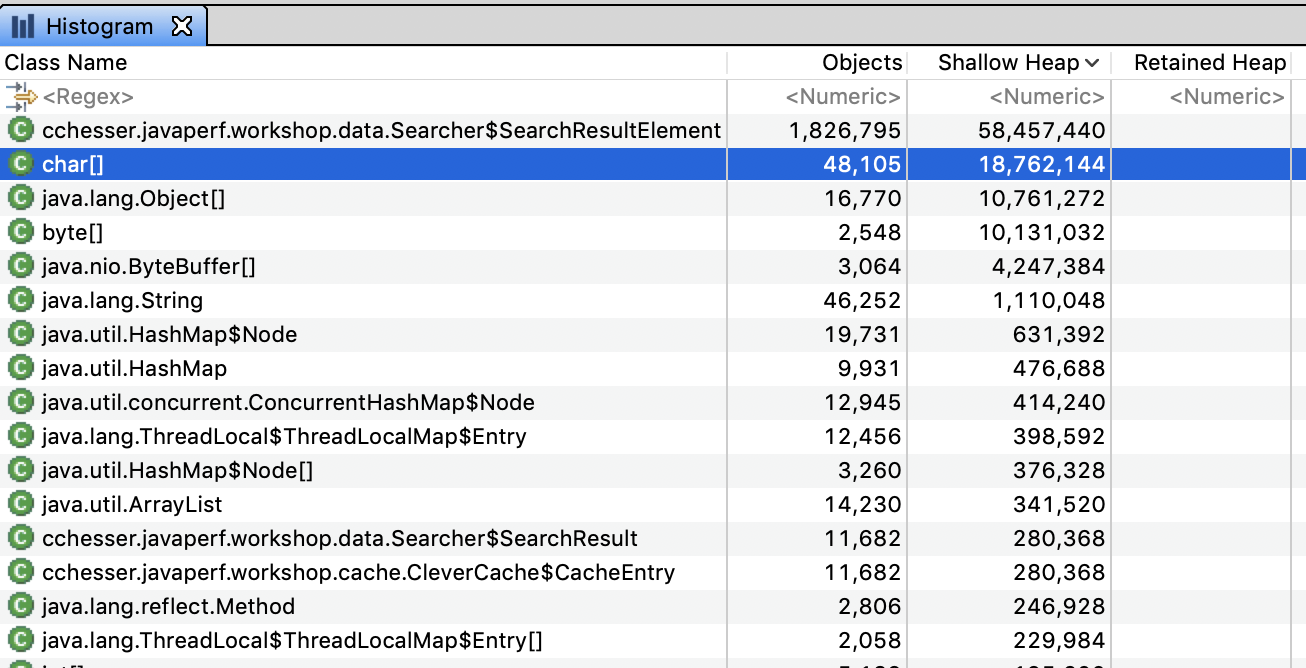
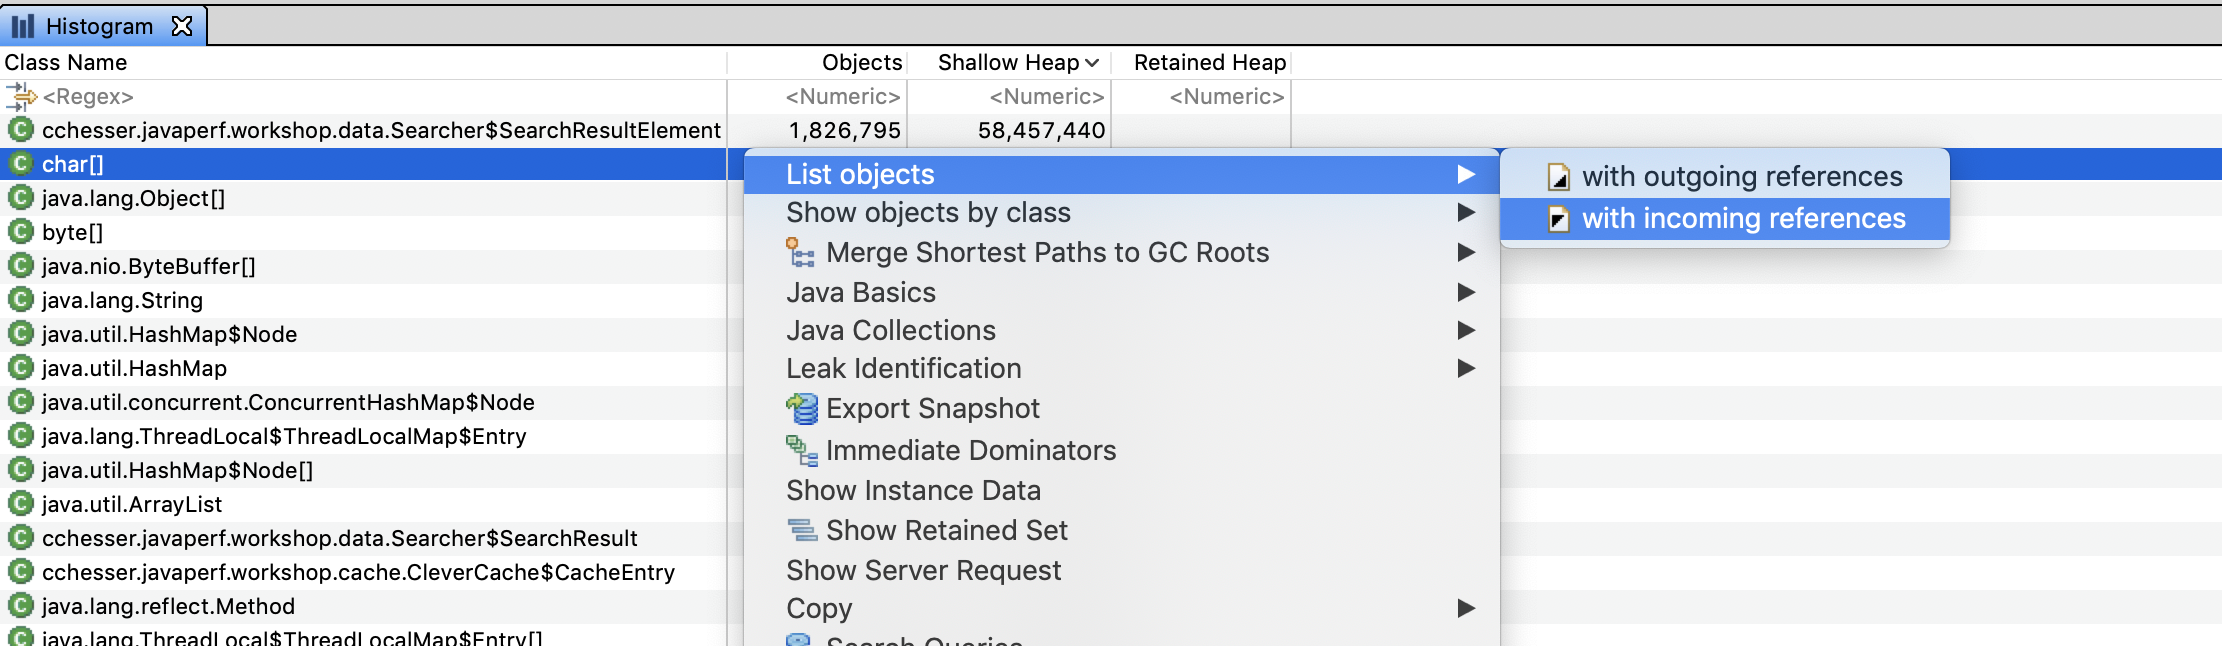
From the histogram, we can drill down into particular instances of an object and see what’s referencing them by right clicking on a row and selecting List Objects > with Incoming References
This should let us drill down into an instance and find what exactly is holding on to that specific value:
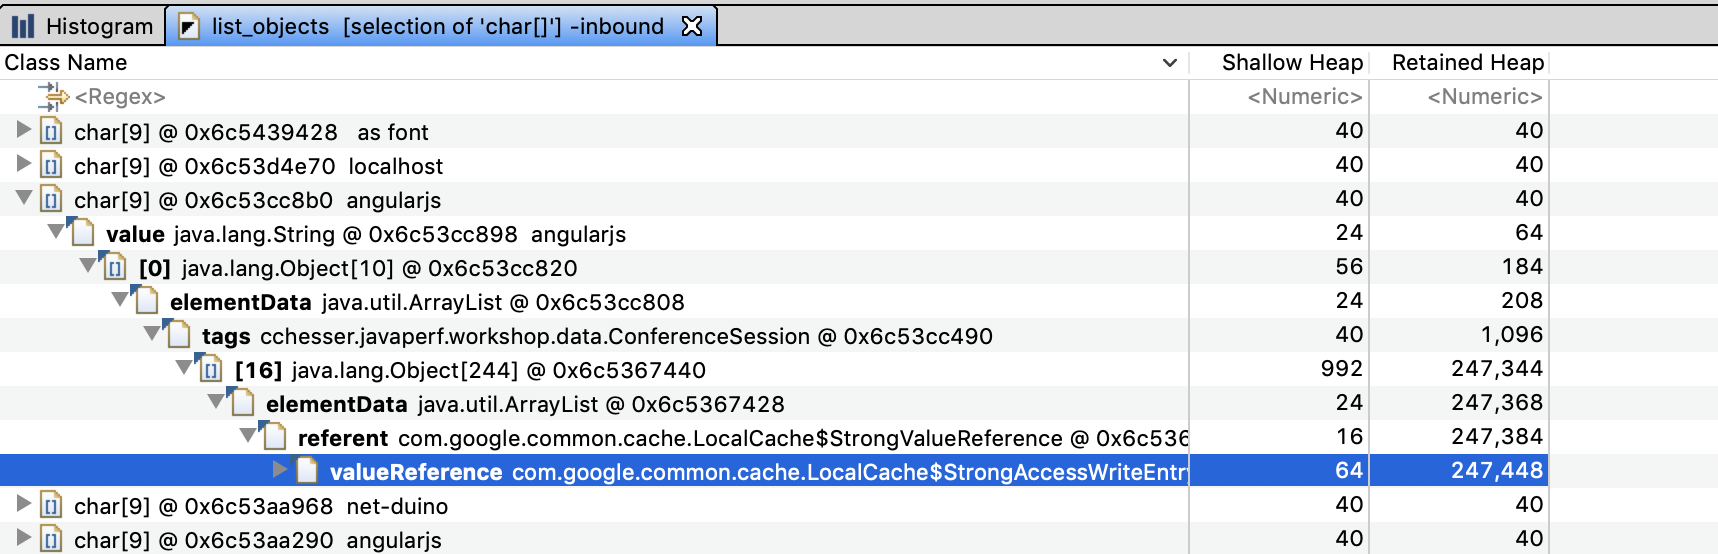
Since this view shows references by incoming link, we would read the results as:
“angularjs” is pointed to by the [0] index of the tags of a specific ConferenceSession instance, which is pointed to by LocalCache. Notice that this specific example is the inverse of what we found with the dominator tree, if we explored this table enough we would end up at a ConferenceSessionLoader reference.
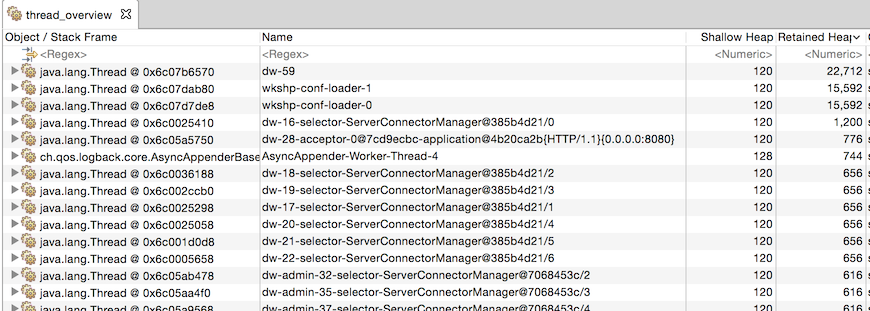
Thread Overview
The thread overview is a helpful view when you are looking at contributors based on the execution of code. For example, if you have a JVM which has thrown an OutOfMemoryError, you can tell if some type of request caused a massive spike which caused the exhaustion of memory, or if the requests may have not been abnormal, there just wasn’t sufficient space to support the request.
Warning
It may be the case that the thread that has the OutOfMemoryError in its stack is not the root cause. Consider the following example:
- We have a max heap of 128 Mb.
- A request comes in that produces a 125Mb
int[] - A second request comes in that produces a 5Mb
int[].
The JVM would potentially throw the OutOfMemory on that second request, since there’s not enough memory to allocate 5Mb, however, it might be the case that the code path for the initial request is allocating memory unnecessarily.
OQL
Another strong feature of Eclipse Memory Analyzer is the OQL studio to execute queries to do lookup on objects in your heap.
Lookup our ConferenceSession class type:
SELECT *
FROM INSTANCEOF cchesser.javaperf.workshop.data.ConferenceSession
💡 To execute the query, you click on the red exclamation mark (:exclamation:). Alternatively, you can press CTRL+Enter on Windows or Command+Enter on macOS.
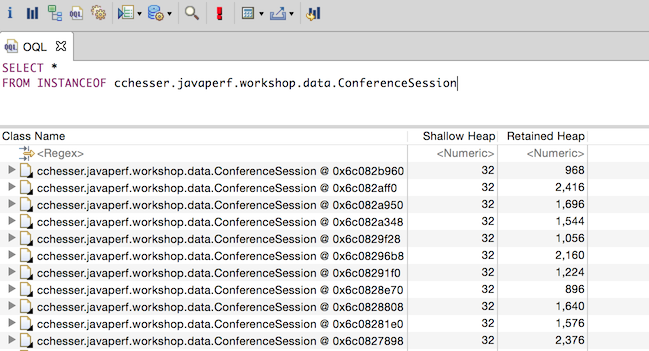
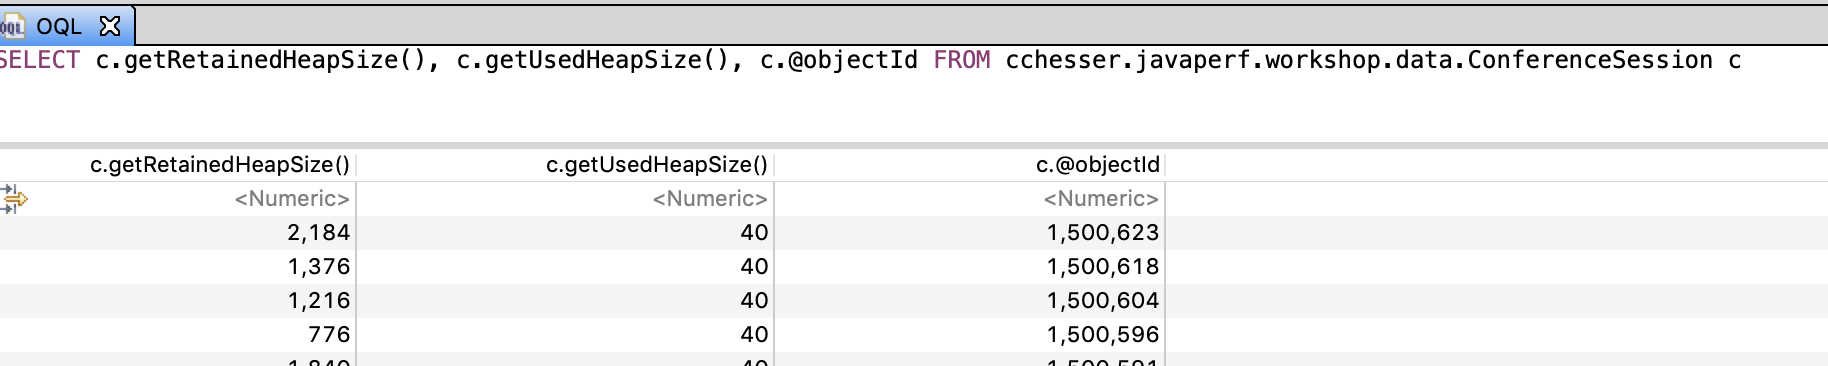
By returning the raw type back, you can expand each one to further look at the contents of the object. If you wanted to just report the object with its title attribute and the object’s retained sized, you could do this:
SELECT c.title.toString(), c.@retainedHeapSize
FROM INSTANCEOF cchesser.javaperf.workshop.data.ConferenceSession c
Now, you could then filter this by including a WHERE clause, where you can filter it by
the title or the abstract:
SELECT c.title.toString(), c.@retainedHeapSize FROM INSTANCEOF cchesser.javaperf.workshop.data.ConferenceSession c
WHERE c.title.toString() LIKE ".*(J|j)ava.*" OR c.abstract.toString() LIKE ".*(J|j)ava.*"
Reference: Eclipse Memory Analyzer OQL Syntax
The auto-completion will also let you invoke fields and method’s from Eclipse Mat’s own internal model for the heap dump. You can view other methods available by exploring the API Reference
Useful Plugins
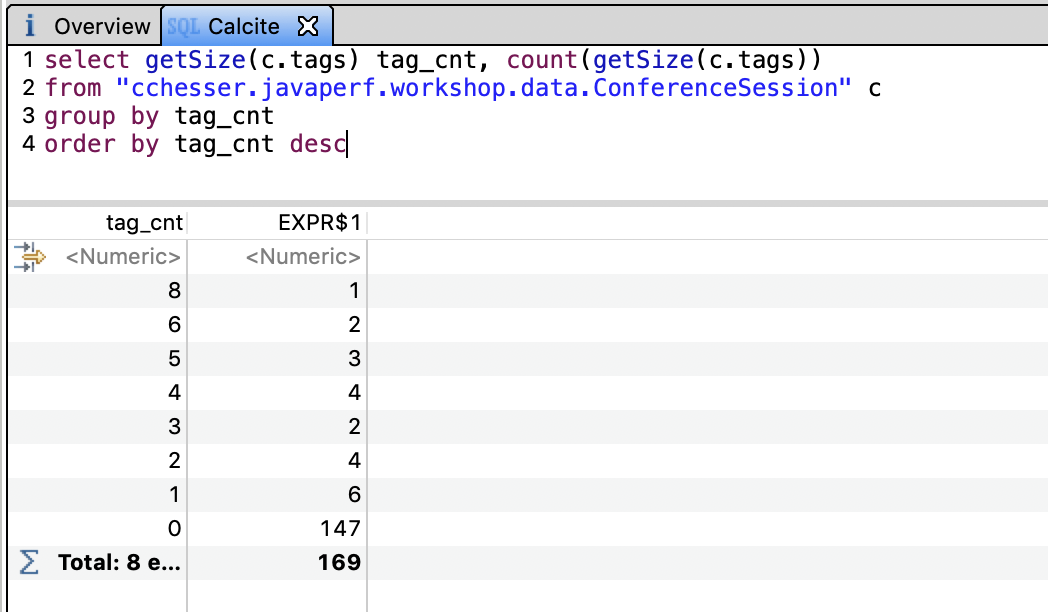
Calcite MAT
The Calcite MAT Plugin adds sort, group by and join behavior (among other things) and an additional SQL query engine.
We can use this plugin to do some more advanced analysis, for example:
- Getting a distribution of the number of tags in our ConferenceSessions
select getSize(c.tags) tag_cnt, count(getSize(c.tags))
from "cchesser.javaperf.workshop.data.ConferenceSession" c
group by tag_cnt
order by tag_cnt desc
In the next section, we'll continue our analysis in VisualVM.
VisualVM5.5 - VisualVM
Note
Make sure you’ve gone through the PrerequisitesVisualVM is a tool which used to be part of Oracle’s JDK and is now a standalone tool. This tool was spawned from the Netbeans Profiler, and it has some helpful tools to inspect a heap dump.
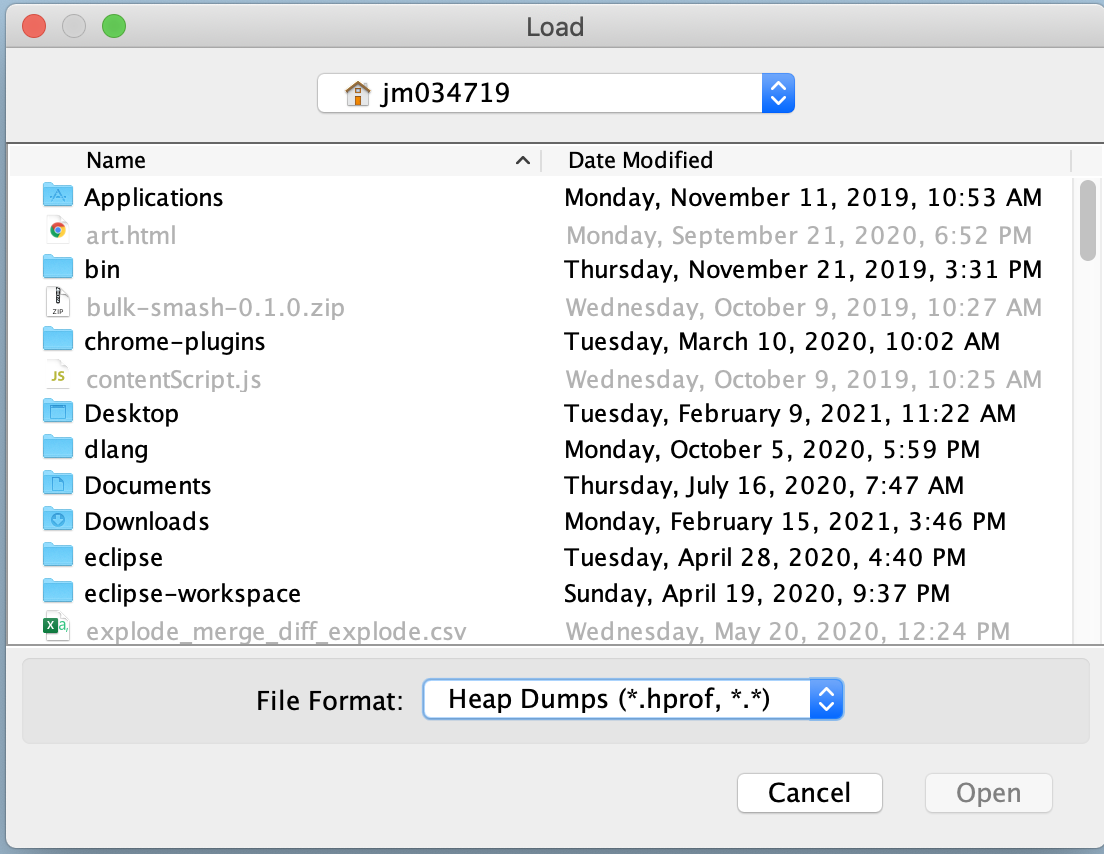
Opening Dumps
To load the heap dump in VisualVM, you will just go to File -> Load… and specify the File Format to be Heap Dumps….
Analyzing the Heap Dump
VisualVM offers the following sections:
- Summary
- Objects
- Threads
- OQL Console
- R Console
For the purpose of this section we are only going to utilize the OQL Console to construct queries on the heap. There are other options in VisualVM (briefly discussed here), but we feel that the other tools presented before this offer much nicer views/data.
Summary
The Summary view gives you a quick overview of the state of the heap:
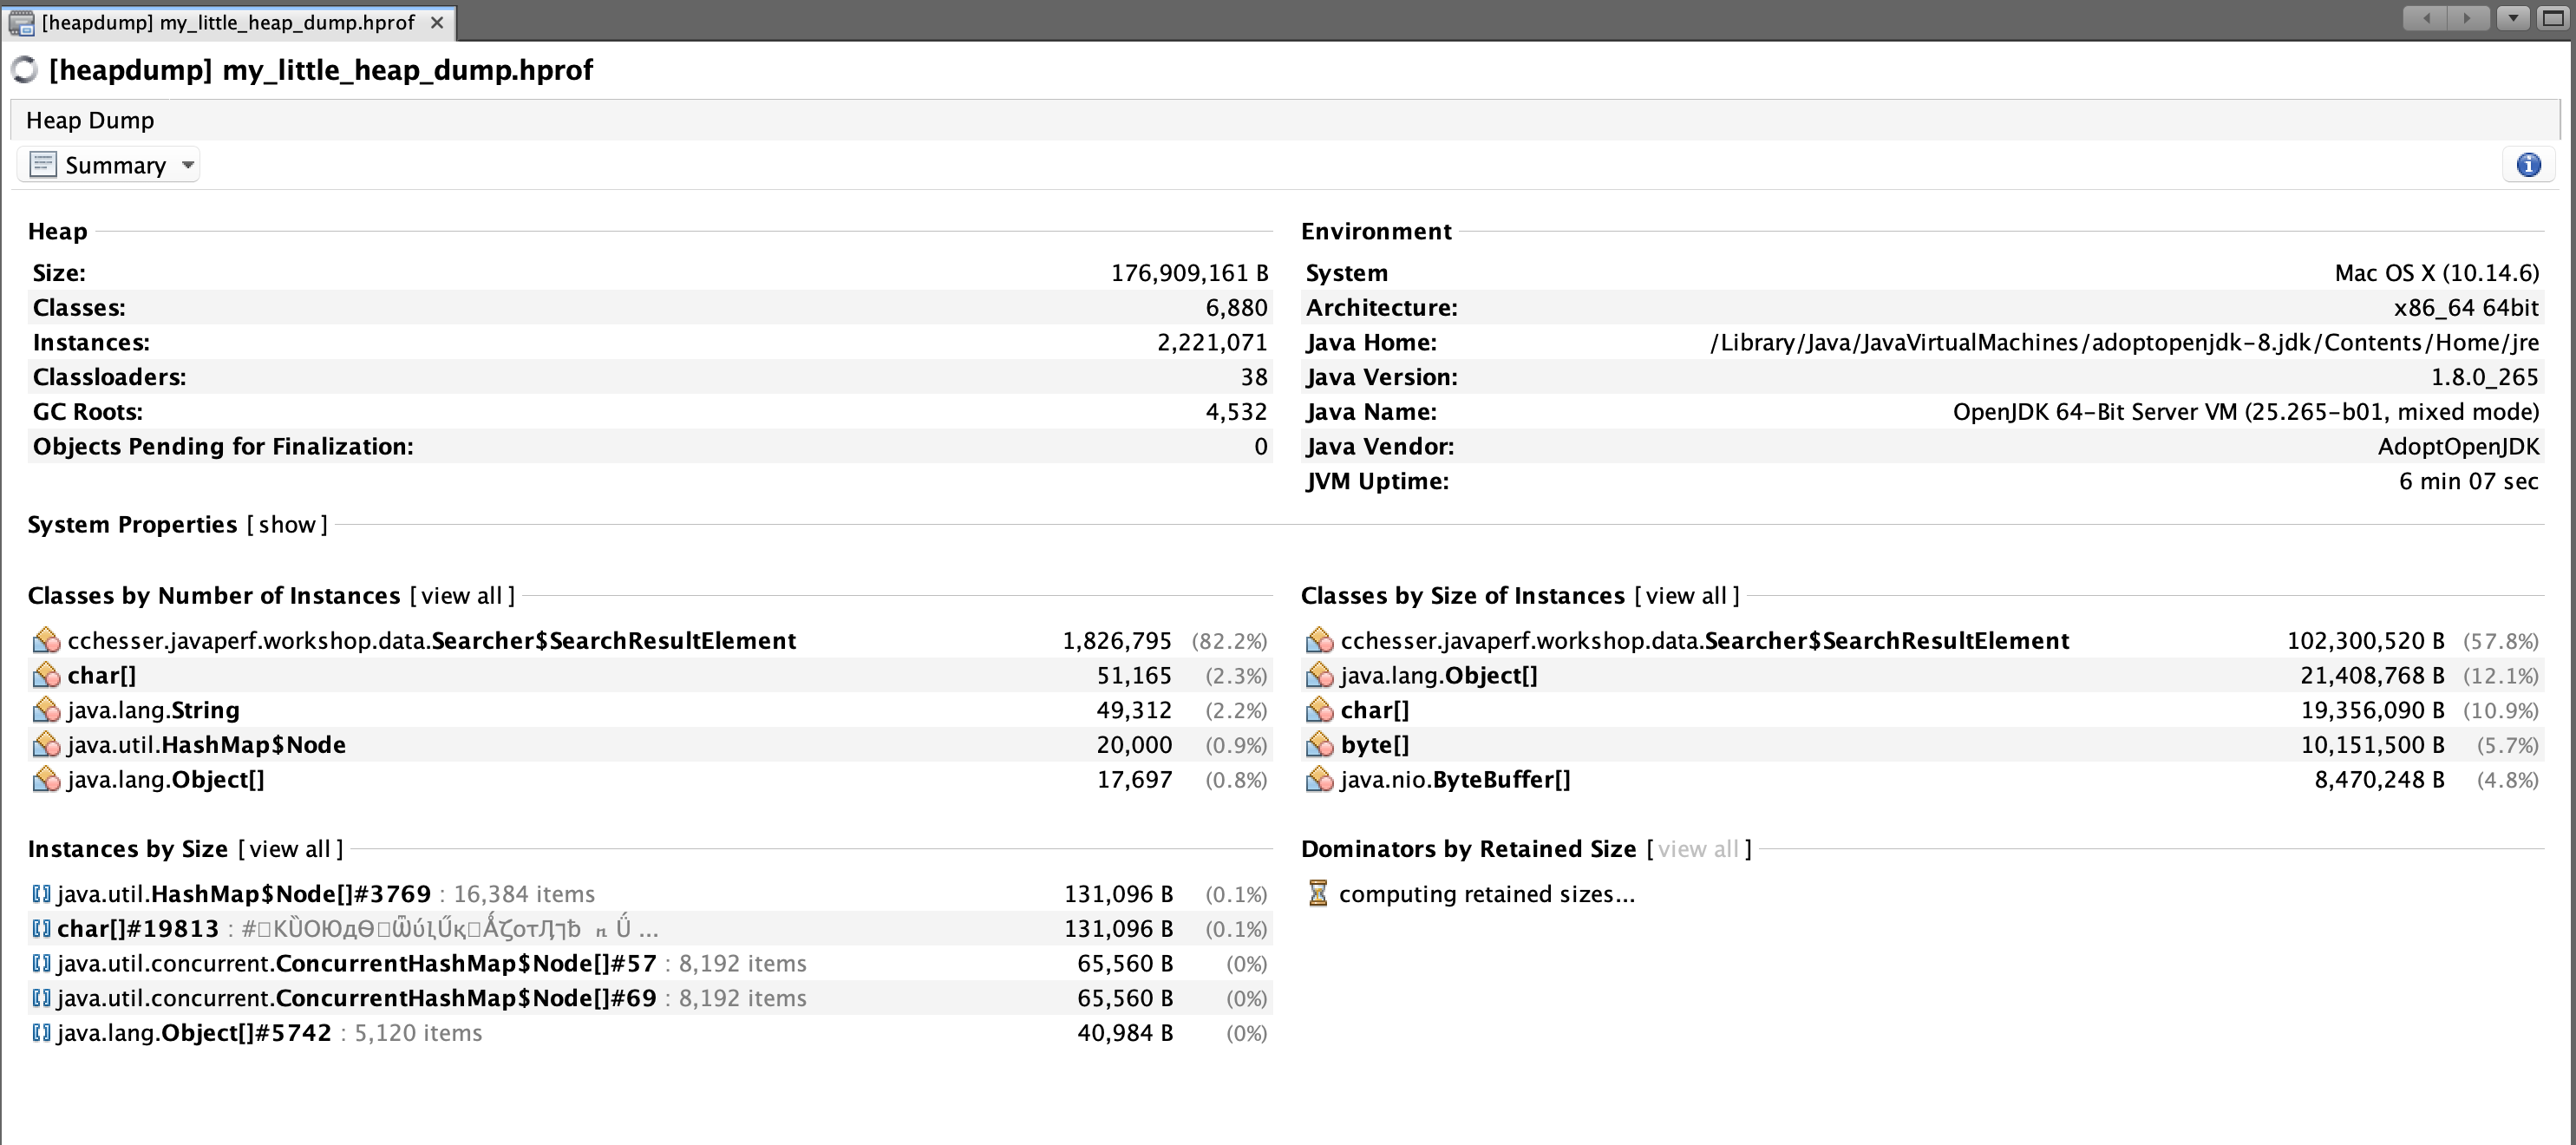
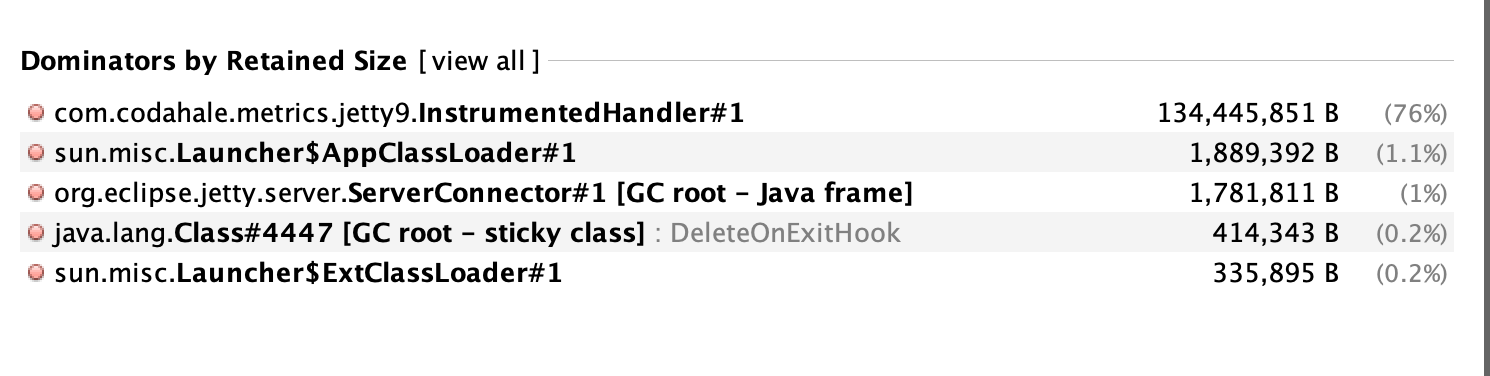
This view also lets you quickly gather the dominators for the heap, similar to the Dominator Tree in Eclipse MAT.
Objects
The Objects view groups instances by class.
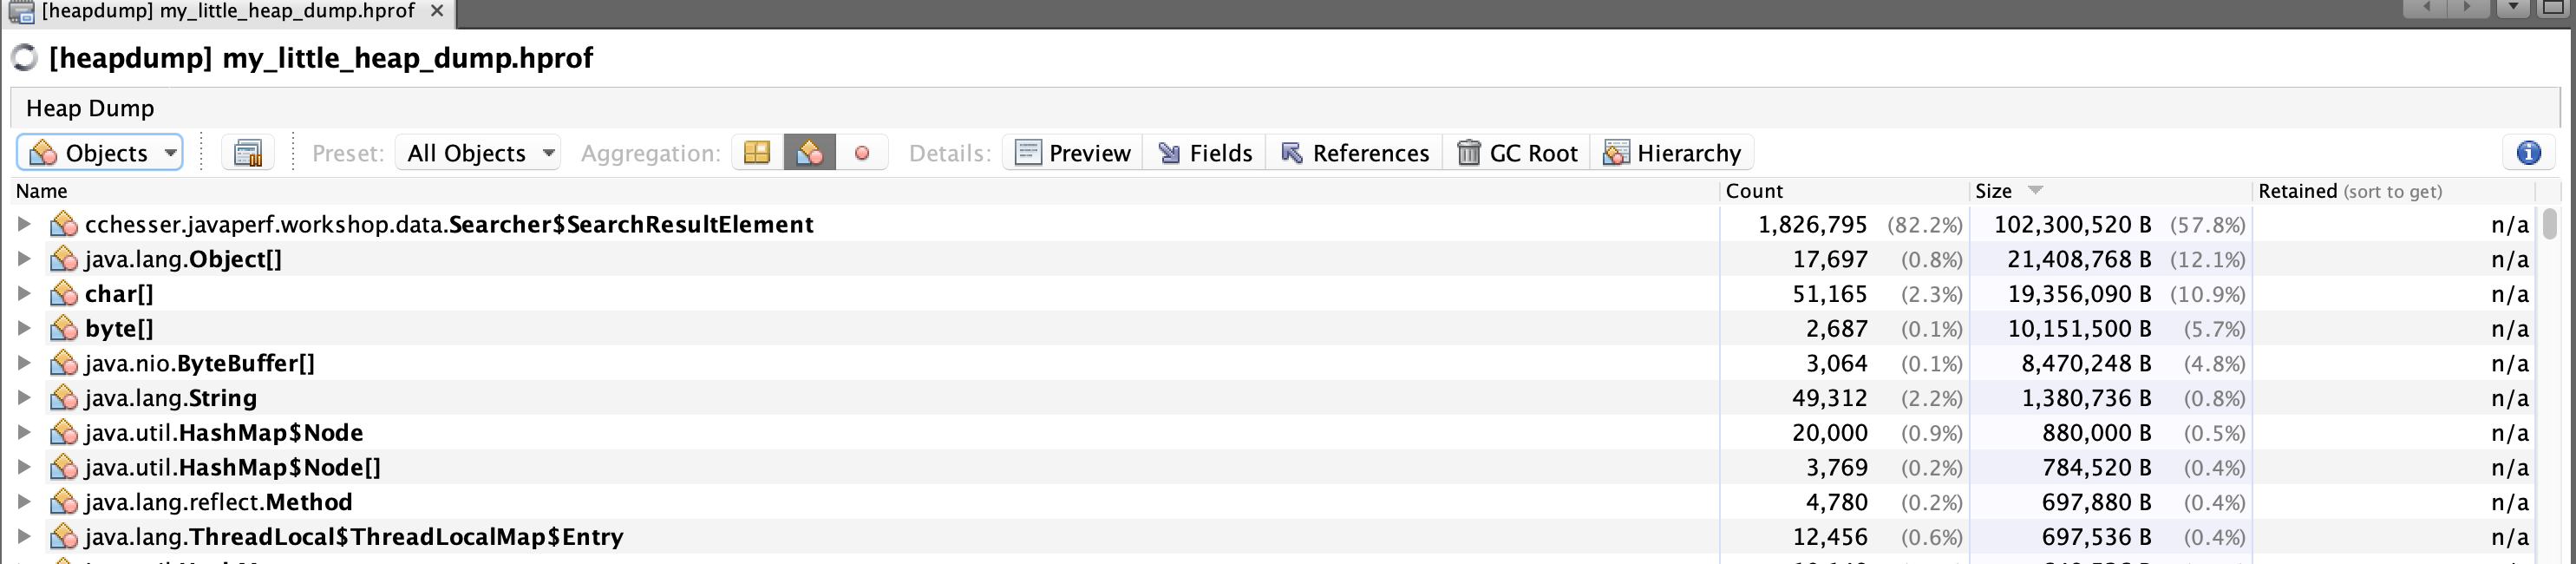
Within this view, you can inspect individual instances of an object and see both the fields and the incoming references to that instance:
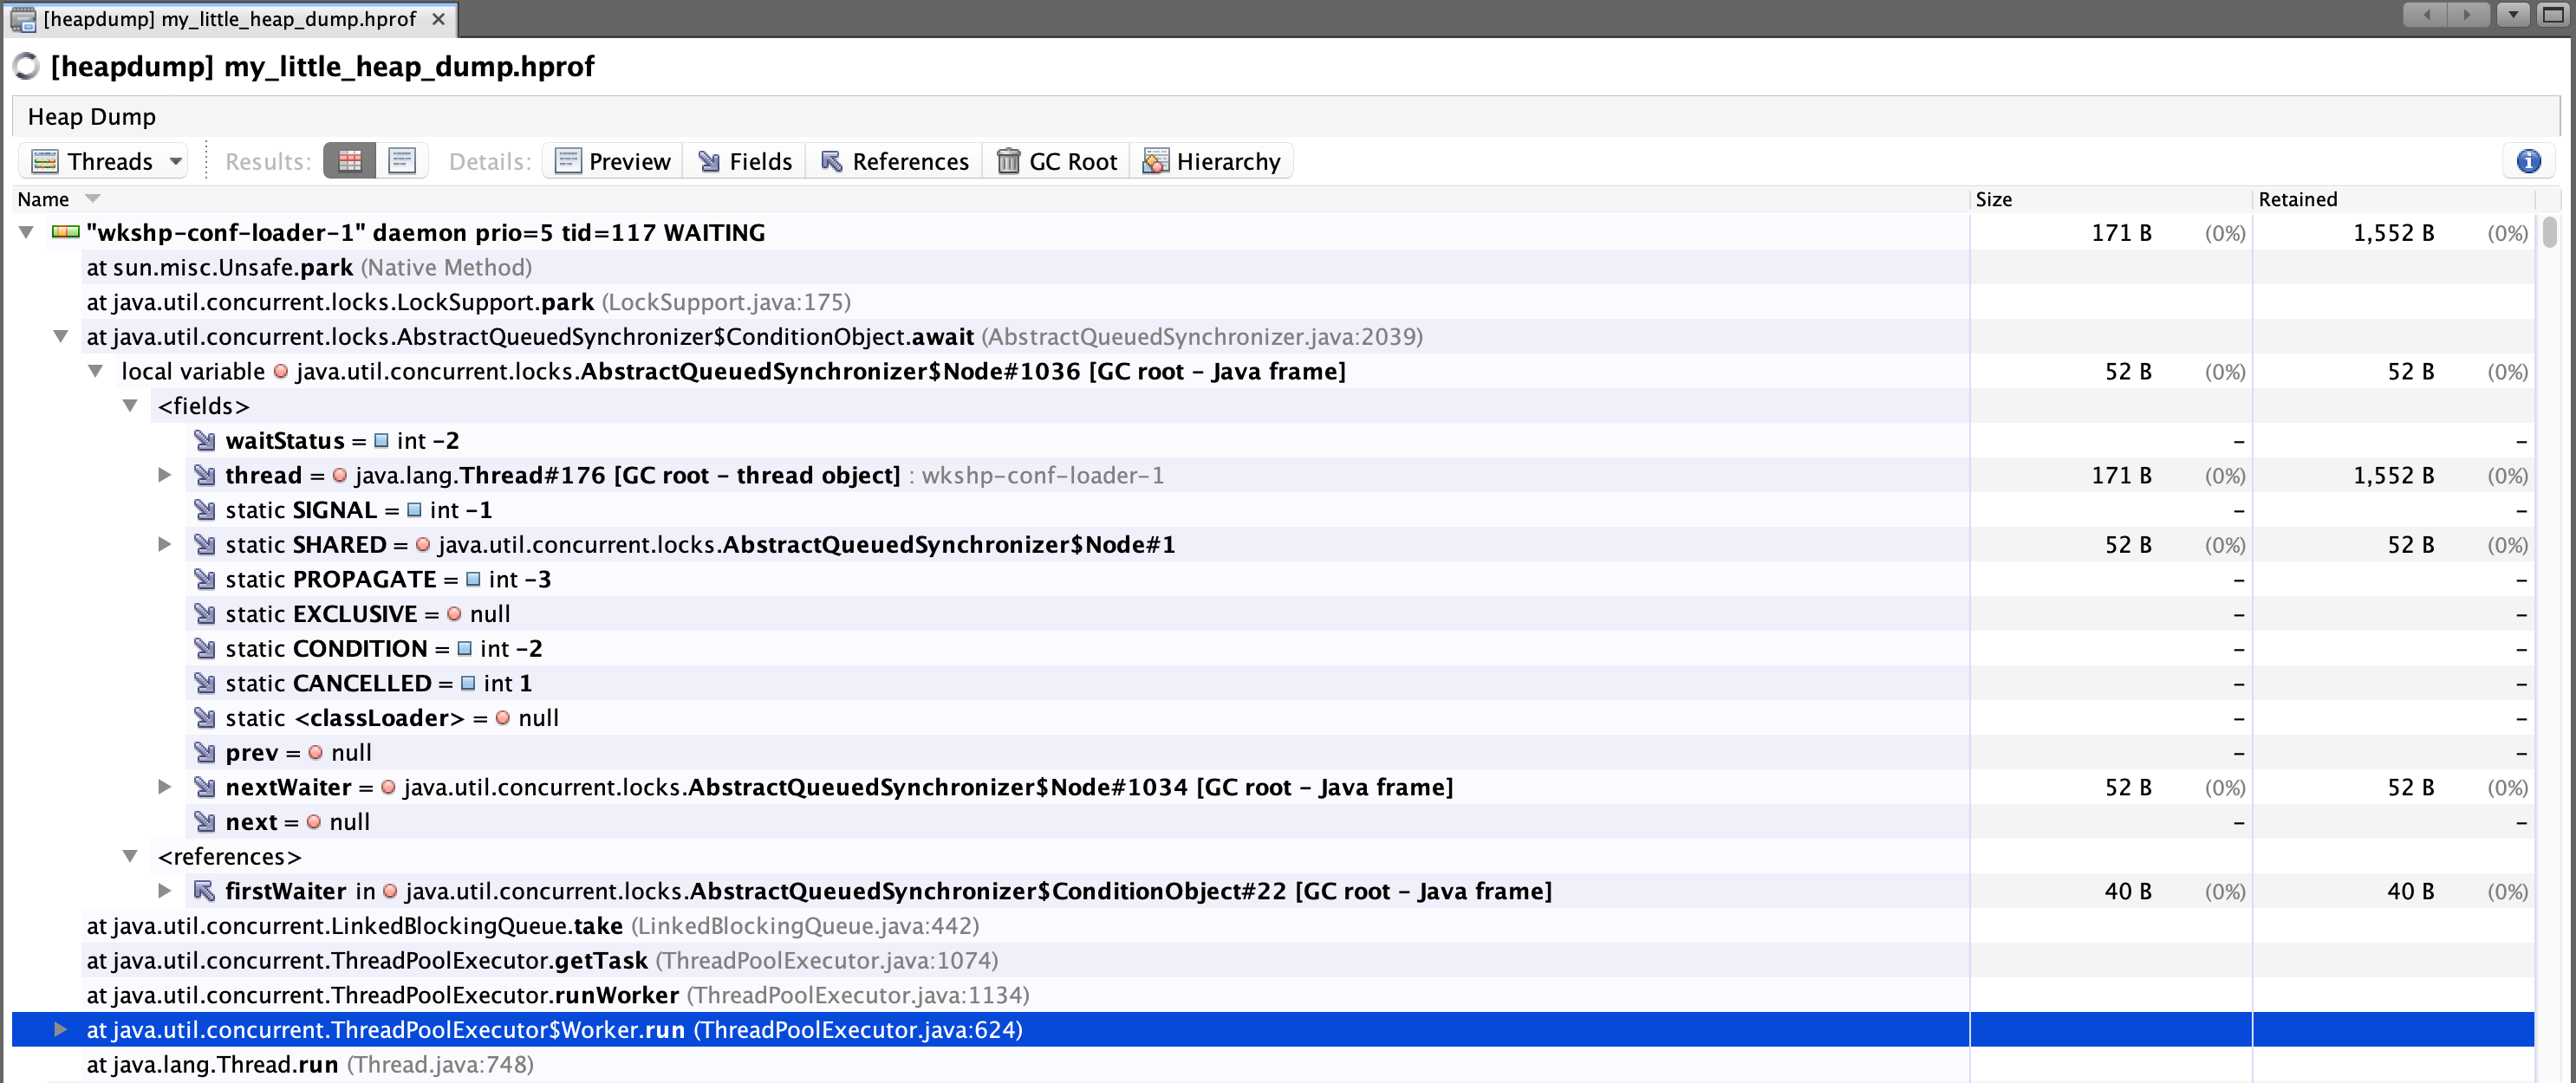
Threads
The Threads view visualizes the state of threads.
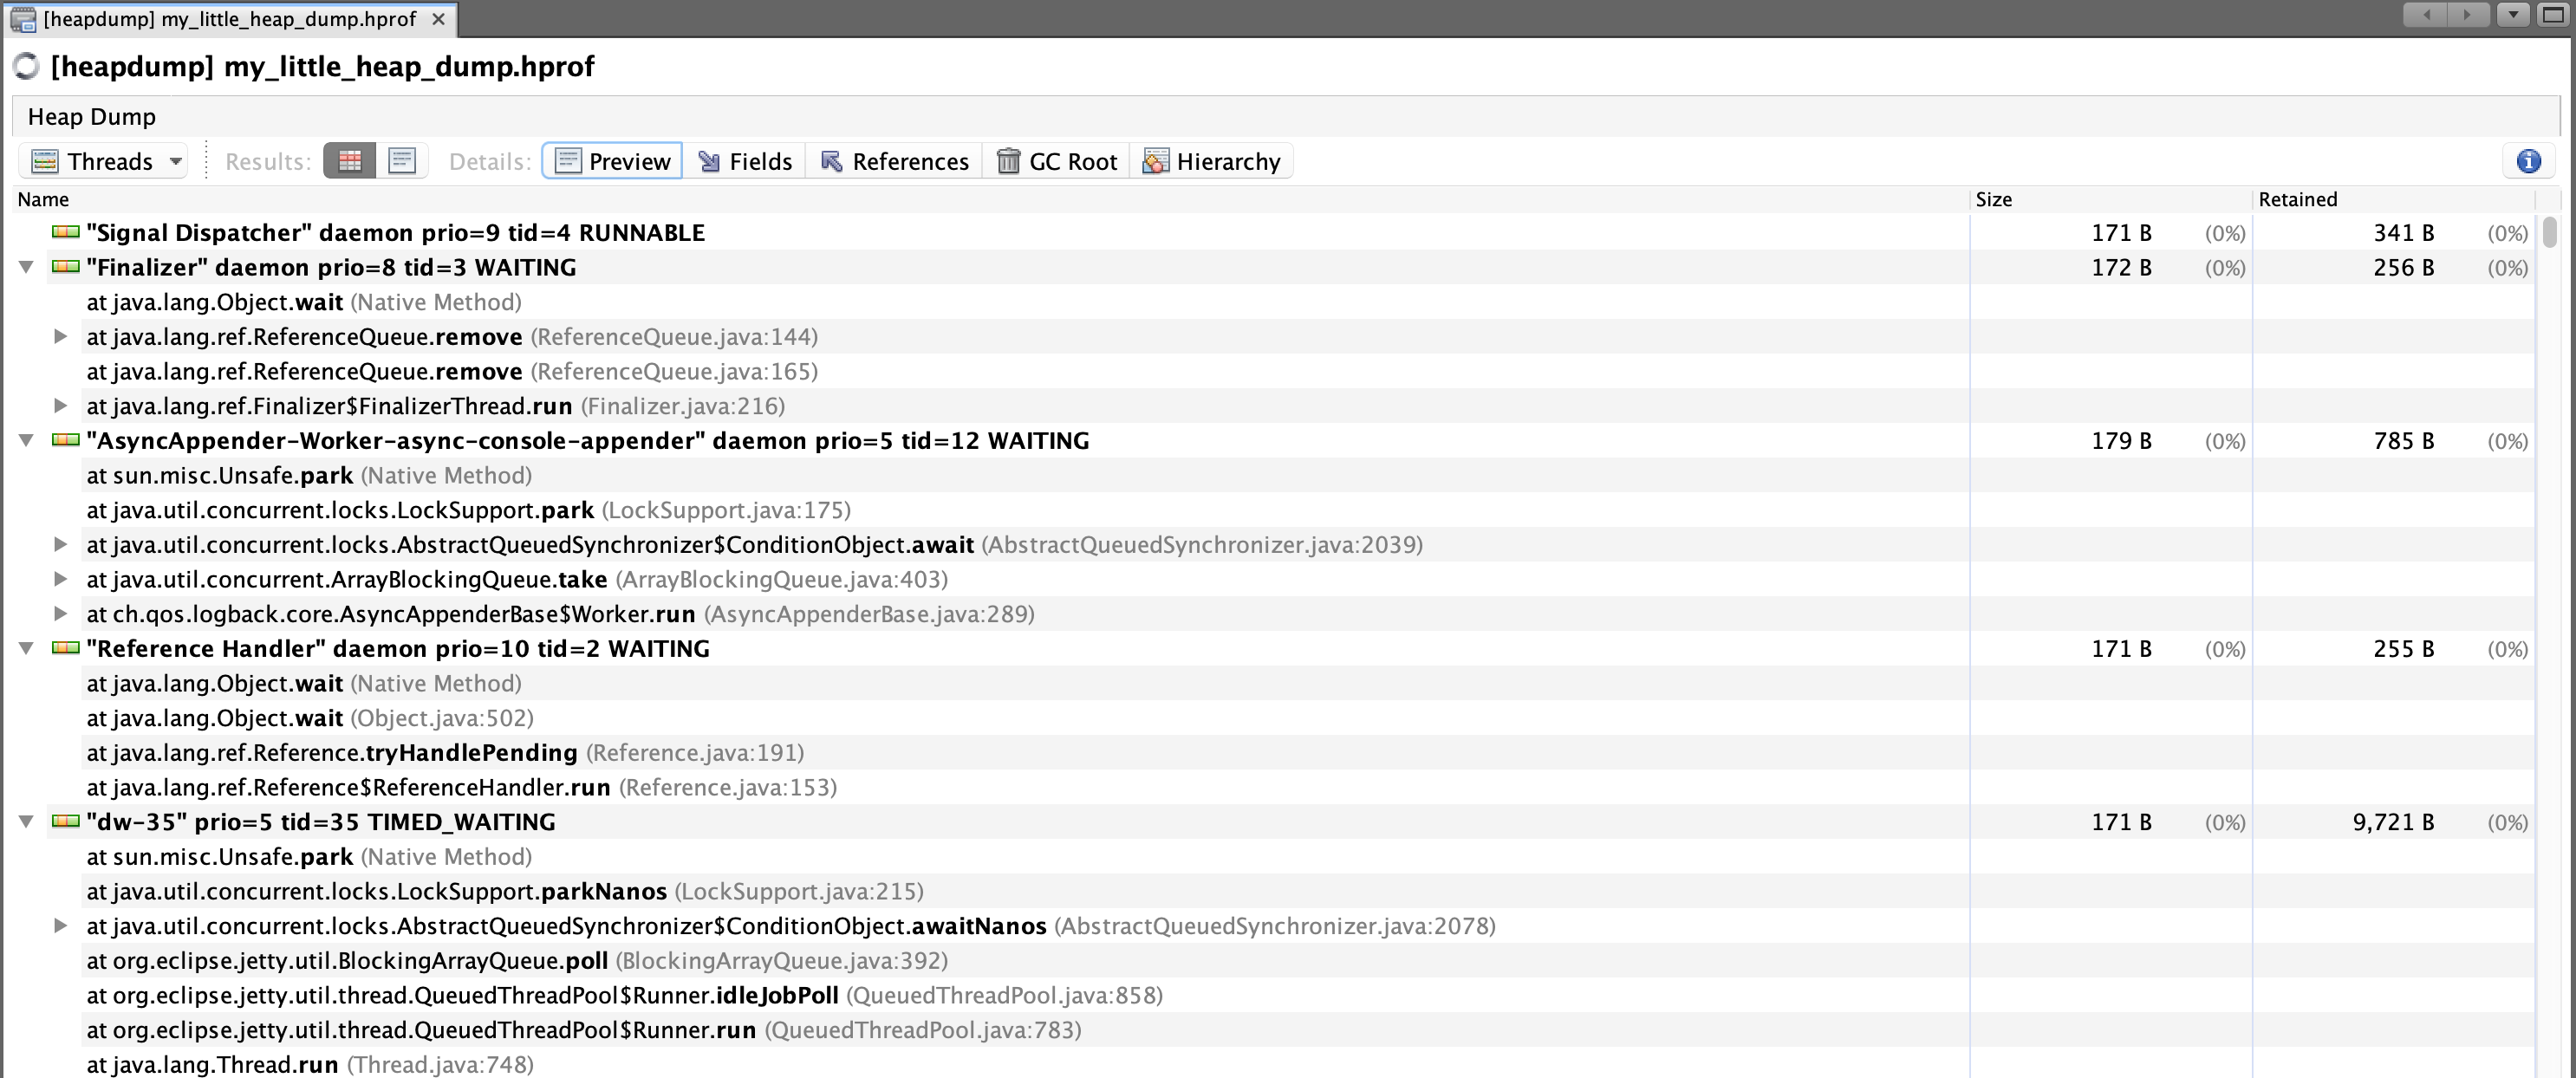
Within this view, you can drill down into certain threads and view what was specifically referenced in a stack frame:
OQL Console
One of the attractive features for VisualVM is that its OQL Console allows you to write Javascript code to query objects, which you can then do other functions on that data.
From the OQL Console, we will issue queries and then allow you to further play around with the language.
OQL Queries
Note
The OQL which you use between this tool (and others), isn’t necessarily standard, and therefore cannot be used between tooling without issues. VisualVM gives you the ability to leverage Javascript, which is unique to other tools supporting heap dump analysis.Reference: VisualVM OQL Help
Deamon Threads
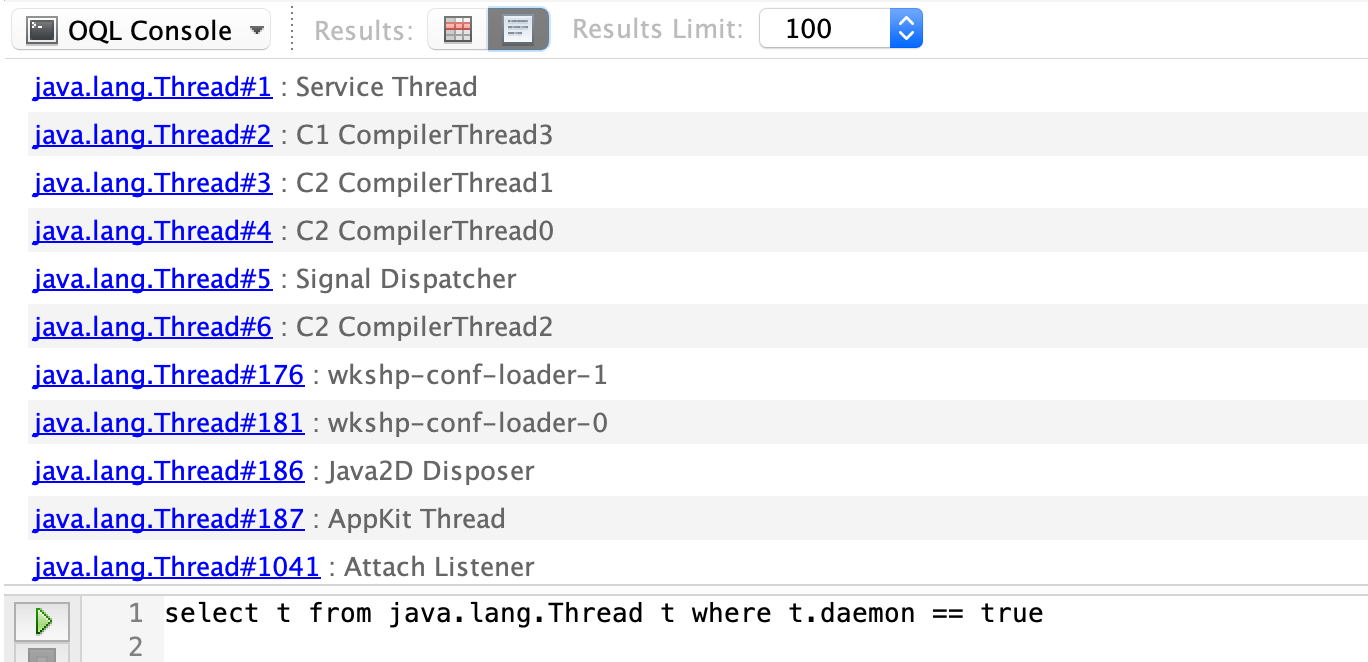
Query for Thread objects which are daemons (you can get context of Threads, since they are objects in your heap too):
select t from java.lang.Thread t where t.daemon == true
Previous versions of VisualVM used to return the results as hyperlinks, which you could then click and begin diving into the instance state:
The newer versions of VisualVM will populate the results in a view similar to the Objects view:
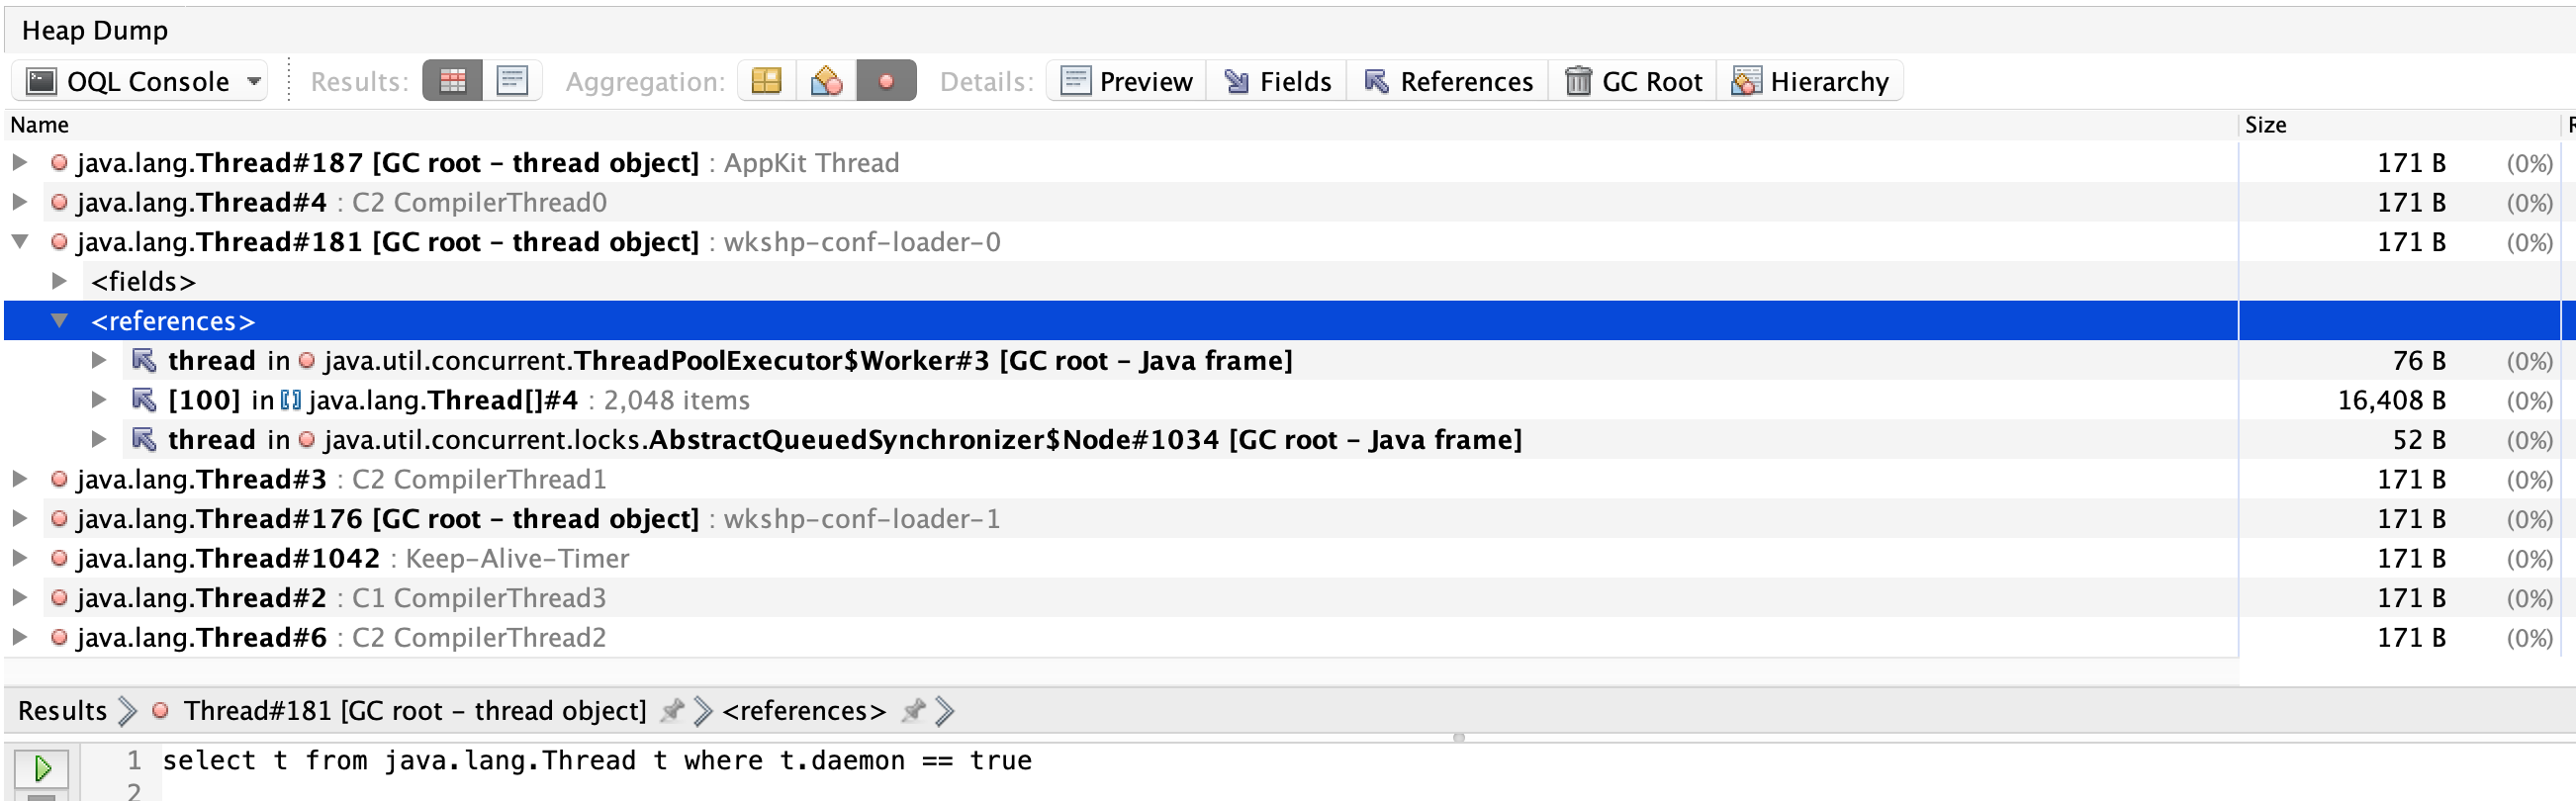
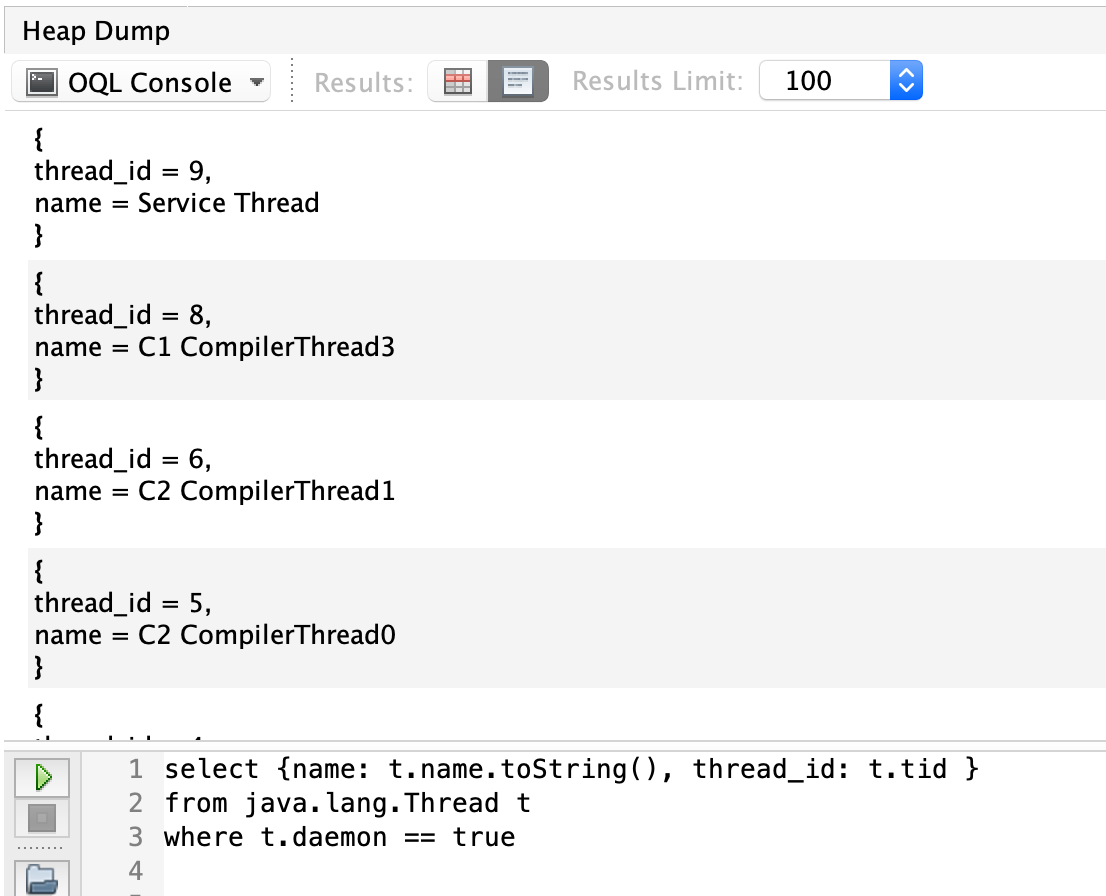
Mapping to JSON
Query for Thread objects (similar to last query), but return multiple attributes as JSON:
select {name: t.name.toString(), thread_id: t.tid }
from java.lang.Thread t
where t.daemon == true
Applying Javascript
VisualVM offers a helper object that represents the heap, the heap object, which offers a few useful functions.
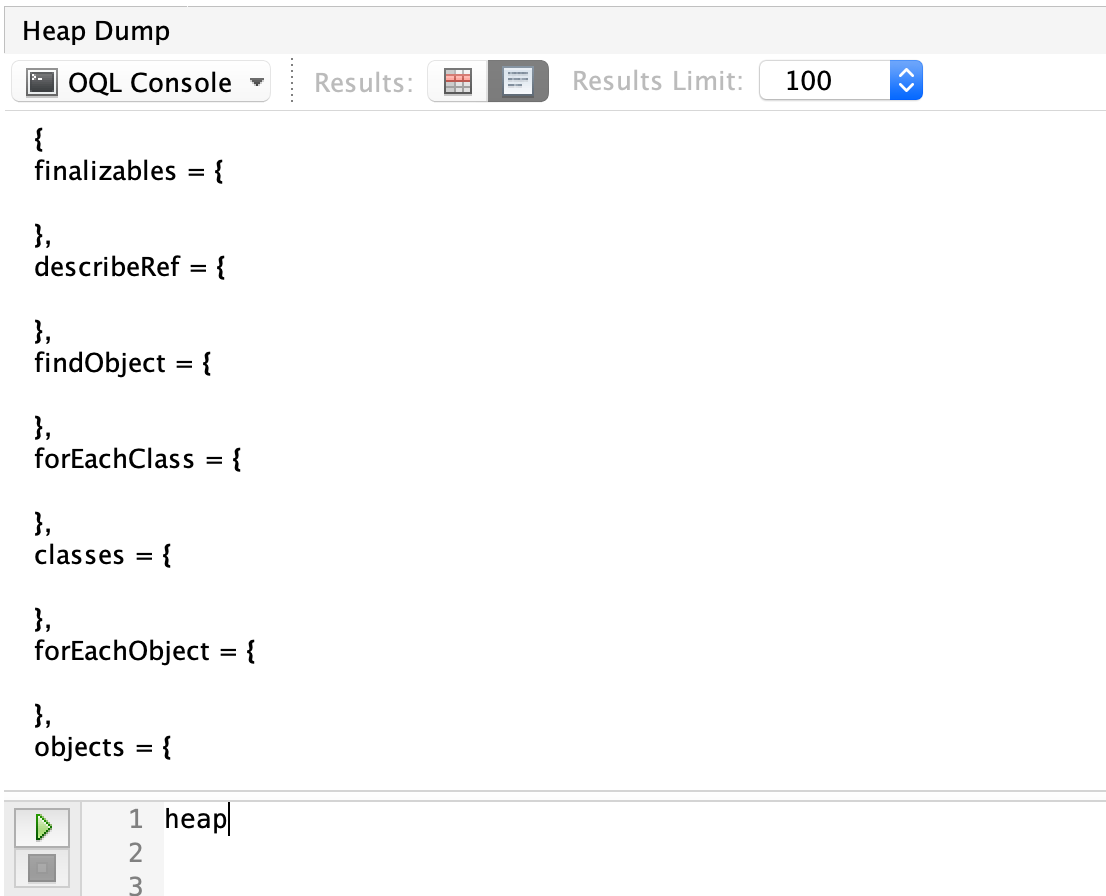
During our OQL searching, we’ll be using heap.objects to gather the set of objects we want.
We’ll start by limiting our objects to instances of cchesser.javaperf.workshop.data.ConferenceSession and assign it to a variable called sessions (which we’ll reference later).
var sessions = heap.objects('cchesser.javaperf.workshop.data.ConferenceSession');
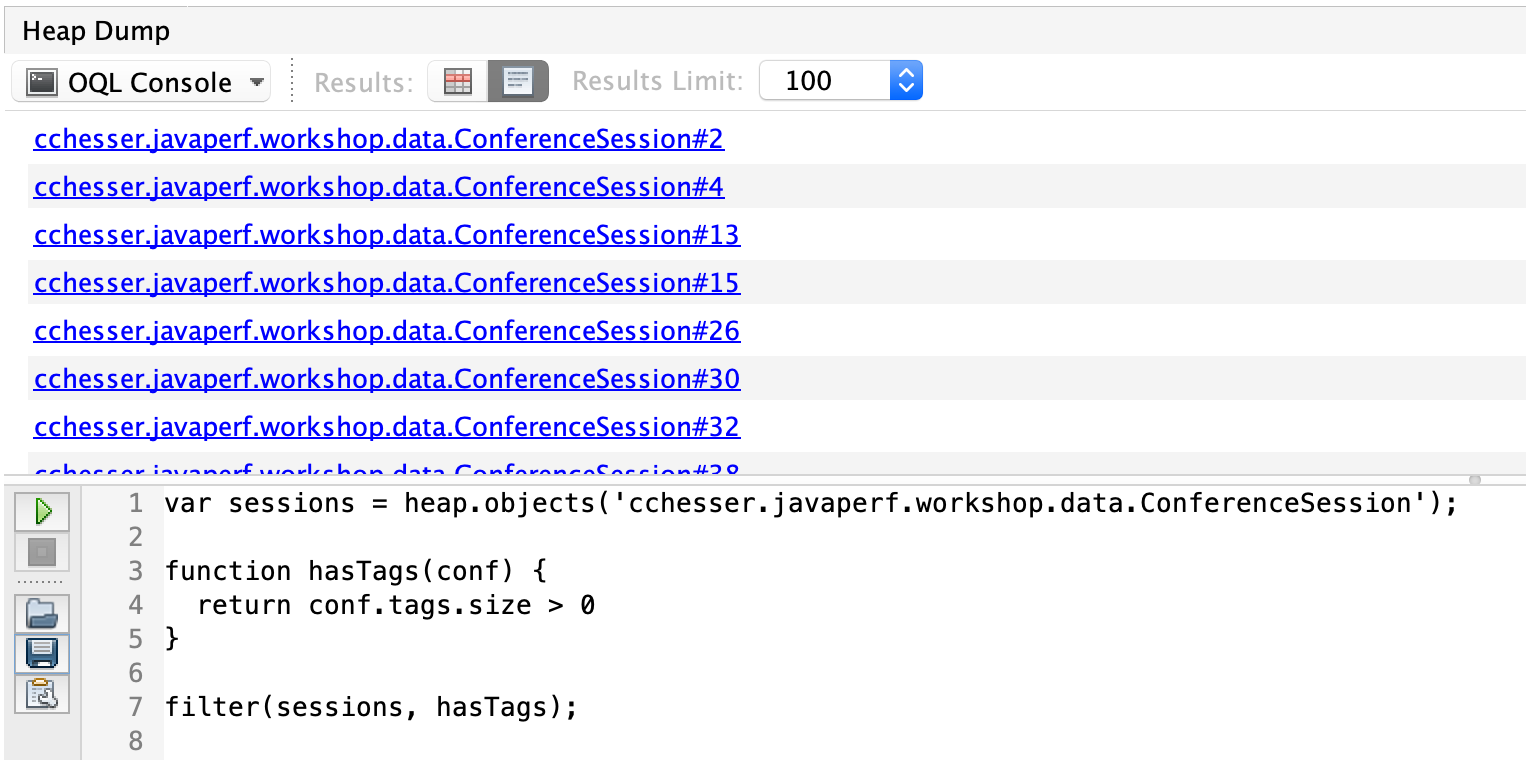
We’re going to find ConferenceSessions that which have tags, we’ll do that by writing a Javascript function to filter results which have tags. We’ll apply this filter to our sessions.
var sessions = heap.objects('cchesser.javaperf.workshop.data.ConferenceSession');

function hasTags(conf) {
  return conf.tags.size > 0
}

filter(sessions, hasTags);
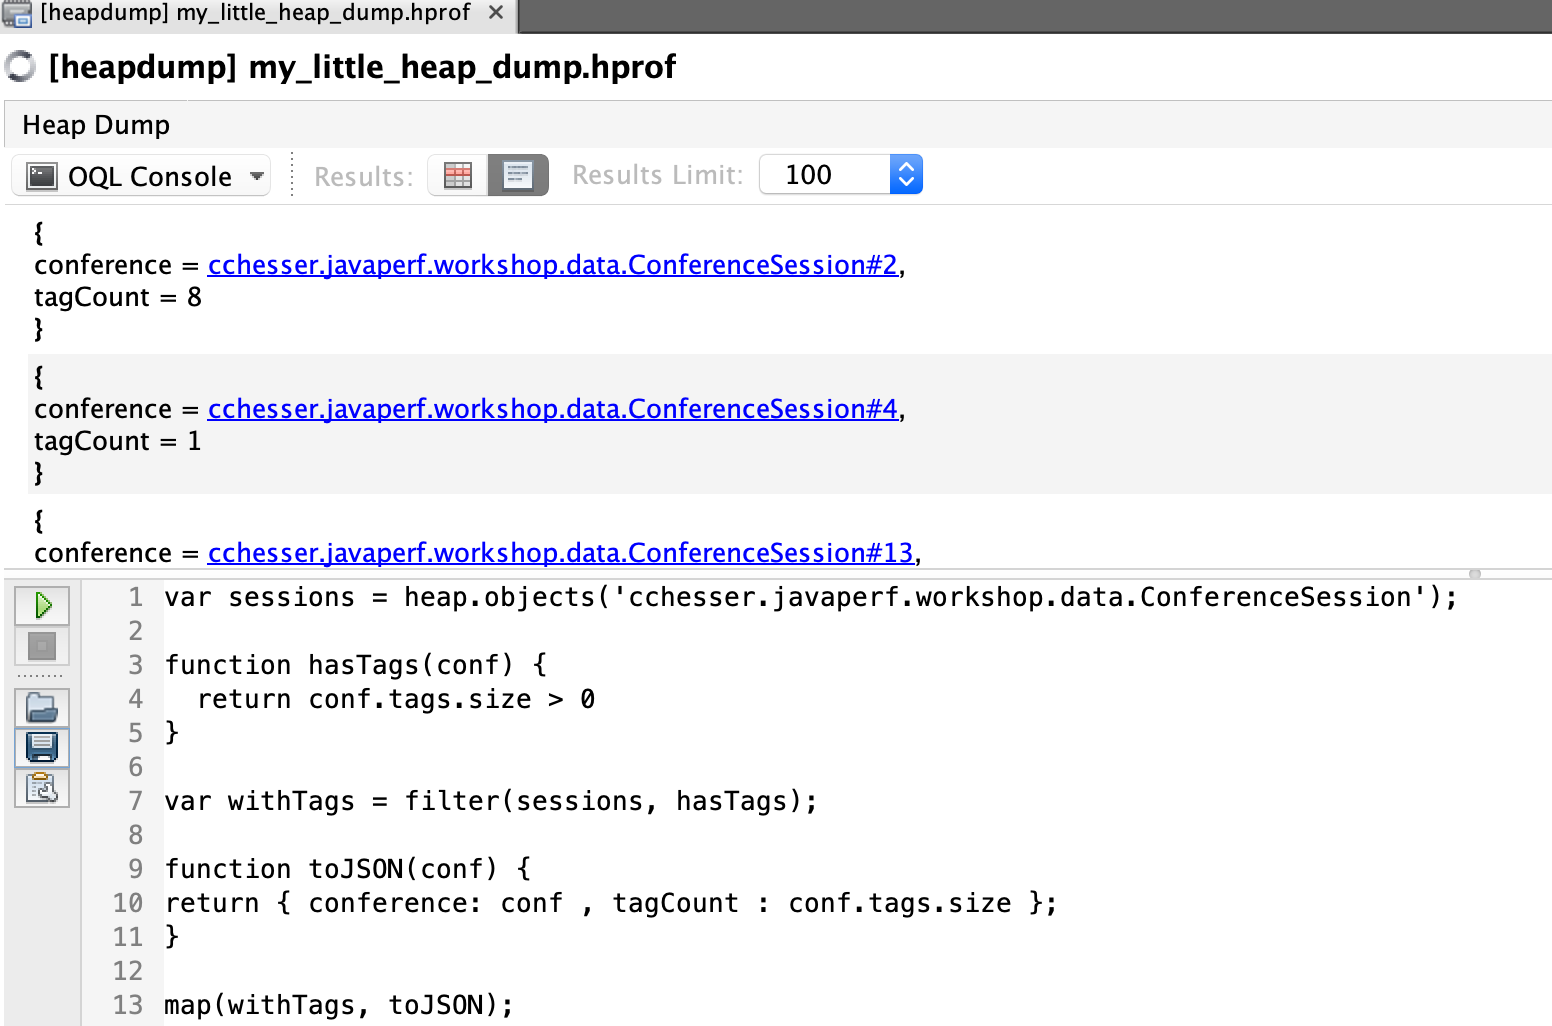
Take that previous query and further expand it to list it in JSON with the number of tags. It is often times convenient to have a reference to the object we’re interacting with, to more easily see the available fields.
var sessions = heap.objects('cchesser.javaperf.workshop.data.ConferenceSession');

function hasTags(conf) {
  return conf.tags.size > 0
}

var withTags = filter(sessions, hasTags);

function toJSON(conf) {
return { conference: conf , tagCount : conf.tags.size };
}

map(withTags, toJSON);
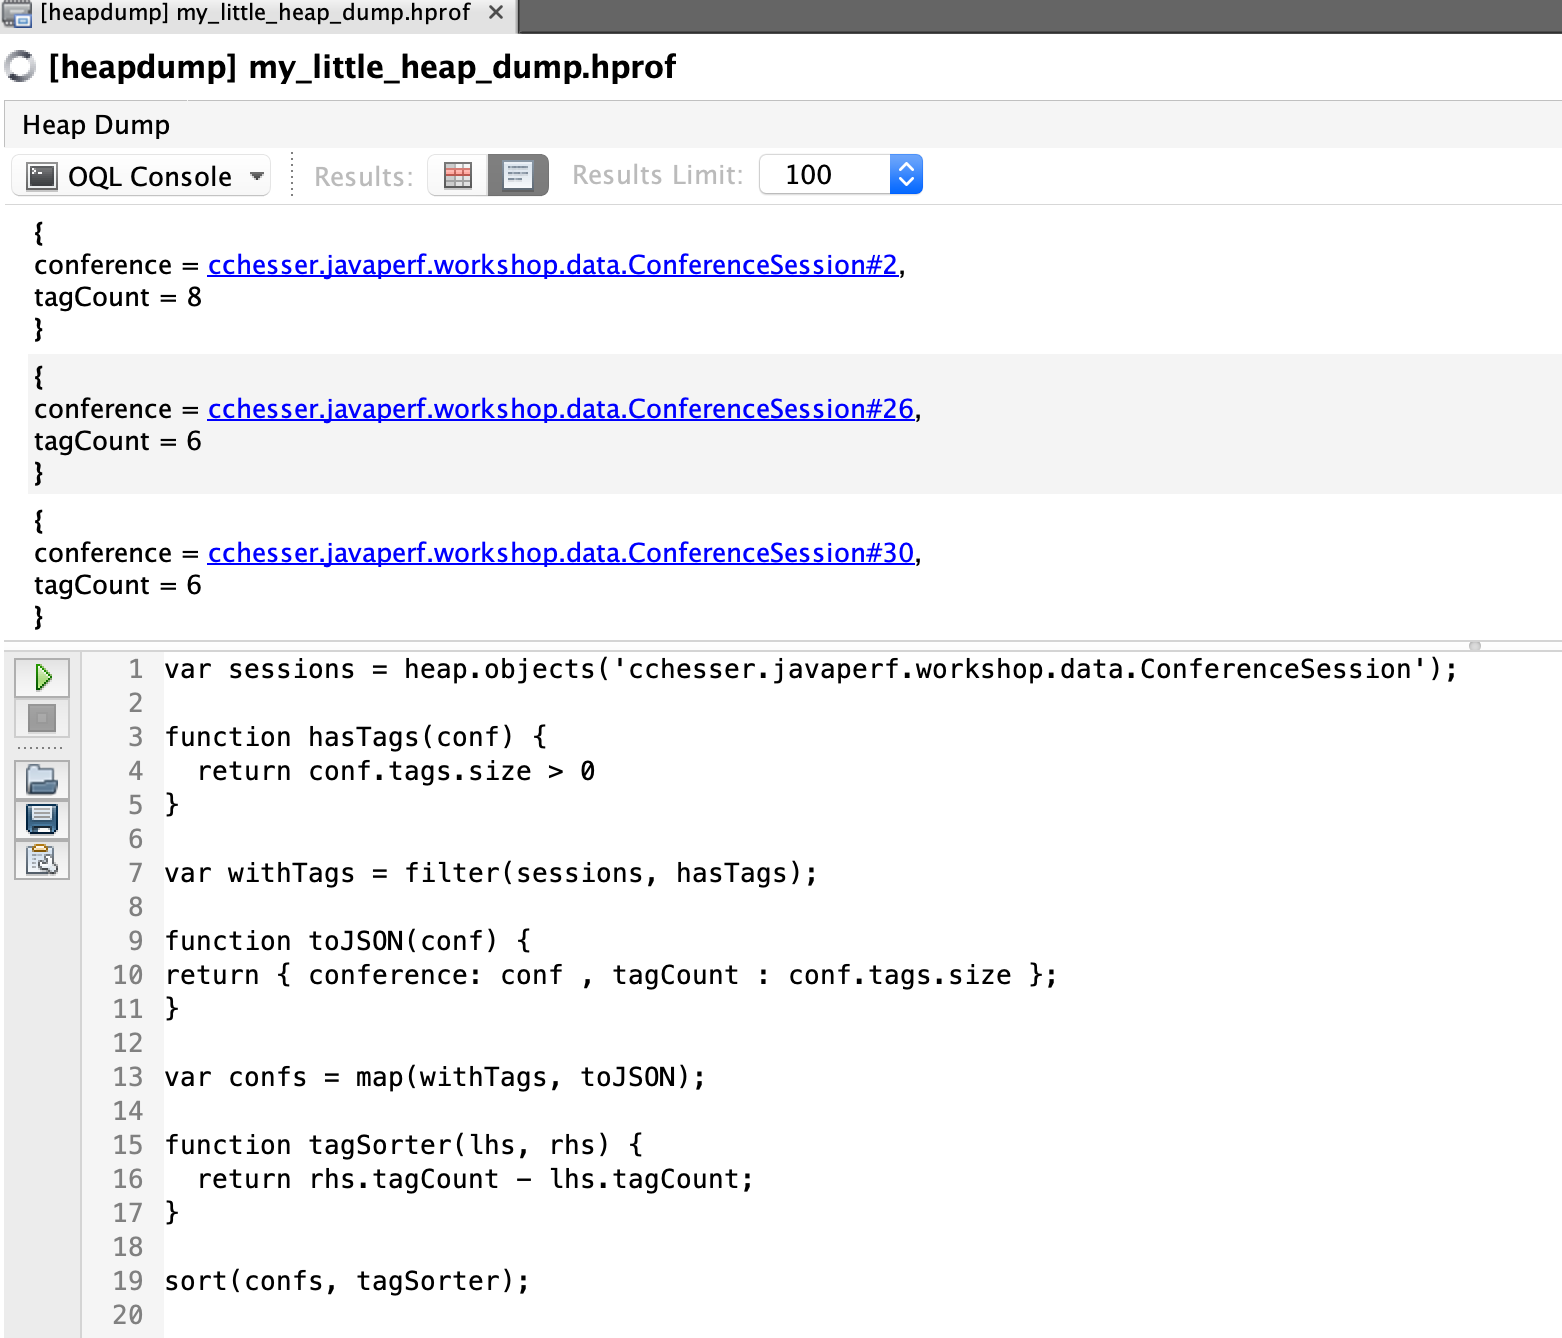
We can further expand this to sort the results, descending by number of tags, and list the tags in the results:
var sessions = heap.objects('cchesser.javaperf.workshop.data.ConferenceSession');

function hasTags(conf) {
  return conf.tags.size > 0
}

var withTags = filter(sessions, hasTags);

function toJSON(conf) {
  return { conference: conf , tagCount : conf.tags.size };
}

var confs = map(withTags, toJSON);

function tagSorter(lhs, rhs) {
  return rhs.tagCount - lhs.tagCount;
}

sort(confs, tagSorter);
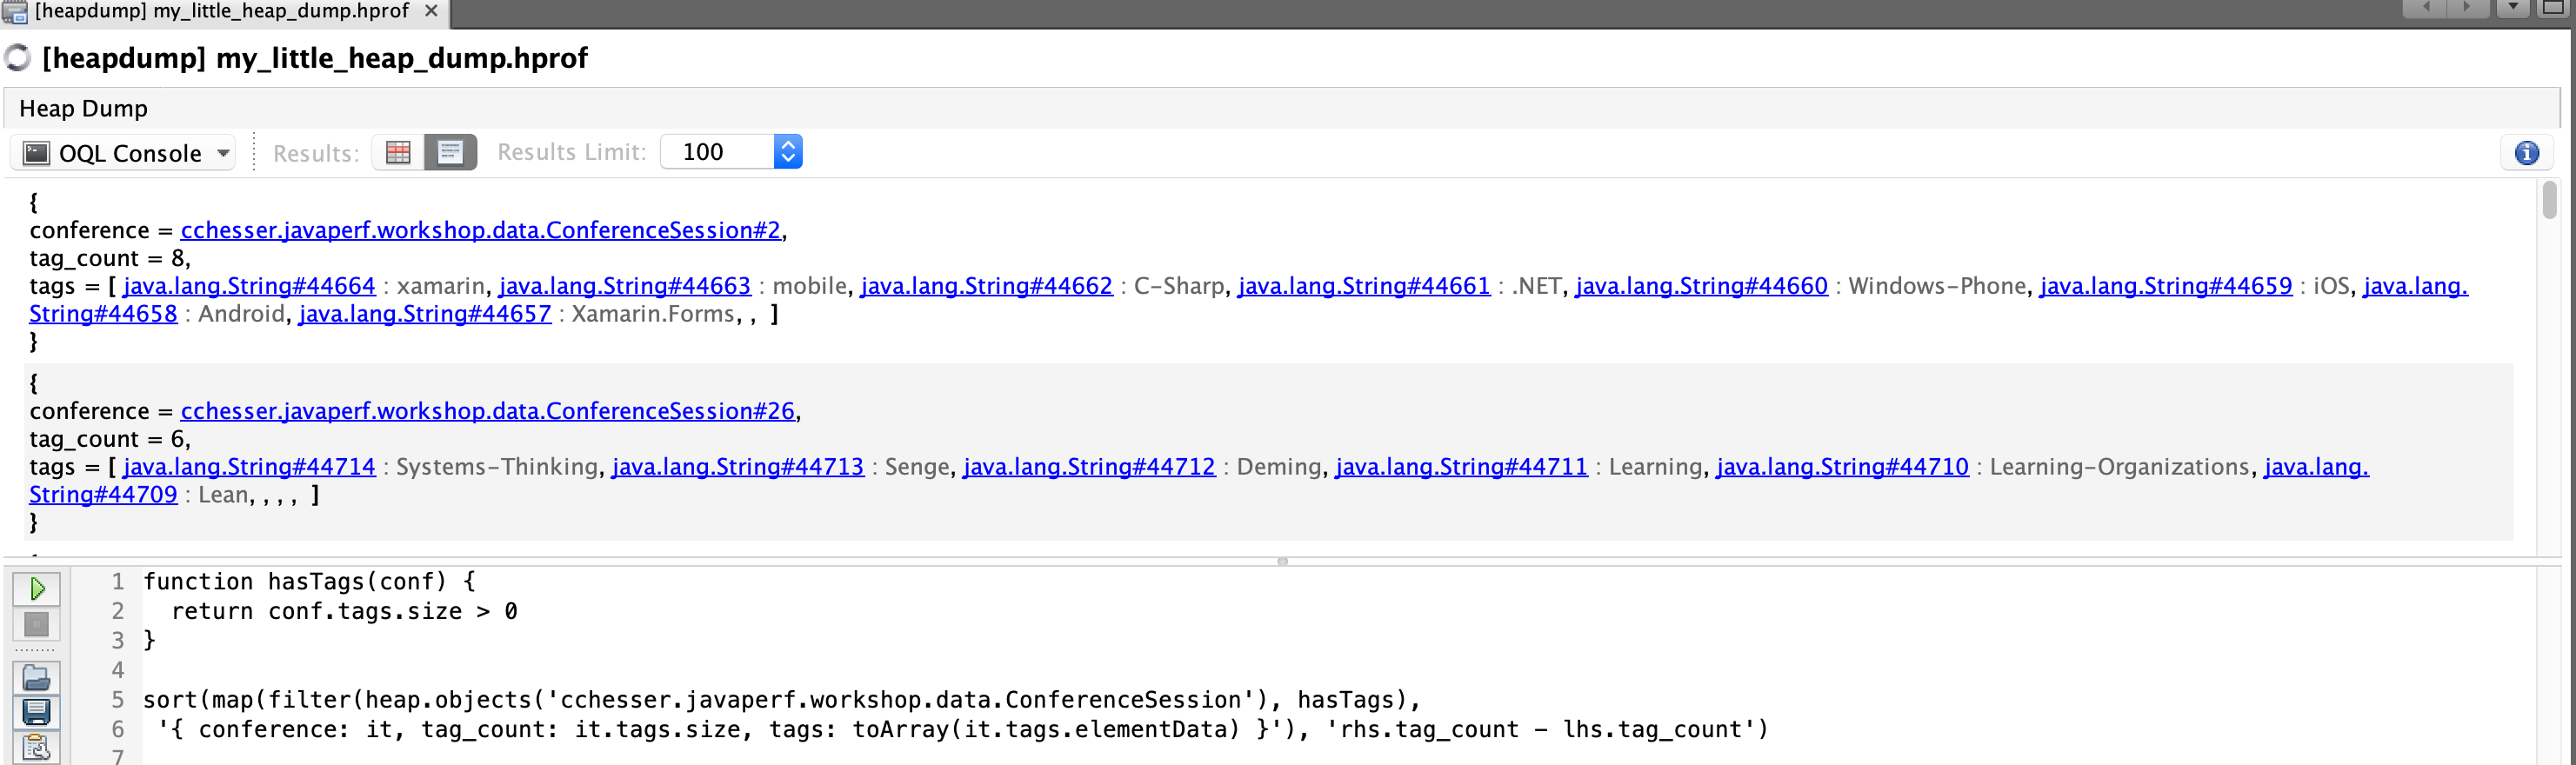
We could also inline most of this using the inline syntax:
function hasTags(conf) {
  return conf.tags.size > 0
}

sort(map(filter(heap.objects('cchesser.javaperf.workshop.data.ConferenceSession'), hasTags),
 '{ conference: it, tag_count: it.tags.size, tags: toArray(it.tags.elementData) }'), 'rhs.tag_count - lhs.tag_count')
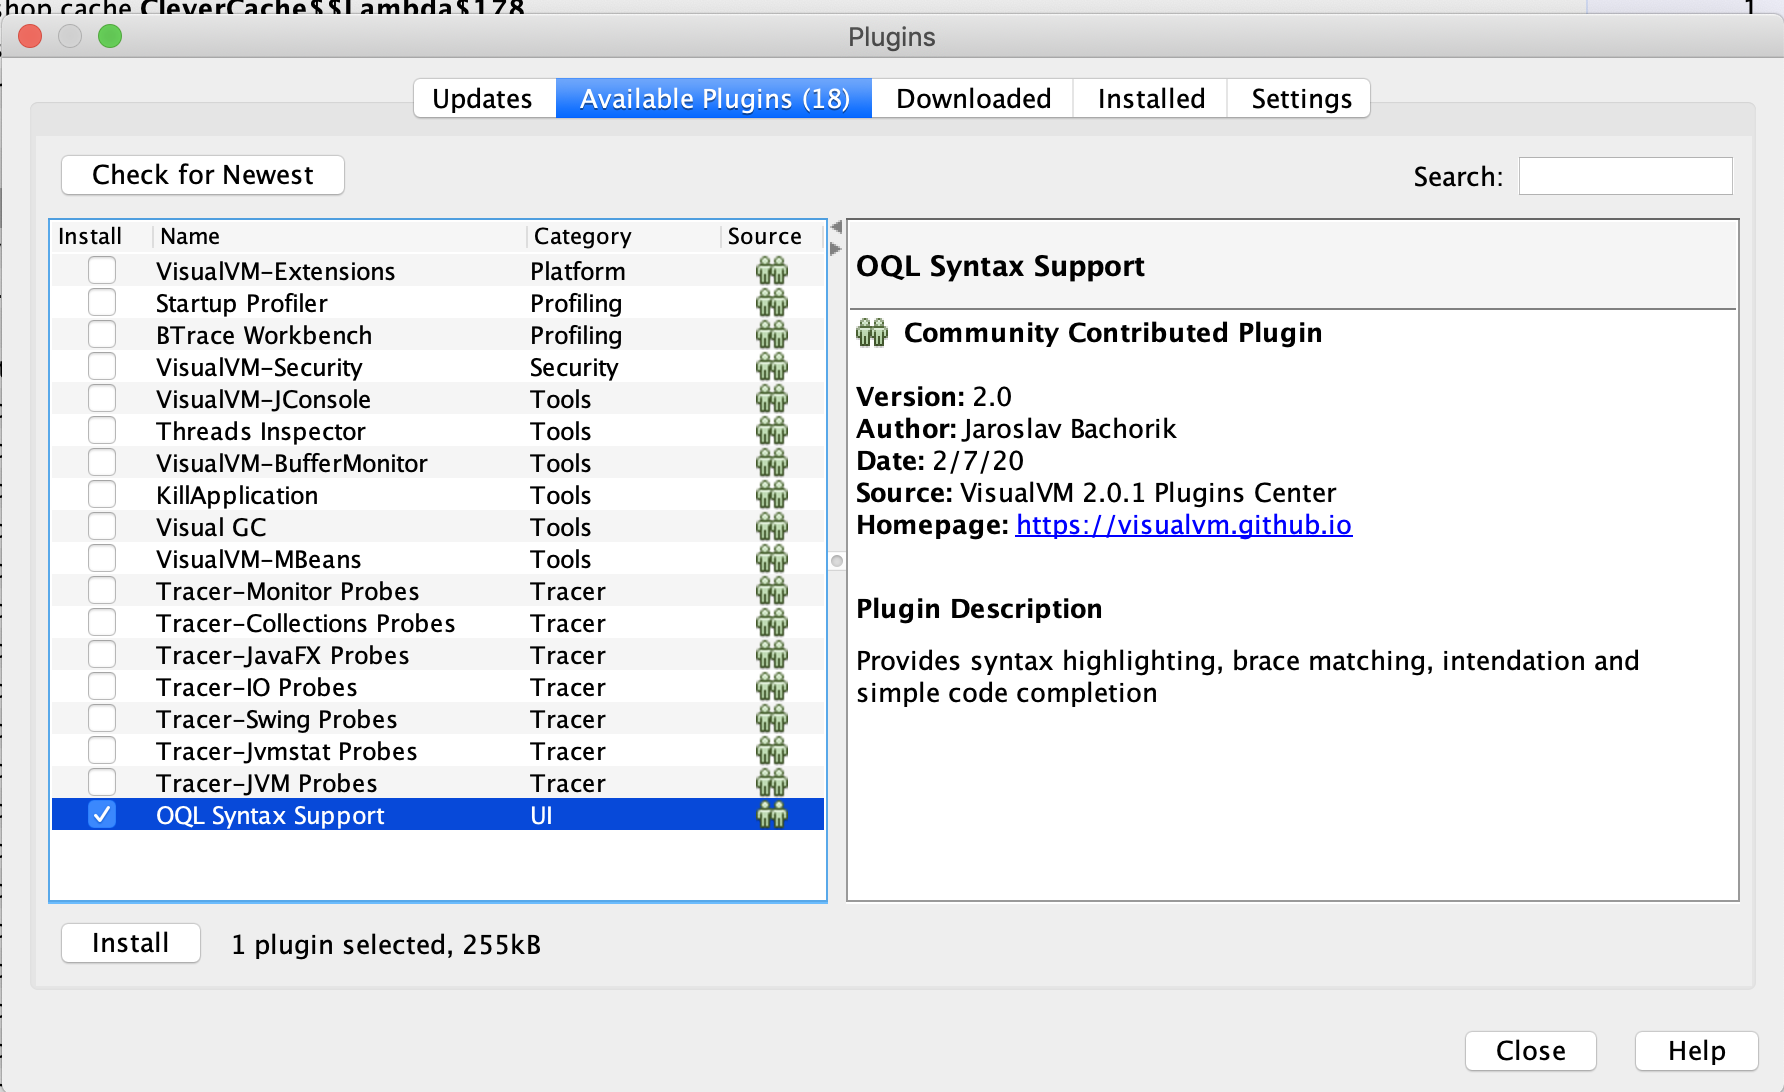
Useful Plugins
OQL Syntax Support
This plugin adds some auto complete and syntax highlighting to the OQL Console
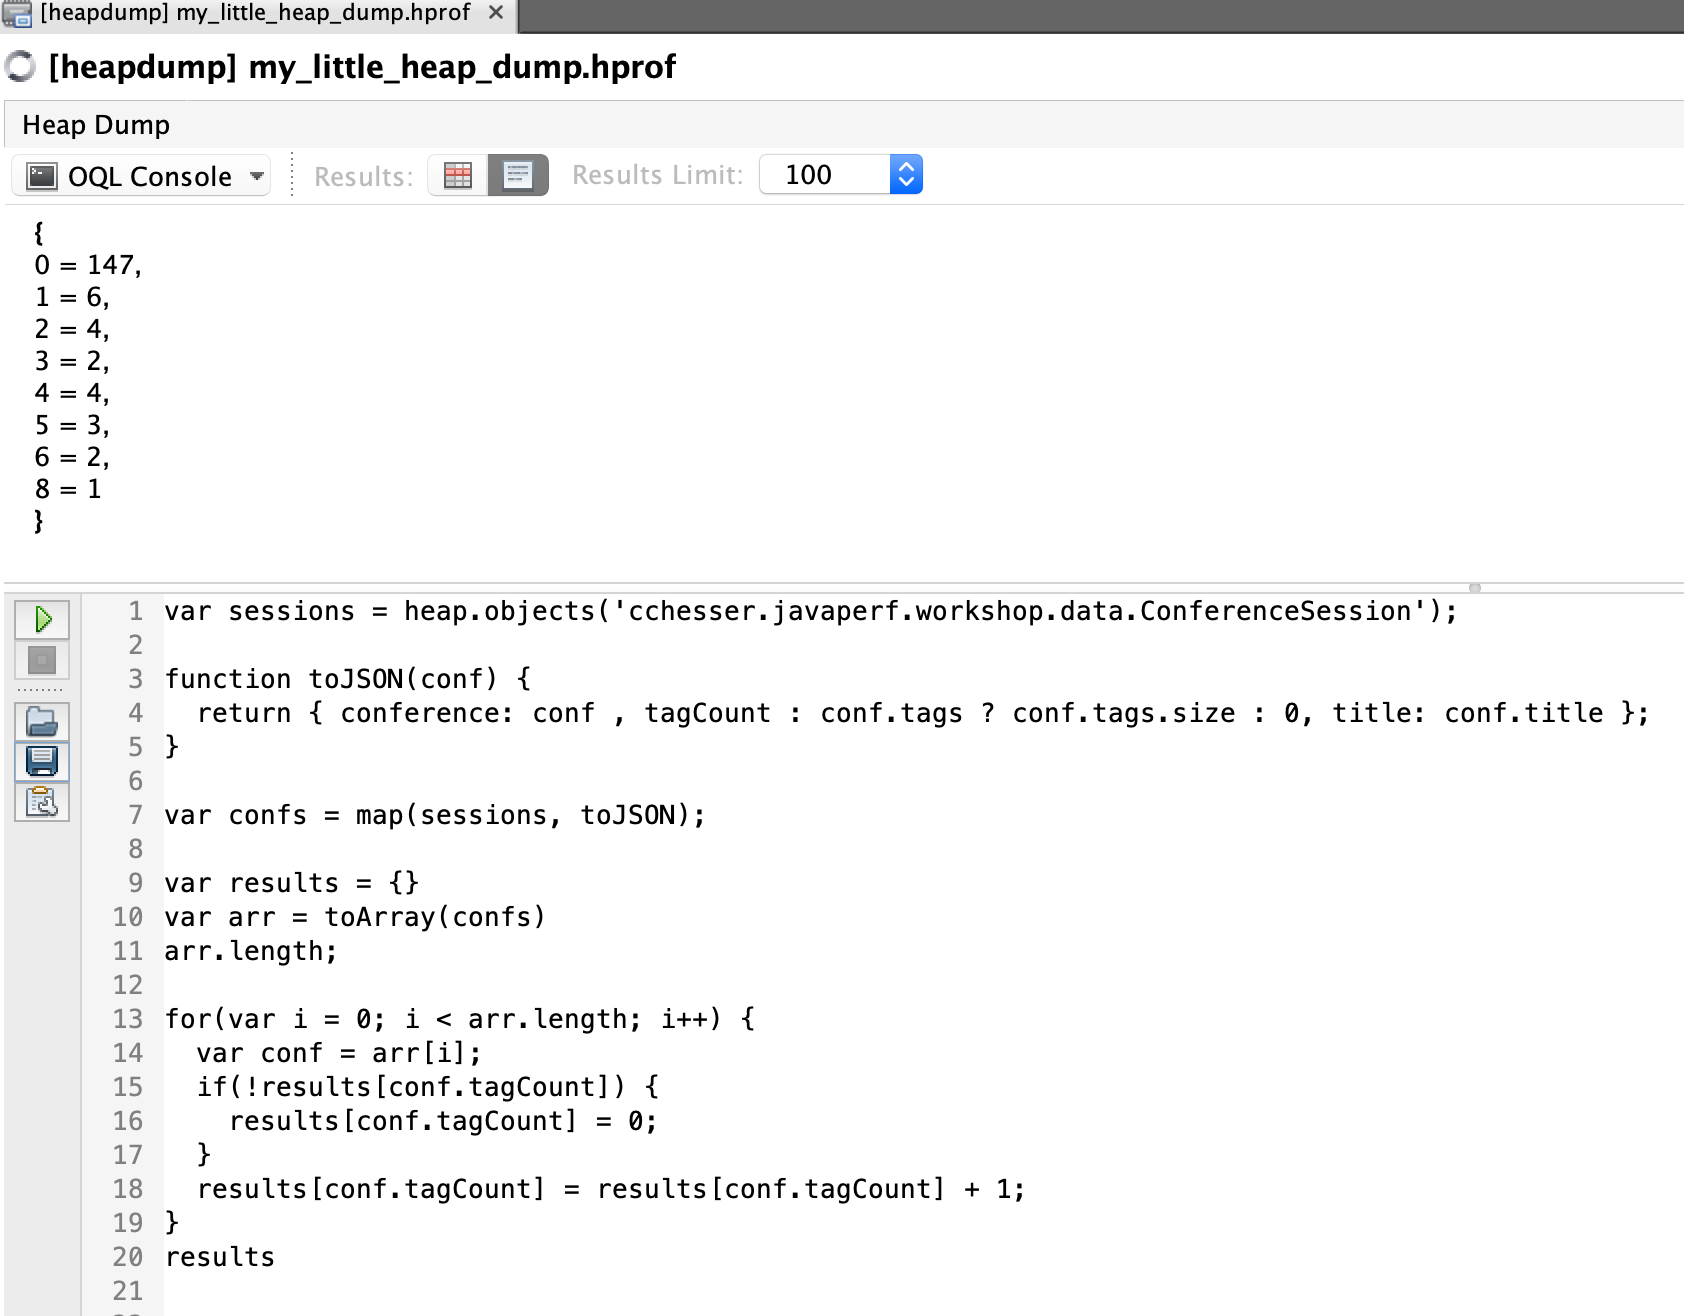
Challenge
Apply what you’ve learned about OQL in this section and write some javascript that will show the distribution of tag counts in our conference sessions (similar to what we did with calcite mat.)
Sample Solutions
JSON Output
This solution will return the result as a JSON object.
var sessions = heap.objects('cchesser.javaperf.workshop.data.ConferenceSession');

function toJSON(conf) {
  return { conference: conf , tagCount : conf.tags ? conf.tags.size : 0, title: conf.title };
}

var confs = map(sessions, toJSON);

var results = {}
var arr = toArray(confs)
arr.length;

for(var i = 0; i < arr.length; i++) {
  var conf = arr[i];
  if(!results[conf.tagCount]) {
    results[conf.tagCount] = 0;
  }
  results[conf.tagCount] = results[conf.tagCount] + 1;
}
results
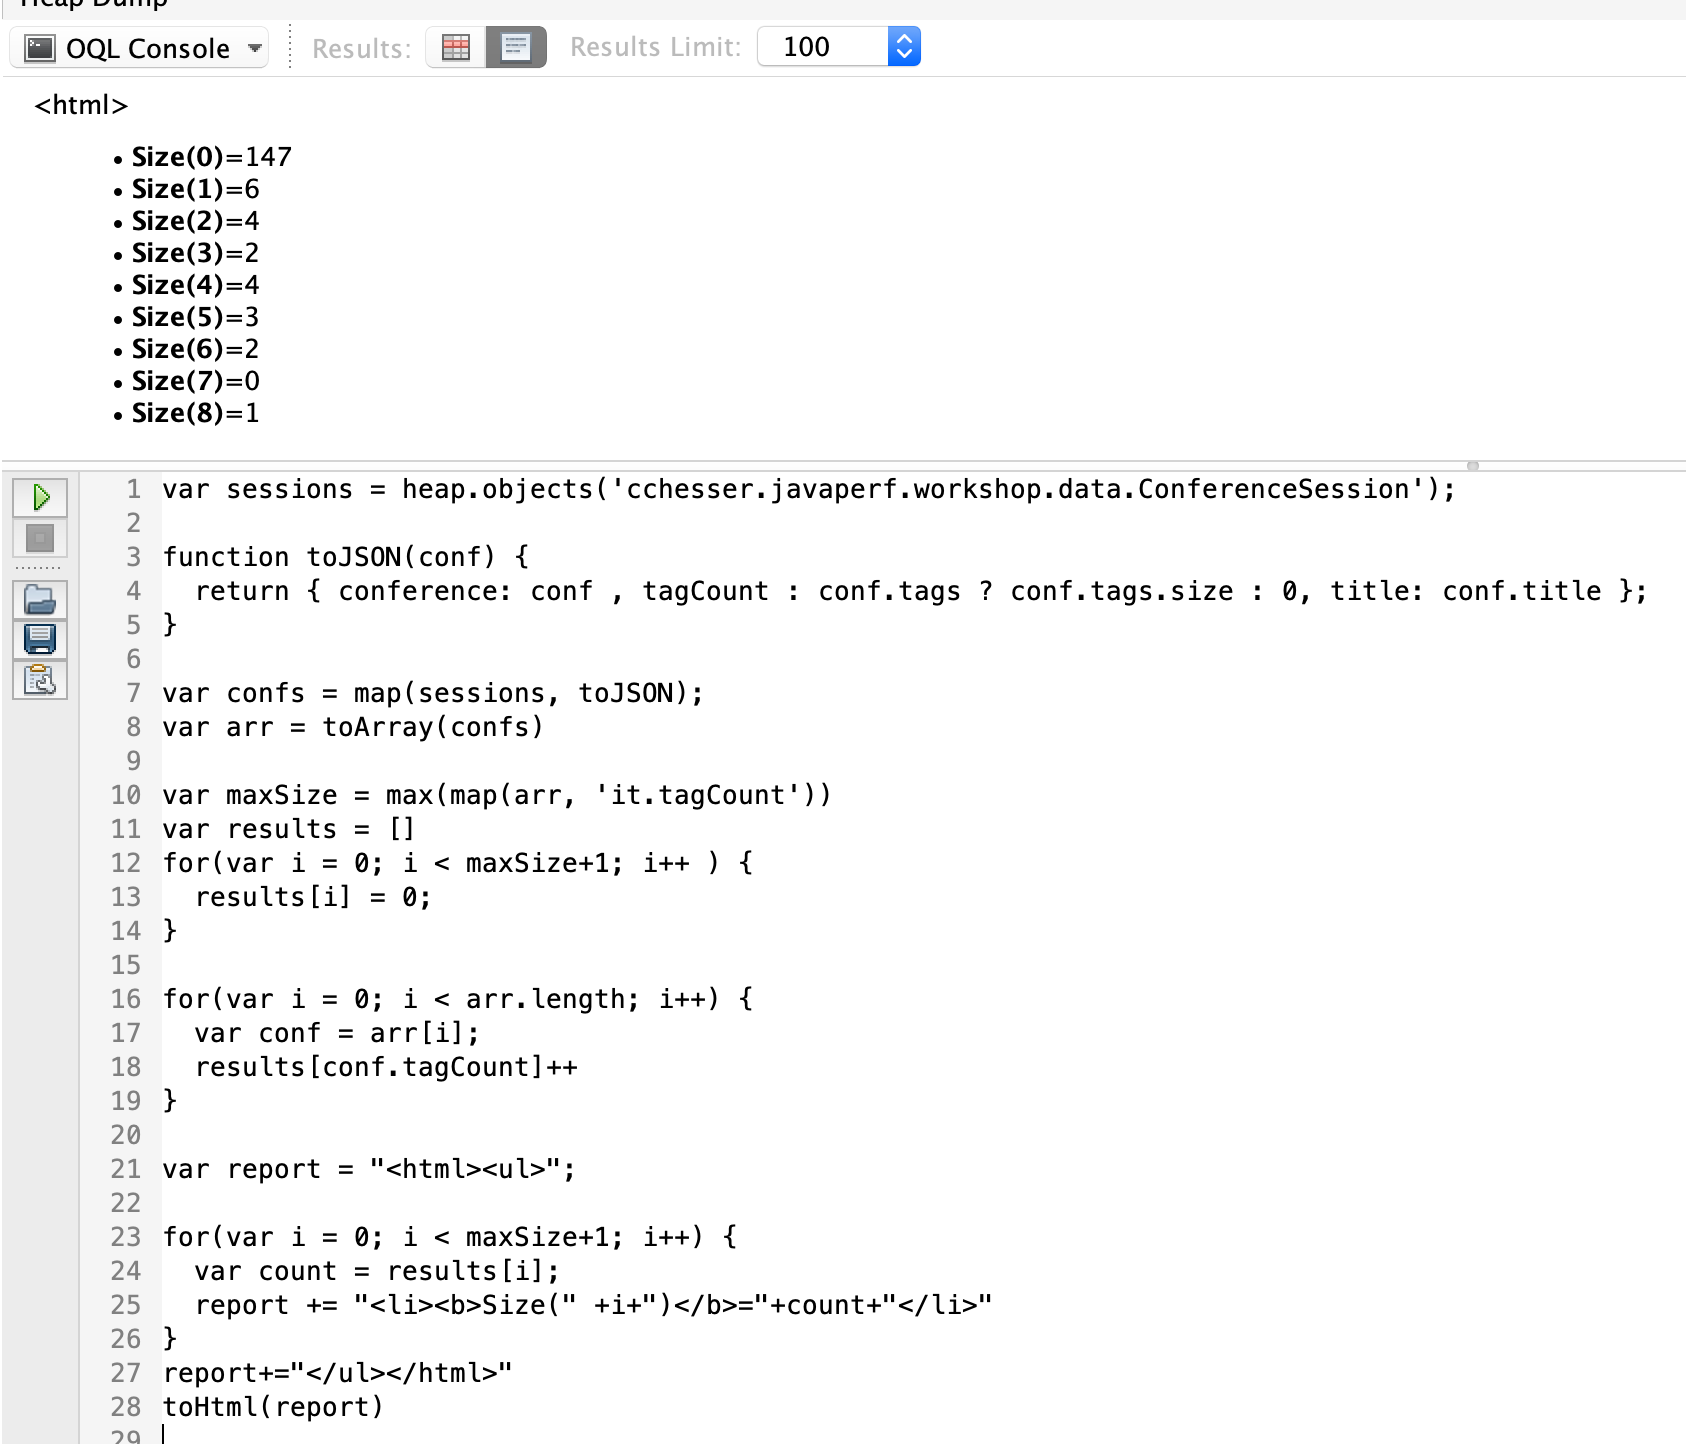
HTML Output
This solution will return the result as an HTML <ul>.
var sessions = heap.objects('cchesser.javaperf.workshop.data.ConferenceSession');

function toJSON(conf) {
  return { conference: conf , tagCount : conf.tags ? conf.tags.size : 0, title: conf.title };
}

var confs = map(sessions, toJSON);
var arr = toArray(confs)

var maxSize = max(map(arr, 'it.tagCount'))
var results = []
for(var i = 0; i < maxSize+1; i++ ) {
  results[i] = 0;
}

for(var i = 0; i < arr.length; i++) {
  var conf = arr[i];
  results[conf.tagCount]++
}

var report = "<html><ul>";

for(var i = 0; i < maxSize+1; i++) {
  var count = results[i];
  report += "<li><b>Size(" +i+")</b>="+count+"</li>"
}
report+="</ul></html>"
toHtml(report)
In the next section, we'll test our knwolege.
Memory Challenge5.6 - Memory Challenge
The provided WorkshopService has an intentional memory problem, use the previous sections as reference to try to pin point it.
Tips
- With the Dominator Tree (Eclipse MAT) determine what object would free up the most memory (if we could get rid of it)
- With the Histogram (Eclipse MAT) determine what type of object has the most instances
- Using the Incoming Objects view, find out what’s pointing to them.
Once you’ve found the large object, look through it’s properties and determine why this object holds on to so many other objects.
Solution
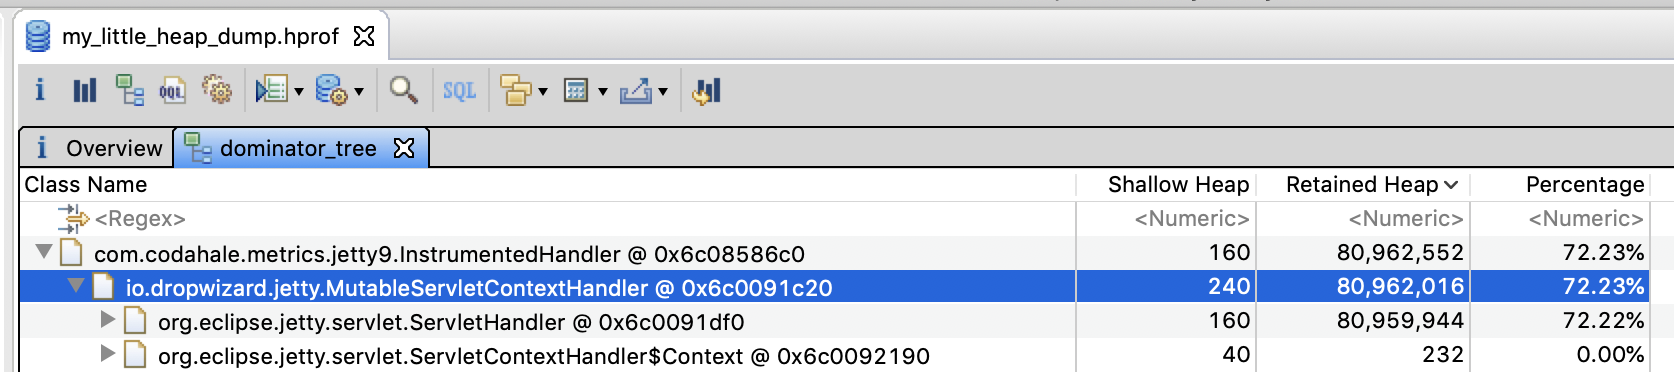
This section contains a solution, make sure you’ve given things a shot before spoiling the fun.Dominator Tree
A first glance at the dominator tree will point us to a io.dropwizard.jetty.MutableServletContextHandler, which is something controlled by the DropWizard framework. Let’s dig through its references until we find some classes in the cchesser package.
The first instance of a class we “own” is cchesser.javaperf.workshop.resources.WorkshopResource
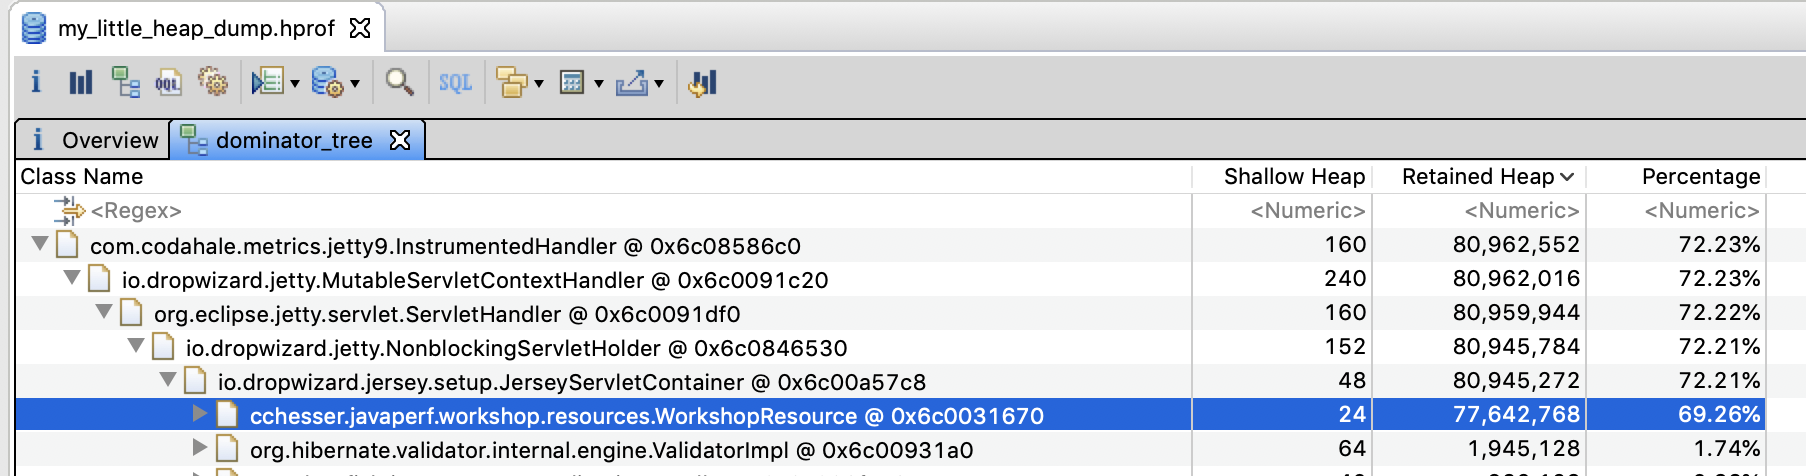
Let’s look at it’s properties a bit, and we’ll find a cchesser.javaperf.workshop.cache.CleverCache reference with about 70% of the memory consumption.
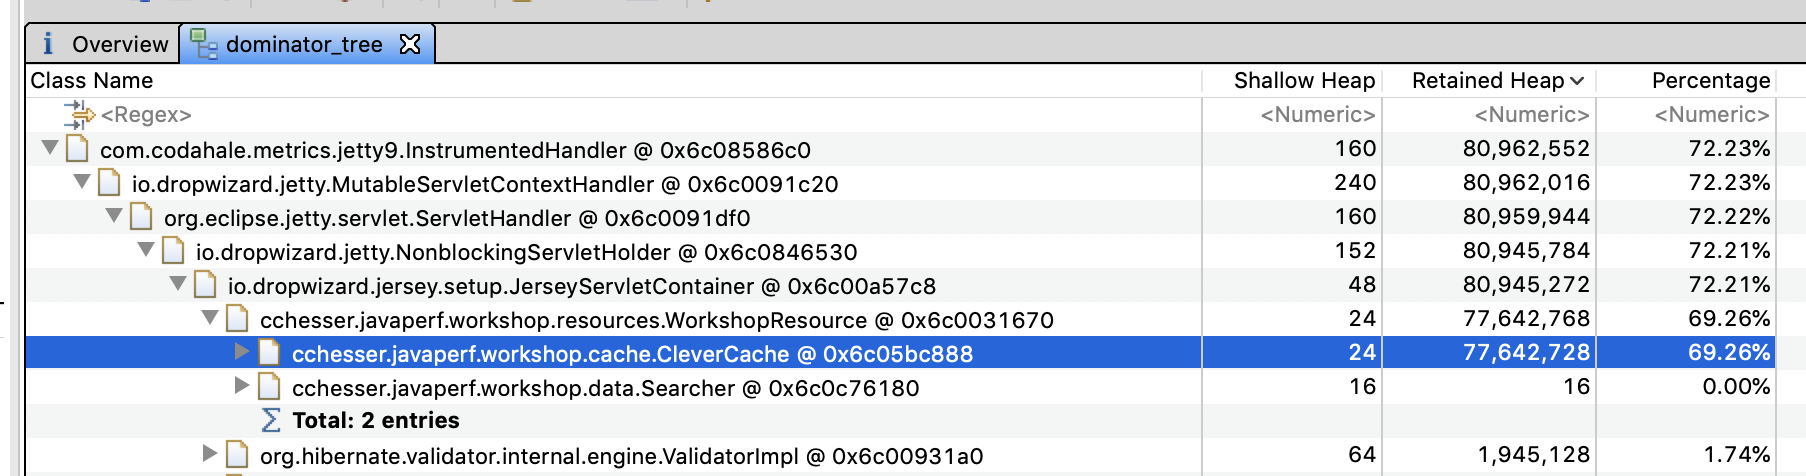
We’ll look at its properties in a bit more detail in the following sections.
Histogram View
A first glance at the Histogram View (sorted by retained heap), shows us about 2,000,000 instances of cchesser.javaperf.workshop.data.Searcher$SearchResultElement
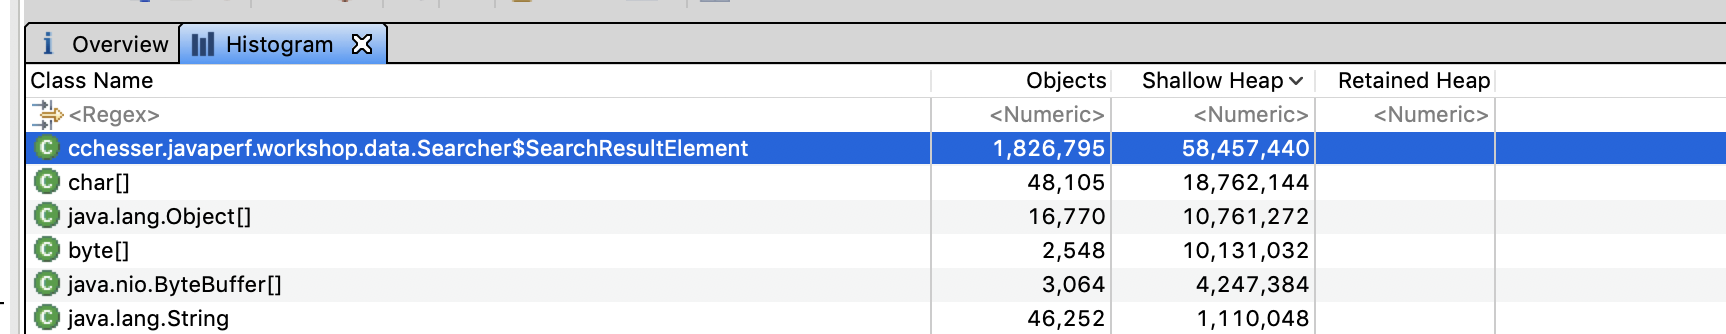
Looking through the references to an instance of this type, we end up being referenced by the data field in cchesser.javaperf.workshop.cache.CleverCache$CacheEntry
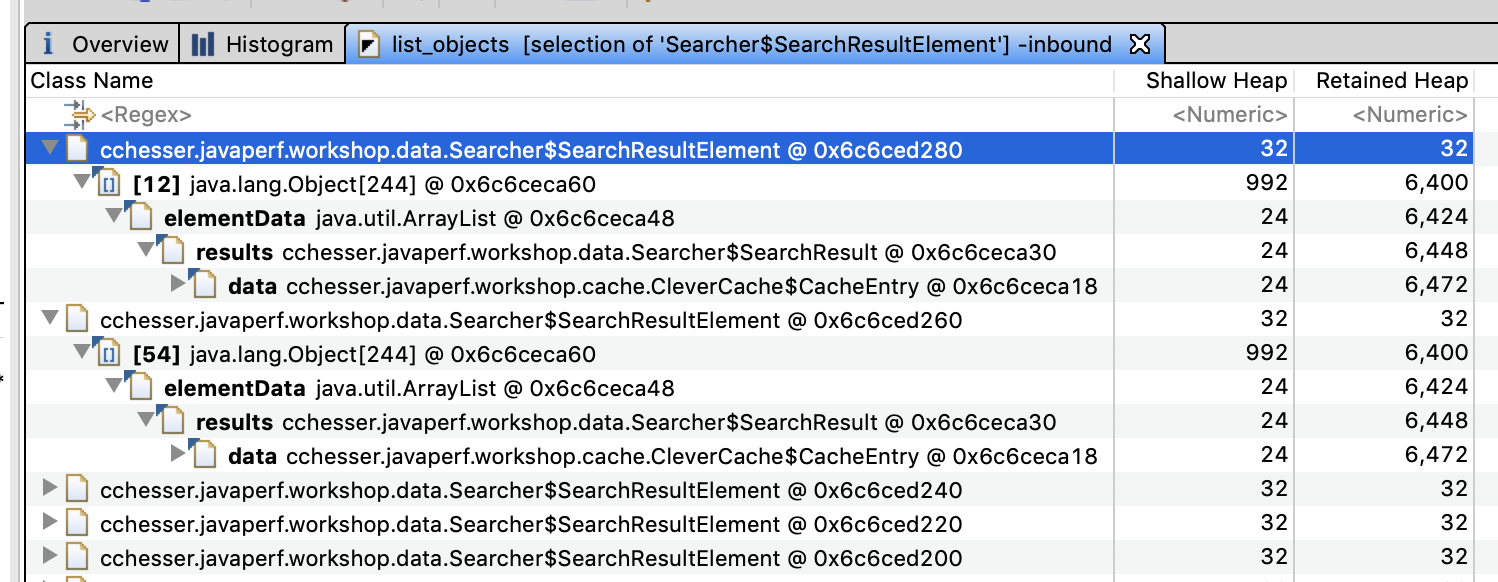
We can further inspect the Incoming References for a particular entry, and see what is pointing to it, tracing it back to something we own:
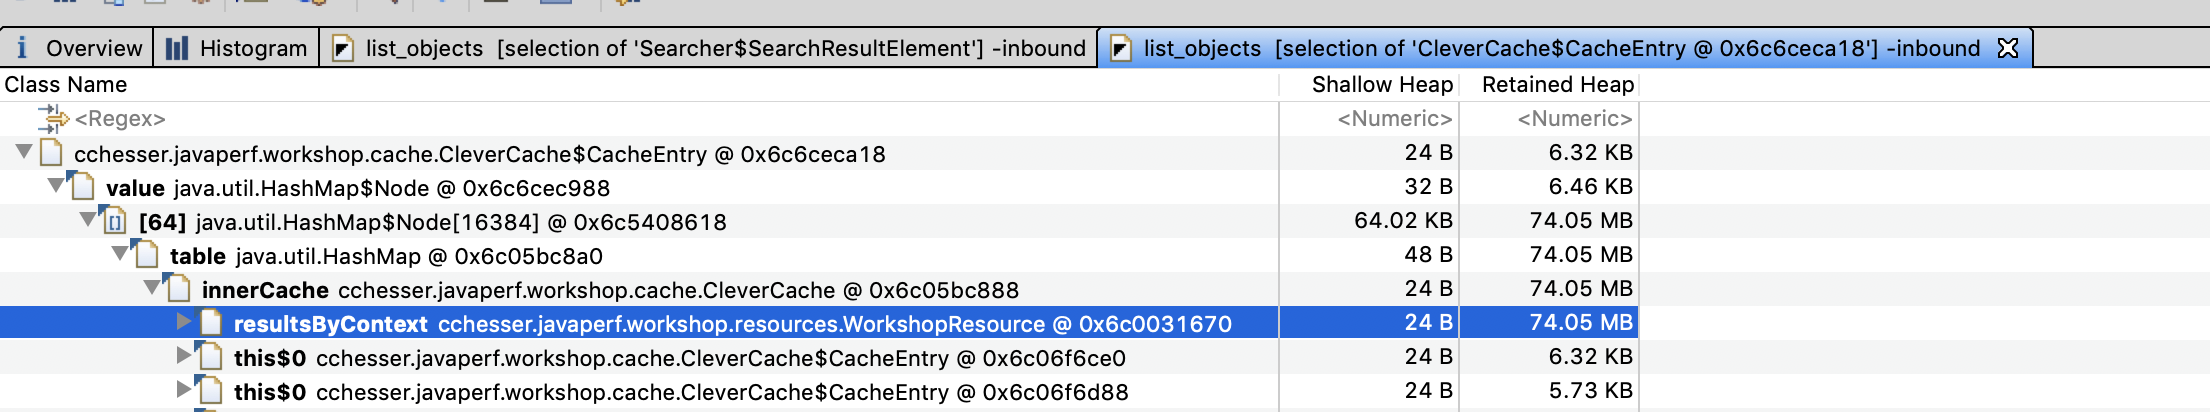
Once again, we’ve ended up at cchesser.javaperf.workshop.resources.WorkshopResource, specifically a field called resultsByContext.
We’ll take a closer look at this cchesser.javaperf.workshop.cache.CleverCache object.
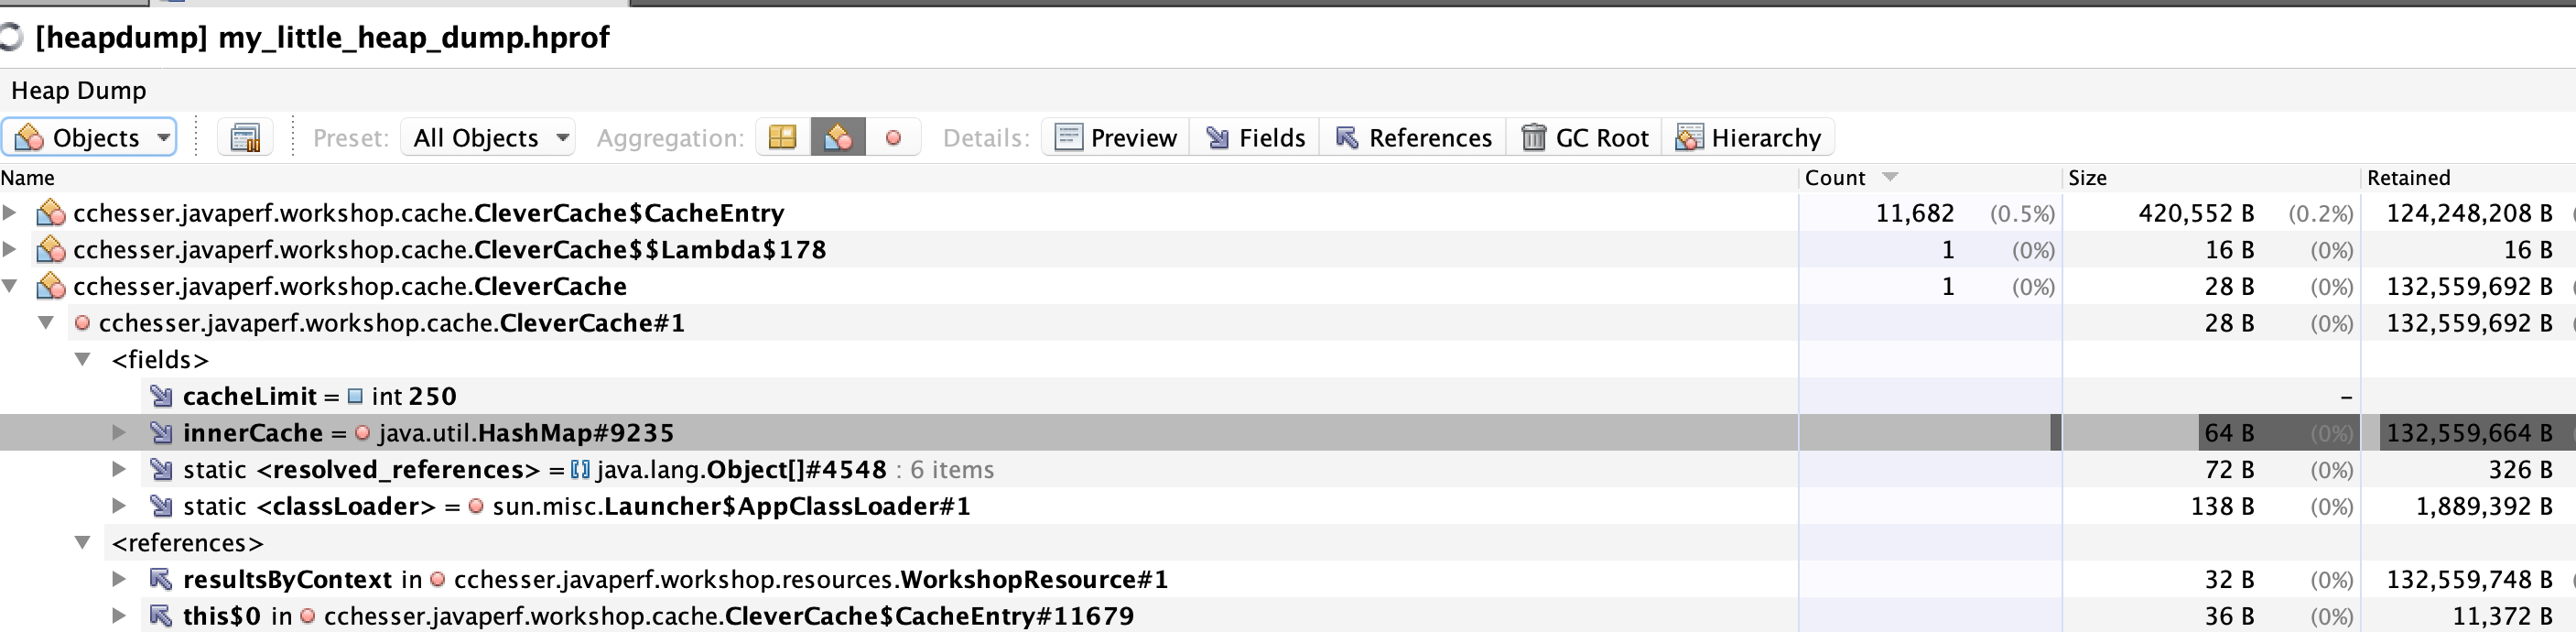
Inspecting Clever Cache
First, lets determine how many instances of cchesser.javaperf.workshop.cache.CleverCache we have. We’ve found a single instance that is about 70Mb (in our sample dump), so let’s double check if there’s more of these.
We can do that in a couple of ways:
- Use the histogram view to filter on
CleverCache
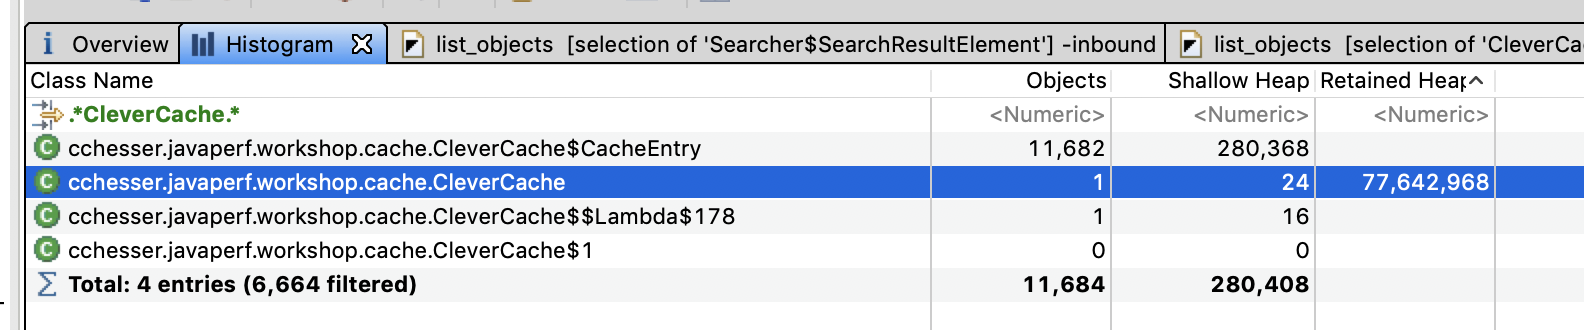
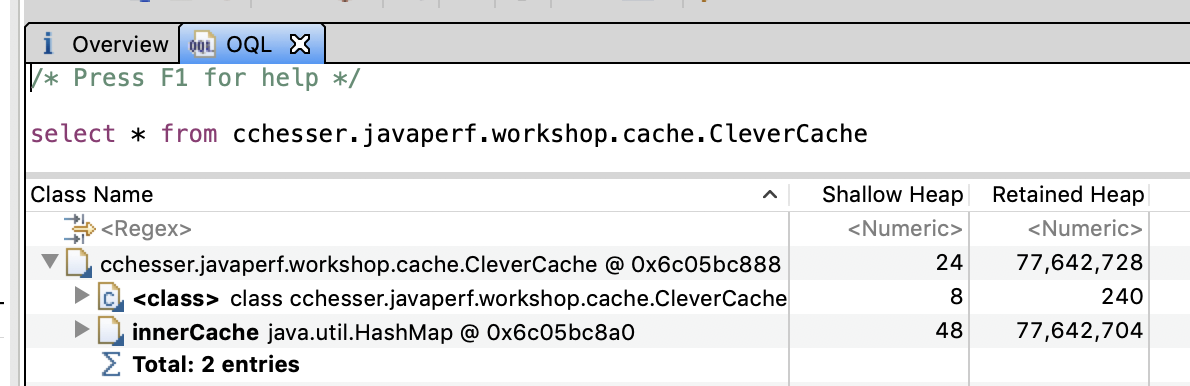
- Use OQL to find instances of that object:
select * from cchesser.javaperf.workshop.cache.CleverCache
Fields/References
We can find the fields and references for an instance using either Eclipse MAT or VisualVM.
In Eclipse Mat, the fields for an instance display in an Attributes tab
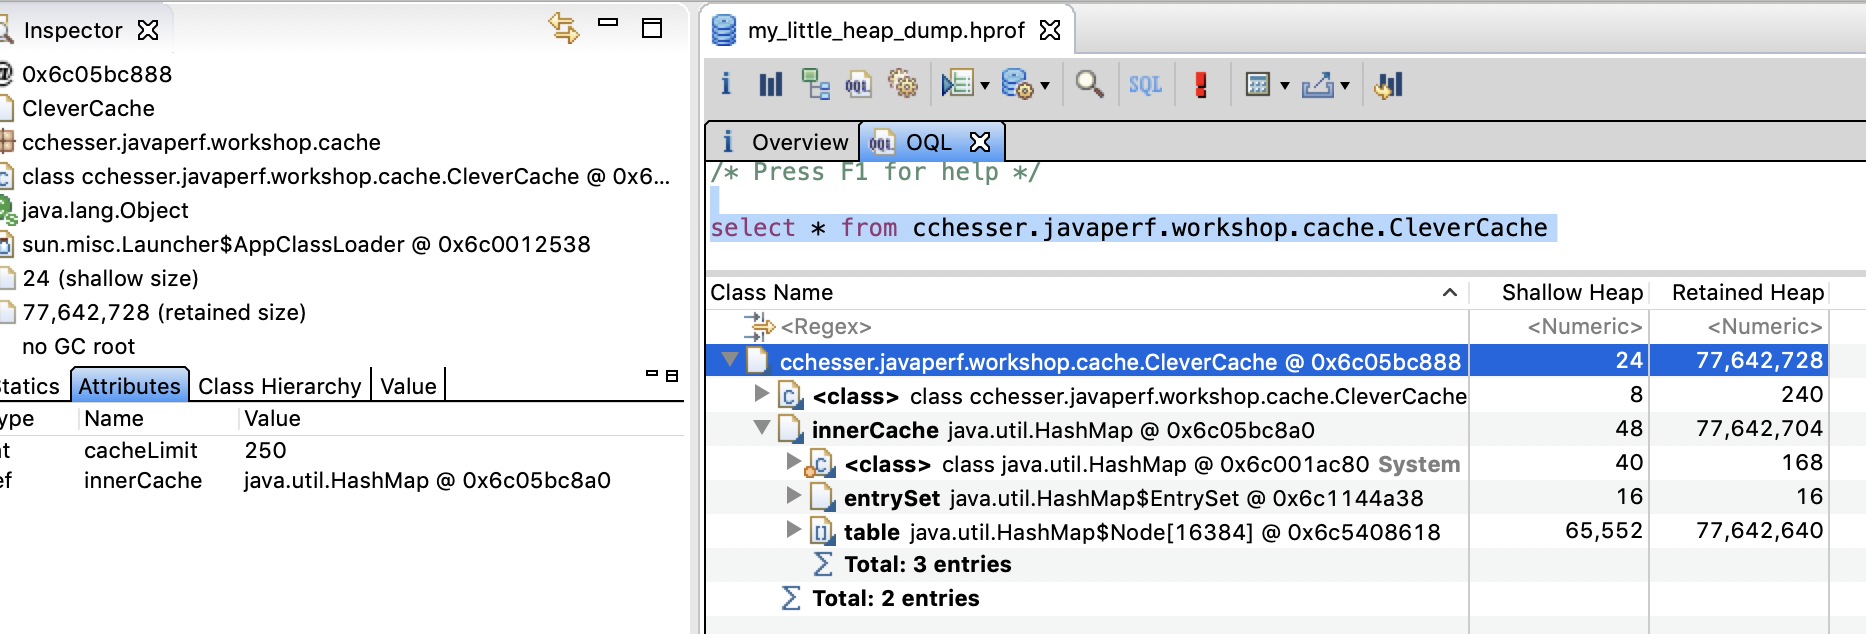
In VisualVM, we can load the Objects view and apply a filter on class name to then inspect the fields and references
Looking at the properties, we find that there’s a cacheLimit of 250. Let’s find out exactly how many entries are in the cache (the innerCache field).
Finding Sizes
Let’s write a query that will show us what the count of entries in the cache is.
- For our query, we need to pull the
cacheLimitandsizeof theinnerCachemap,
We can do this a few ways:
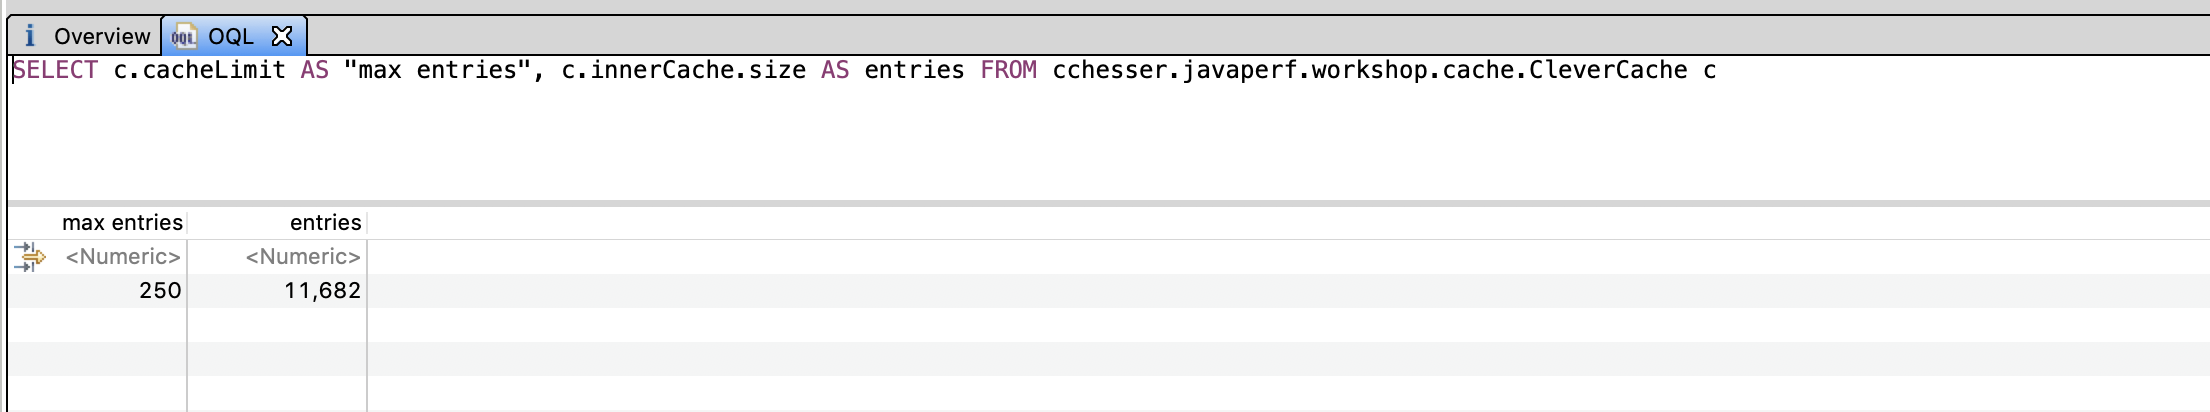
Eclipse MAT / OQL
we can do that with the following query:
SELECT c.cacheLimit AS "max entries", c.innerCache.size AS entries FROM cchesser.javaperf.workshop.cache.CleverCache c
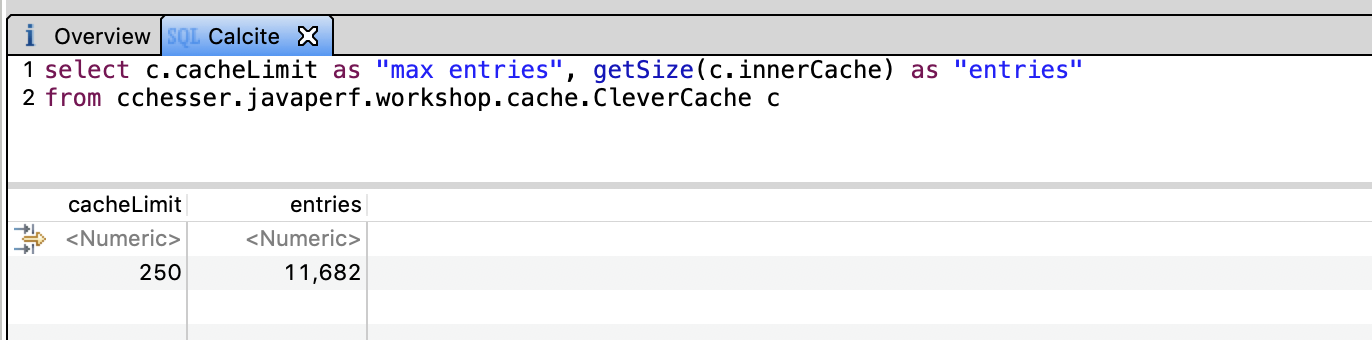
Eclipse MAT / Calcite
select c.cacheLimit as "max entries", getSize(c.innerCache) as "entries"
from cchesser.javaperf.workshop.cache.CleverCache c
VisualVM / OQL
var caches = heap.objects("cchesser.javaperf.workshop.cache.CleverCache")

function report(cache) {
  return { maxEntries: cache.cacheLimit, entries: cache.innerCache.size }
}

map(caches, report)
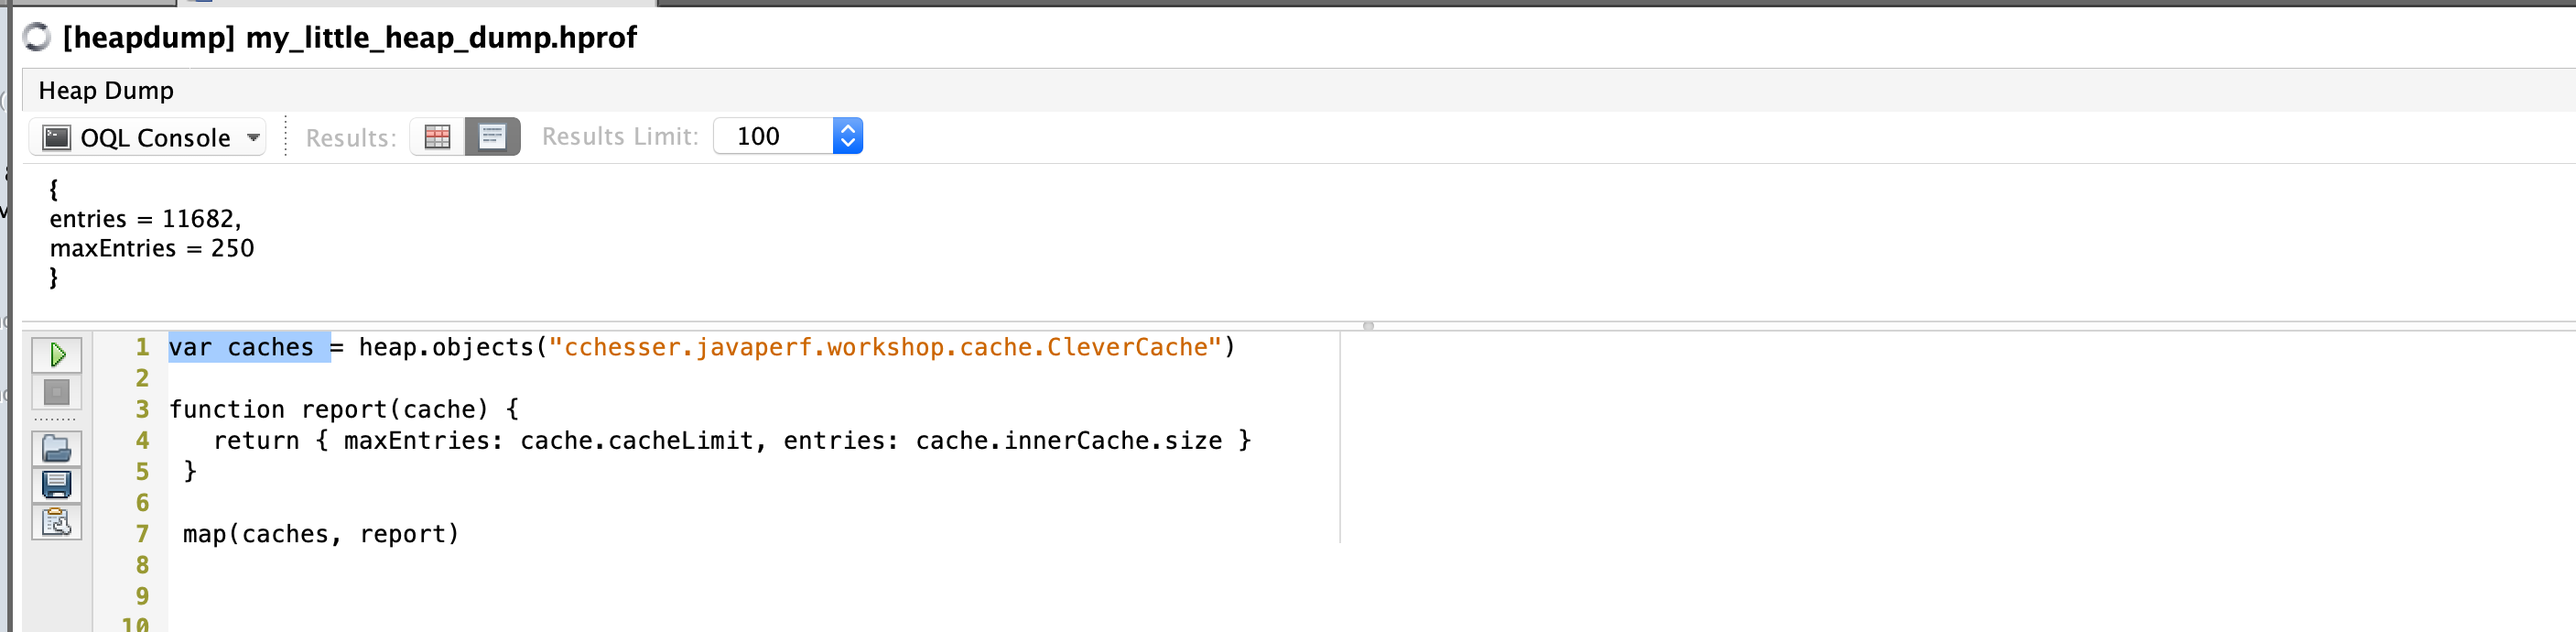
That doesn’t seem right at all, we want at most 250 items but we have about 10,000. Let’s find out why that is the case.
Memory Problem Explained
The interaction between the WorkshopResource and CleverCache happens through the /search resource.
cchesser.javaperf.workshop.WorkshopResource
@GET
@Path("/search")
@Produces(MediaType.APPLICATION_JSON)
@Timed
public Searcher.SearchResult searchConference(@QueryParam("q") String term, @QueryParam("c") String context) {
    return fetchResults(term, context);
}

private Searcher.SearchResult fetchResults(String term, String context) {

  if (context != null && !context.isEmpty()) {
      if (resultsByContext.exists(context)) {
          return resultsByContext.fetch(context);
      }
  }

// does not exist in cache, compute and store

  SearchResult results = searcher.search(term);
  resultsByContext.store(results.getResultsContext(), results);
  return results;
}
If a context is sent, the previously cached values for the search are returned, otherwise we cache those result values in case they need to be referenced again.
javaperf.workshop.cache.CleverCache
 /**
  * Stores the given key value pair in the cache
  *
  * @param key   the unique identifier associated with the given value
  * @param value the value mapped to the given key
  */
  public void store(K key, V value) {
    if (isFull()) {
        K keyToRemove = getLFUKey();
        CleverCache<K, V>.CacheEntry<V> removedEntry = innerCache.remove(keyToRemove);
    }

    CacheEntry<V> newEntry = new CacheEntry<V>();
    newEntry.data = value;
    newEntry.frequency = 0;

    innerCache.put(key, newEntry);
  }
  // other methods
  private boolean isFull() {
    return innerCache.size() == cacheLimit;
}
This interaction is NOT thread safe. Consider this scenario:
- Thread 1 invokes
storewhen theinnerCache.size()is249isFull()evaluates tofalse- Execution halts prior to
innerCache.put
- Thread 2 invokes
storewhen theinnerCache.size()is249isFull()evaluates to false- Execution halts prior to
innerCache.put
- Thread 1 resumes and executes
innerCache.put,innerCache.size()is now250 - Thread 2 resumes and executes
innerCache.put,innerCache.size()is now251 - For the lifecycle of the jvm
isFull()will no longer returntrue
Fortunately, the DropWizard documentation calls out the need to consider thread safety:
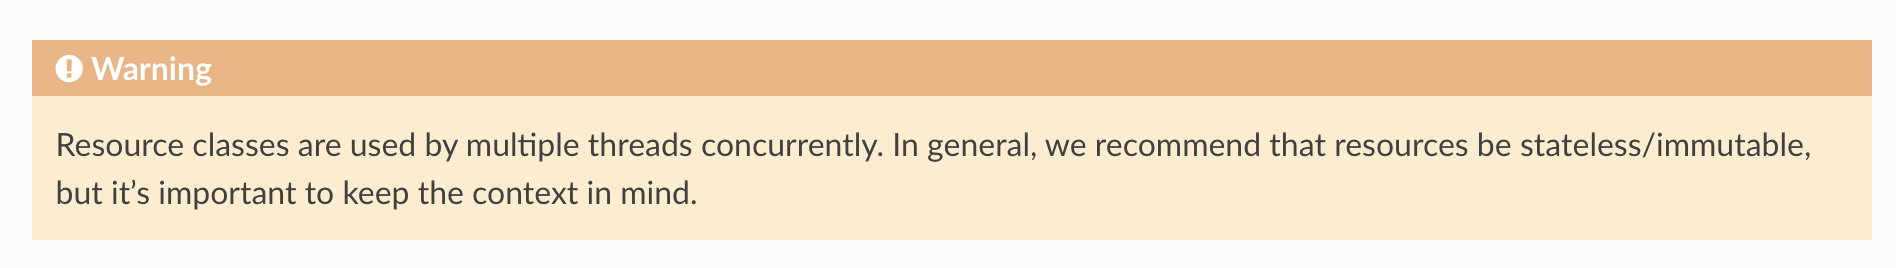
Since the WorkshopResource has a resultsByContext field that will get shared across threads, that type should be thread safe.
Potential Solutions
-
The naive solution would be to just change
isFull()to consider>=, though that might lead to ConcurrentModificationExceptions -
The proper solution would be to make the class Thread Safe
In the next section, we'll continue learn about Garbage Collection logs.
Garbage Collections5.7 - Garbage Collections
A key piece to understanding what is happening in terms of GC cycles within your service, is enabling GC logs. In this section, we are going to do some analysis on the JVM in regards to it’s garbage collection (GC) cycles.
Prerequisite
R environment (If you want to try parsing some of the logs)GC JVM Options
Here is a set of JVM options you can enable on your service and how to interpret those logs.
-XX:+PrintGCDetails: Includes more details within your GC log-XX:+PrintGCDateStamps: Have a readable date/time string to correlate events in your log. Without this option, your GC log will have elapsed time since the JVM was started. This format (which is reported) in seconds (with millisecond precision), is not easy for someone to quickly correlate when this event was logged (as you have to infer the time based on when the JVM was started).-Xloggc: Specifies the log file for the garbage collection logs (otherwise will go to stdout). 💡 Note:-verbose:gcis NOT necessary when you setXloggc(it is implied).-XX:+UseGCLogFileRotation: Support rotating your GC log file (you don’t want to let this get too big).-XX:GCLogFileSize: Size of the file for rotation (ex.10M).-XX:NumberOfGCLogFiles: Number of GC log files to maintain (ex.3). 💡 Note: if you are monitoring your log file with another solution (like splunk or logstash), you typically don’t need to be keeping an inventory of rolled files around, unless you are concerned about log forwarding failing and want to ensure a given amount is still capable of being captured from a host.
GC Log formats
With different garbage collectors in the JVM, you will get slightly different GC log formats.
Parallel GC
2015-09-30T10:57:20.215+0600: 0.847: [GC (Allocation Failure) [PSYoungGen: 65536K->10748K(76288K)] 65536K->12607K(251392K), 0.0118637 secs] [Times: user=0.03 sys=0.01, real=0.01 secs]
2015-09-30T10:57:20.556+0600: 1.188: [GC (Metadata GC Threshold) [PSYoungGen: 44312K->10748K(141824K)] 46171K->12786K(316928K), 0.0077755 secs] [Times: user=0.03 sys=0.00, real=0.01 secs]
2015-09-30T10:57:20.564+0600: 1.196: [Full GC (Metadata GC Threshold) [PSYoungGen: 10748K->0K(141824K)] [ParOldGen: 2038K->10444K(116736K)] 12786K->10444K(258560K), [Metaspace: 20976K->20976K(1067008K)], 0.0286381 secs] [Times: user=0.14 sys=0.01, real=0.03 secs]
Concurrent Mark Sweep
2015-09-30T11:11:35.994+0600: 0.838: [GC (Allocation Failure) 0.838: [ParNew: 69952K->8703K(78656K), 0.0128204 secs] 69952K->12781K(253440K), 0.0128848 secs] [Times: user=0.04 sys=0.01, real=0.01 secs]
2015-09-30T11:11:38.009+0600: 2.853: [GC (CMS Initial Mark) [1 CMS-initial-mark: 4077K(174784K)] 67493K(253440K), 0.0088311 secs] [Times: user=0.04 sys=0.00, real=0.01 secs]
2015-09-30T11:11:38.018+0600: 2.862: [CMS-concurrent-mark-start]
2015-09-30T11:11:38.018+0600: 2.862: [CMS-concurrent-mark: 0.000/0.000 secs] [Times: user=0.00 sys=0.00, real=0.00 secs]
2015-09-30T11:11:38.018+0600: 2.862: [CMS-concurrent-preclean-start]
2015-09-30T11:11:38.019+0600: 2.863: [CMS-concurrent-preclean: 0.001/0.001 secs] [Times: user=0.01 sys=0.00, real=0.00 secs]
2015-09-30T11:11:38.019+0600: 2.863: [CMS-concurrent-abortable-preclean-start]
 CMS: abort preclean due to time 2015-09-30T11:11:43.074+0600: 7.918: [CMS-concurrent-abortable-preclean: 1.233/5.055 secs] [Times: user=1.23 sys=0.01, real=5.06 secs]
2015-09-30T11:11:43.074+0600: 7.918: [GC (CMS Final Remark) [YG occupancy: 63415 K (78656 K)]7.918: [Rescan (parallel) , 0.0052614 secs]7.924: [weak refs processing, 0.0000337 secs]7.924: [class unloading, 0.0029068 secs]7.927: [scrub symbol table, 0.0025781 secs]7.929: [scrub string table, 0.0002699 secs][1 CMS-remark: 4077K(174784K)] 67493K(253440K), 0.0117740 secs] [Times: user=0.04 sys=0.01, real=0.01 secs]
2015-09-30T11:11:43.086+0600: 7.930: [CMS-concurrent-sweep-start]
2015-09-30T11:11:43.086+0600: 7.930: [CMS-concurrent-sweep: 0.000/0.000 secs] [Times: user=0.00 sys=0.00, real=0.00 secs]
2015-09-30T11:11:43.087+0600: 7.930: [CMS-concurrent-reset-start]
2015-09-30T11:11:43.110+0600: 7.954: [CMS-concurrent-reset: 0.023/0.023 secs] [Times: user=0.01 sys=0.01, real=0.03 secs]
G1
015-09-30T11:13:03.870+0600: 0.395: [GC pause (G1 Evacuation Pause) (young), 0.0052206 secs]
   [Parallel Time: 1.9 ms, GC Workers: 8]
      [GC Worker Start (ms): Min: 395.4, Avg: 395.5, Max: 395.8, Diff: 0.3]
      [Ext Root Scanning (ms): Min: 0.0, Avg: 0.3, Max: 1.1, Diff: 1.1, Sum: 2.0]
      [Update RS (ms): Min: 0.0, Avg: 0.0, Max: 0.0, Diff: 0.0, Sum: 0.0]
         [Processed Buffers: Min: 0, Avg: 0.0, Max: 0, Diff: 0, Sum: 0]
      [Scan RS (ms): Min: 0.0, Avg: 0.0, Max: 0.0, Diff: 0.0, Sum: 0.1]
      [Code Root Scanning (ms): Min: 0.0, Avg: 0.1, Max: 0.4, Diff: 0.4, Sum: 0.5]
      [Object Copy (ms): Min: 0.7, Avg: 1.4, Max: 1.6, Diff: 0.9, Sum: 11.4]
      [Termination (ms): Min: 0.0, Avg: 0.0, Max: 0.0, Diff: 0.0, Sum: 0.1]
      [GC Worker Other (ms): Min: 0.0, Avg: 0.0, Max: 0.0, Diff: 0.0, Sum: 0.1]
      [GC Worker Total (ms): Min: 1.5, Avg: 1.8, Max: 1.8, Diff: 0.3, Sum: 14.2]
      [GC Worker End (ms): Min: 397.3, Avg: 397.3, Max: 397.3, Diff: 0.0]
   [Code Root Fixup: 0.1 ms]
   [Code Root Purge: 0.1 ms]
   [Clear CT: 0.1 ms]
   [Other: 3.0 ms]
      [Choose CSet: 0.0 ms]
      [Ref Proc: 2.7 ms]
      [Ref Enq: 0.0 ms]
      [Redirty Cards: 0.2 ms]
      [Humongous Reclaim: 0.0 ms]
      [Free CSet: 0.0 ms]
   [Eden: 24.0M(24.0M)->0.0B(39.0M) Survivors: 0.0B->3072.0K Heap: 24.0M(256.0M)->5754.5K(256.0M)]
 [Times: user=0.02 sys=0.01, real=0.00 secs]
2015-09-30T11:13:04.343+0600: 0.868: [GC pause (G1 Evacuation Pause) (young), 0.0082908 secs]
   [Parallel Time: 5.1 ms, GC Workers: 8]
      [GC Worker Start (ms): Min: 868.3, Avg: 868.4, Max: 868.8, Diff: 0.5]
      [Ext Root Scanning (ms): Min: 0.0, Avg: 0.3, Max: 1.7, Diff: 1.7, Sum: 2.7]
      [Update RS (ms): Min: 0.0, Avg: 0.1, Max: 0.2, Diff: 0.2, Sum: 0.5]
         [Processed Buffers: Min: 0, Avg: 0.4, Max: 1, Diff: 1, Sum: 3]
      [Scan RS (ms): Min: 0.0, Avg: 0.0, Max: 0.0, Diff: 0.0, Sum: 0.1]
      [Code Root Scanning (ms): Min: 0.0, Avg: 0.4, Max: 1.4, Diff: 1.4, Sum: 3.5]
      [Object Copy (ms): Min: 3.2, Avg: 4.0, Max: 4.6, Diff: 1.4, Sum: 32.1]
      [Termination (ms): Min: 0.0, Avg: 0.1, Max: 0.1, Diff: 0.1, Sum: 0.6]
      [GC Worker Other (ms): Min: 0.0, Avg: 0.0, Max: 0.0, Diff: 0.0, Sum: 0.1]
      [GC Worker Total (ms): Min: 4.6, Avg: 4.9, Max: 5.0, Diff: 0.5, Sum: 39.5]
      [GC Worker End (ms): Min: 873.3, Avg: 873.3, Max: 873.4, Diff: 0.0]
   [Code Root Fixup: 0.3 ms]
   [Code Root Purge: 0.1 ms]
   [Clear CT: 0.1 ms]
   [Other: 2.7 ms]
      [Choose CSet: 0.0 ms]
      [Ref Proc: 2.4 ms]
      [Ref Enq: 0.0 ms]
      [Redirty Cards: 0.1 ms]
      [Humongous Reclaim: 0.0 ms]
      [Free CSet: 0.1 ms]
   [Eden: 39.0M(39.0M)->0.0B(147.0M) Survivors: 3072.0K->6144.0K Heap: 44.6M(256.0M)->13.9M(256.0M)]
 [Times: user=0.04 sys=0.00, real=0.01 secs]
2015-09-30T11:13:04.650+0600: 1.176: [GC pause (Metadata GC Threshold) (young) (initial-mark), 0.0090083 secs]
   [Parallel Time: 5.5 ms, GC Workers: 8]
      [GC Worker Start (ms): Min: 1175.9, Avg: 1176.0, Max: 1176.0, Diff: 0.1]
      [Ext Root Scanning (ms): Min: 1.1, Avg: 1.2, Max: 1.4, Diff: 0.3, Sum: 9.4]
      [Update RS (ms): Min: 0.0, Avg: 0.1, Max: 0.2, Diff: 0.2, Sum: 1.2]
         [Processed Buffers: Min: 0, Avg: 1.1, Max: 2, Diff: 2, Sum: 9]
      [Scan RS (ms): Min: 0.1, Avg: 0.1, Max: 0.3, Diff: 0.2, Sum: 1.1]
      [Code Root Scanning (ms): Min: 0.0, Avg: 0.2, Max: 0.5, Diff: 0.5, Sum: 2.0]
      [Object Copy (ms): Min: 3.4, Avg: 3.7, Max: 3.8, Diff: 0.4, Sum: 29.3]
      [Termination (ms): Min: 0.0, Avg: 0.0, Max: 0.0, Diff: 0.0, Sum: 0.0]
      [GC Worker Other (ms): Min: 0.0, Avg: 0.0, Max: 0.0, Diff: 0.0, Sum: 0.2]
      [GC Worker Total (ms): Min: 5.4, Avg: 5.4, Max: 5.5, Diff: 0.1, Sum: 43.3]
      [GC Worker End (ms): Min: 1181.4, Avg: 1181.4, Max: 1181.4, Diff: 0.0]
   [Code Root Fixup: 0.3 ms]
   [Code Root Purge: 0.0 ms]
   [Clear CT: 0.1 ms]
   [Other: 3.0 ms]
      [Choose CSet: 0.0 ms]
      [Ref Proc: 2.7 ms]
      [Ref Enq: 0.0 ms]
      [Redirty Cards: 0.1 ms]
      [Humongous Reclaim: 0.0 ms]
      [Free CSet: 0.1 ms]
   [Eden: 33.0M(147.0M)->0.0B(140.0M) Survivors: 6144.0K->13.0M Heap: 46.9M(256.0M)->20.9M(256.0M)]
 [Times: user=0.04 sys=0.00, real=0.01 secs]
2015-09-30T11:13:04.660+0600: 1.185: [GC concurrent-root-region-scan-start]
2015-09-30T11:13:04.664+0600: 1.190: [GC concurrent-root-region-scan-end, 0.0046509 secs]
2015-09-30T11:13:04.664+0600: 1.190: [GC concurrent-mark-start]
2015-09-30T11:13:04.665+0600: 1.190: [GC concurrent-mark-end, 0.0007287 secs]
2015-09-30T11:13:04.665+0600: 1.190: [GC remark 1.190: [Finalize Marking, 0.0001736 secs] 1.191: [GC ref-proc, 0.0000411 secs] 1.191: [Unloading, 0.0016740 secs], 0.0020377 secs]
 [Times: user=0.01 sys=0.00, real=0.00 secs]
2015-09-30T11:13:04.667+0600: 1.193: [GC cleanup 21M->14M(256M), 0.0004254 secs]
 [Times: user=0.01 sys=0.00, real=0.00 secs]
Type of Collections
A simple rule to watch for on your logs is the prefix of either:
[GC ...      <- Minor GC cycle (young gen)
[Full GC ... <- Full GC cycle
(:exclamation:) Explicit GCs can also be identified, which is when something is invoking the System.gc() API. Note, this is not good thing, as
something is forcing a GC cycle to occur, rather than letting the JVM trigger this on its own (what should naturally occur).
2015-09-30T12:23:44.425+0600: 195.699: [GC (System.gc()) [PSYoungGen: 39223K->3562K(76288K)] 49685K->14032K(190464K), 0.0047880 secs] [Times: user=0.02 sys=0.00, real=0.01 secs]
2015-09-30T12:23:44.430+0600: 195.704: [Full GC (System.gc()) [PSYoungGen: 3562K->0K(76288K)] [ParOldGen: 10469K->9174K(114176K)] 14032K->9174K(190464K), [Metaspace: 25137K->25137K(1071104K)], 0.0724521 secs] [Times: user=0.38 sys=0.01, real=0.07 secs]
It is generally recommended to use the -XX:+DisableExplicitGC JVM option to disable forceful GC events. This will allow
the JVM to still have garbage collections, but it disables them from being triggered explicitly. The description of this option:
By default calls to System.gc() are enabled (-XX:-DisableExplicitGC). Use -XX:+DisableExplicitGC to disable calls to System.gc(). Note that the JVM still performs garbage collection when necessary.
Gathering GC Logs
Enabling logs
With our service, let’s go ahead and start it up with GC logging enabled:
# Navigate to the root directory of this project
java -XX:+PrintGCDetails -XX:+PrintGCDateStamps -Xloggc:gc.log -XX:GCLogFileSize=5M -XX:NumberOfGCLogFiles=2 \
 -jar java-perf-workshop-server/target/java-perf-workshop-server-1.1.0-SNAPSHOT.jar server server.yml
Enabling while JVM is running
In higher versions of the JDK (9+), you can enable GC logging without having to restart the JVM (reference: Thomas Darimont):
Parsing the log
For parsing the logs, we are just going to show a simple approach using R to parse the
gc.log that we created. To do this, we will use the stringr package.
# Including stringr package for regex
library(stringr)

# Navigating to where the project is at on my filesystem
setwd("~/java-perf-workshop")

# Read the GC log file in
gc <- readLines("gc.log")

# Regex the matches
matches <- str_match(gc, "(\\d+)K->(\\d+)K\\((\\d+)K\\),\\s(\\d+.\\d+)\\ssecs.*\\[Times\\: user=(\\d+.\\d+) sys=(\\d+.\\d+), real=(\\d+.\\d+) secs")

# Look at what matches, now we want to filter out the NA
matches

# Filter content out and convert to a data frame
gc.df <- data.frame(na.omit(matches[,-1]), stringsAsFactors=FALSE)

# Add a column header to describe fields
colnames(gc.df) <- c("HeapUsedBeforeGC_KB","HeapUsedAfterGC_KB", "HeapCapacity_KB", "GCPauseTime_Sec", "GCUserTime_Sec", "GCSysTime_Sec", "GCRealTime_Sec")

# List out the contents of the data frame
gc.df
Example output:
  HeapUsedBeforeGC_KB HeapUsedAfterGC_KB HeapCapacity_KB GCPauseTime_Sec GCUserTime_Sec GCSysTime_Sec GCRealTime_Sec
1               65536              12554          251392       0.0091645           0.03          0.01           0.01
2               45883              12707          316928       0.0092271           0.03          0.01           0.01
Reminder on the types of time being collected:
GCUserTime_Sec: User space timeGCSysTime_Sec: Kernel space time (operating system)GCRealTime_Sec: Complete time taken
Notice that the GCRealTime_Sec should closely align with the GCPauseTime_Sec value (just rounded up). If you notice that the
GCUserTime_Sec is much larger than the GCRealTime_Sec, you can conclude that multiple threads are executing garbage collection,
as GCUserTime_Sec is just the sum time of all the threads.
External Tools
GC Easy
There’s an existing tool GC Easy which will do GC log parsing and analysis as well.
6 - Containers
6.1 - Setup
In this section we’re going to spin up the containers needed for the workshop.
Note
- Make sure you’ve gone through the Prerequisites.
- Make sure your Docker daemon is running.
- If this is the first time you’re using docker, we recommend going through Orientation and Setup to quickly learn a few concepts.
Building
The maven project uses the fabric8.io/docker-maven-plugin to create two images:
workshop-server- the docker image for the workshop serviceworkshop-wiremock- the docker image for the wiremock service
Run mvn clean package -Pdocker , the docker profile enables the docker-maven-plugin.
You can view the generated images with docker image ls | grep workshop:
$ docker image ls | grep workshop
workshop-wiremock                                                             1.1.0-SNAPSHOT                 2cc43b2348c8   2 minutes ago   657MB
workshop-wiremock                                                             latest                         2cc43b2348c8   2 minutes ago   657MB
workshop-server                                                               1.1.0-SNAPSHOT                 be7cfbd0735a   2 minutes ago   659MB
workshop-server                                                               latest                         be7cfbd0735a   2 minutes ago   659MB
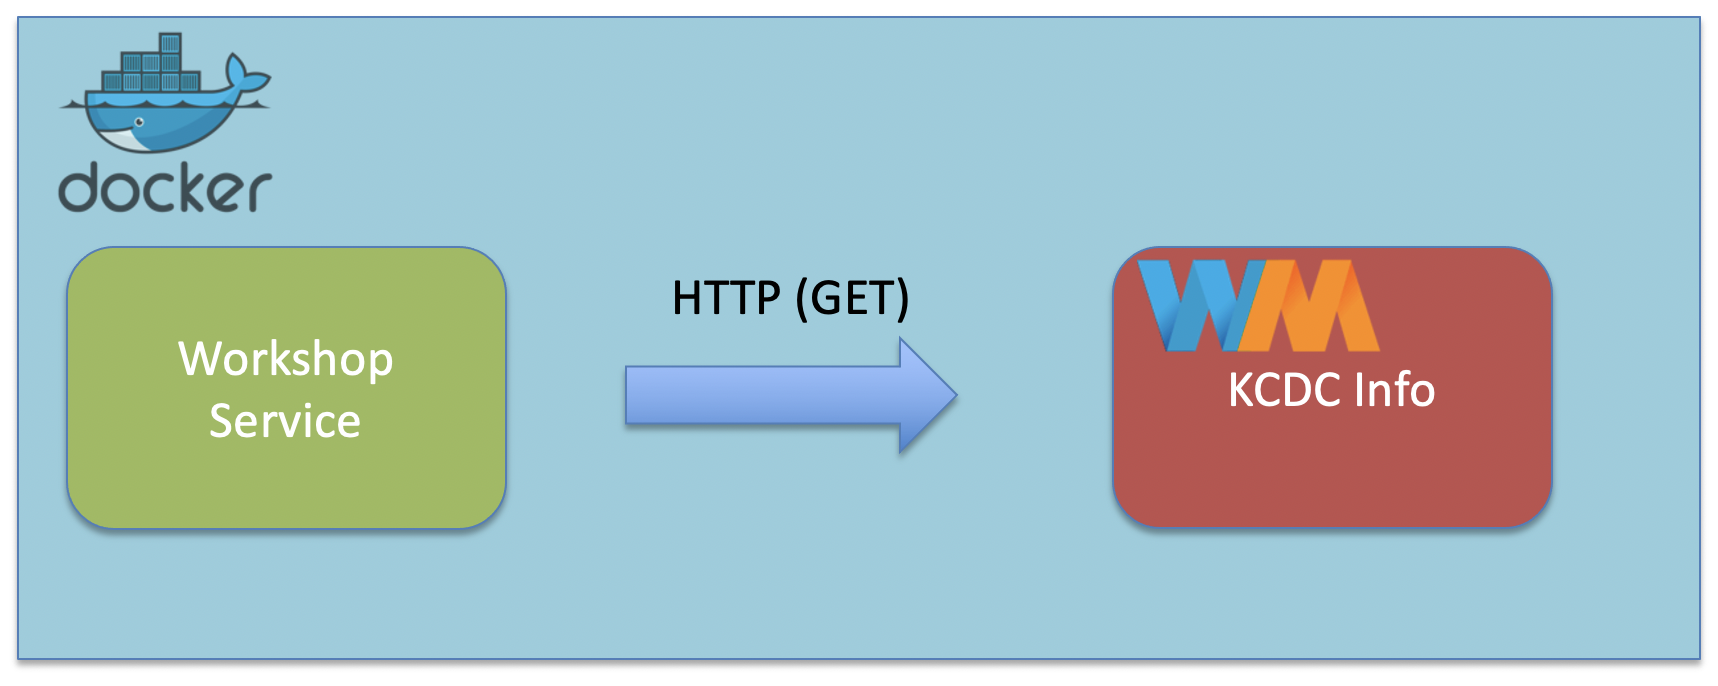
Running
Since our Workshop Service depends on the Wiremock Service, we’re going to use docker-compose to create a docker environment with both our services ready to go:
Within the java-perf-workshop directory, run docker-compose up:
$ docker-compose up
Creating network "java-perf-workshop_default" with the default driver
Creating java-perf-workshop_wiremock_1 ... done
Creating java-perf-workshop_server_1   ... done
Attaching to java-perf-workshop_wiremock_1, java-perf-workshop_server_1
...
wiremock_1  | port:                         8080
wiremock_1  | enable-browser-proxying:      false
wiremock_1  | disable-banner:               false
wiremock_1  | no-request-journal:           false
wiremock_1  | verbose:                      false
wiremock_1  |
...
server_1    | INFO  [2021-03-14 18:59:06,883] org.eclipse.jetty.server.AbstractConnector: Started application@4c777e7b{HTTP/1.1,[http/1.1]}{0.0.0.0:8080}
server_1    | INFO  [2021-03-14 18:59:06,892] org.eclipse.jetty.server.AbstractConnector: Started admin@5f038248{HTTP/1.1,[http/1.1]}{0.0.0.0:8081}
server_1    | INFO  [2021-03-14 18:59:06,892] org.eclipse.jetty.server.Server: Started @4358ms
In another terminal, you can check the status of the containers by running docker ps:
$ docker ps
CONTAINER ID   IMAGE                      COMMAND                  CREATED          STATUS          PORTS                              NAMES
c9aeb5375f79   workshop-server:latest     "/bin/sh -c 'java -j…"   52 seconds ago   Up 50 seconds   0.0.0.0:8080-8081->8080-8081/tcp   java-perf-workshop_server_1
6b1522e7acb9   workshop-wiremock:latest   "/bin/sh -c 'java -j…"   52 seconds ago   Up 51 seconds                                      java-perf-workshop_wiremock_1
Our workshop service container is exposing port 8080 and mapping it into the container’s 8080. Verify that your setup is working by visiting: http://localhost:8080/search?q=docker.
In the next section, we'll learn how to enable Java Monitoring Tooling to work with containers.
Java Monitoring Tooling6.2 - Java Monitoring Tooling
In this section we’re going to configure our container to enable remote tooling.
Note
- Make sure you’ve gone through the Prerequisites.
- Make sure your Docker daemon is running.
- If this is the first time you’re using docker, we recommend going through Orientation and Setup to quickly learn a few concepts.
Remote Monitoring
In previous sections of the workshop, we ran all our tooling without any configuration. In previous versions of Java you would have had to configure things even for local monitoring, this is no longer the case with Java 6+:
Any application that is started on the Java SE 6 platform will support the Attach API, and so will automatically be made available for local monitoring and management when needed.
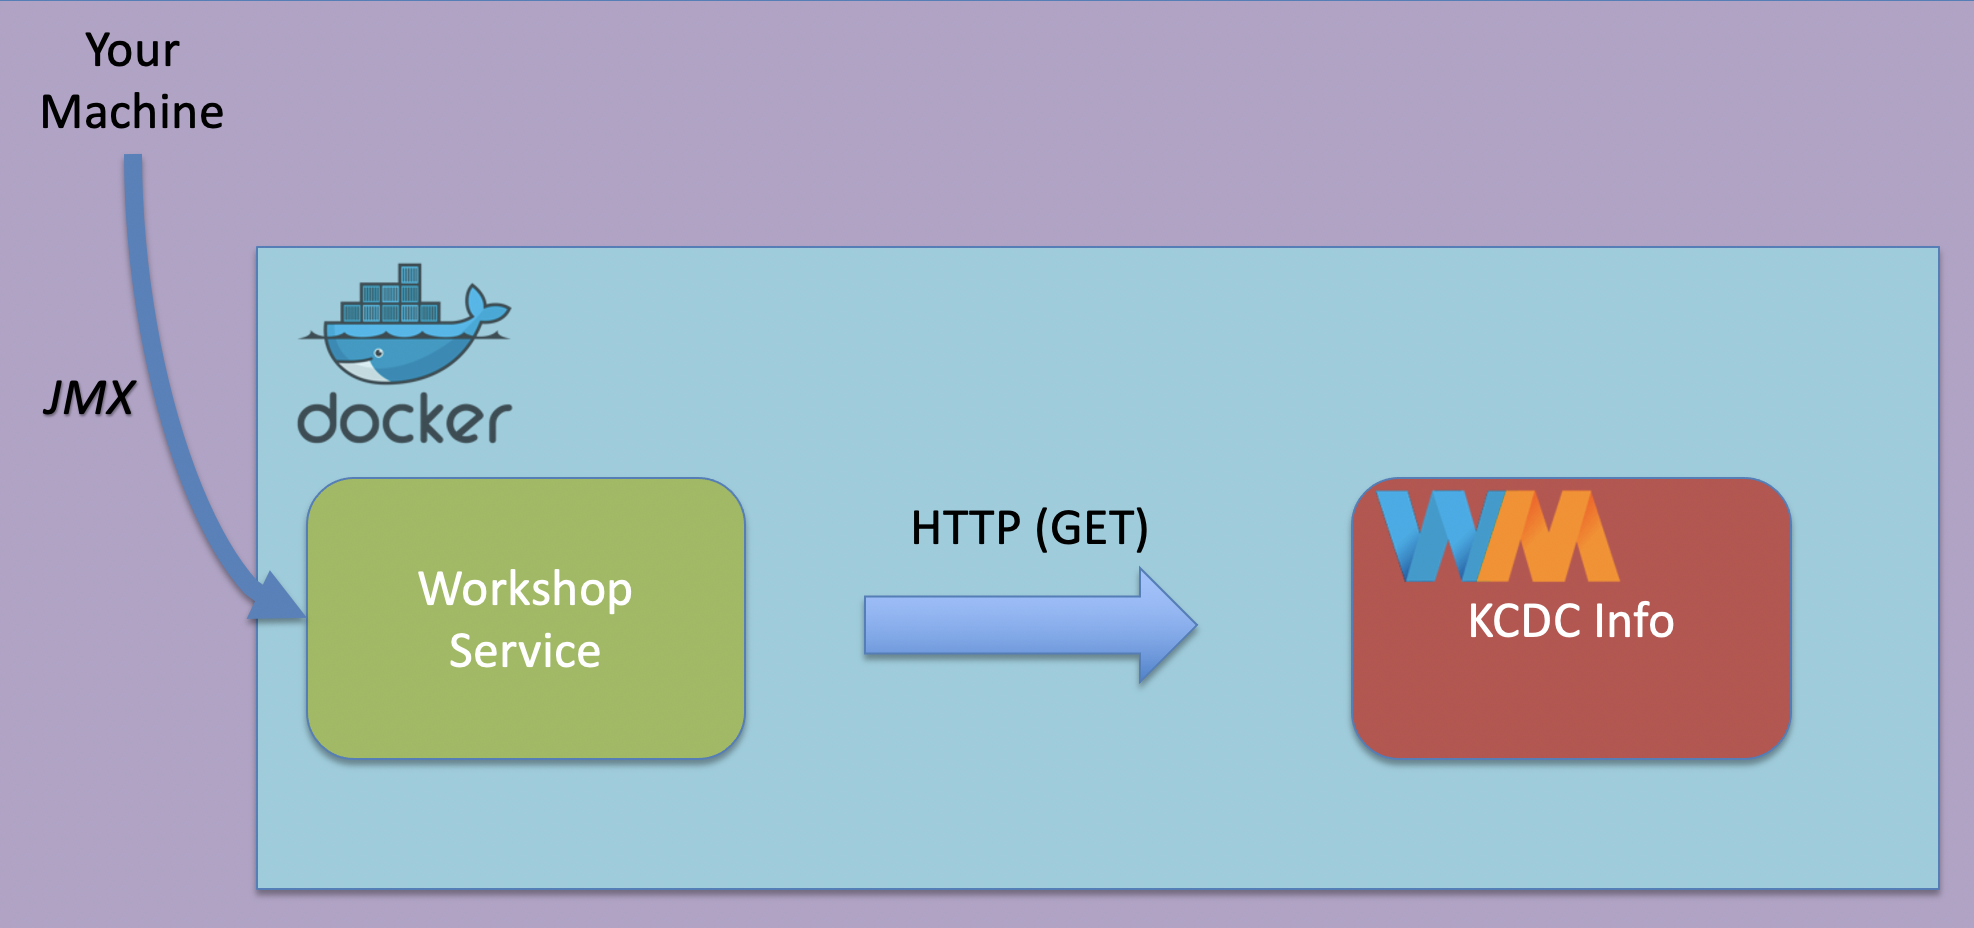
Since the docker-compose network and containers are ran separate from our host (consider them a different machine), we need to enable remote monitoring and management.
Properties
We’ll set the following properties as a JAVA_OPTS environment variable when we start our workshop server container:
- The
JMX remote portto8082:-Dcom.sun.management.jmxremote.port=8082 - The RMI registry port also set to
8082:-Dcom.sun.management.jmxremote.rmi.port=8082 - Disabling for both the registry and jmx:
-Dcom.sun.management.jmxremote.registry.ssl=falseand-Dcom.sun.management.jmxremote.ssl=false - Accept connections not from localhost:
-Dcom.sun.management.jmxremote.local.only=false- Since the machine we are connecting from will not be in the container network, we need to allow non localhost connections.
- The host name for the RMI server will be set to
127.0.0.1. The default value for this will be the container’s IP address, which we are overriding.
Set these values as an environment property on your workshop container:
...
  server:
    image: workshop-server:latest
    environment:
      JAVA_OPTS: "
        -Dcom.sun.management.jmxremote.port=8082
        -Dcom.sun.management.jmxremote.rmi.port=8082
        -Dcom.sun.management.jmxremote.registry.ssl=false
        -Dcom.sun.management.jmxremote.authenticate=false
        -Dcom.sun.management.jmxremote.ssl=false
        -Dcom.sun.management.jmxremote.local.only=false
        -Djava.rmi.server.hostname=127.0.0.1
      "
...
Test Our Setup
Spin up your services again with docker-compose up. Once the services are started, use docker ps to check the open ports on the workshop server. Notice that 8082 is now mapped as well.
$ docker ps
CONTAINER ID   IMAGE                      COMMAND                  CREATED          STATUS          PORTS                              NAMES
44d4a1ebedef   workshop-server:latest     "/bin/sh -c 'java $J…"   39 seconds ago   Up 37 seconds   0.0.0.0:8080-8082->8080-8082/tcp   java-perf-workshop_server_1
JDK Mission Control
We’ll use JDK Mission Control to create a JMX Connection.
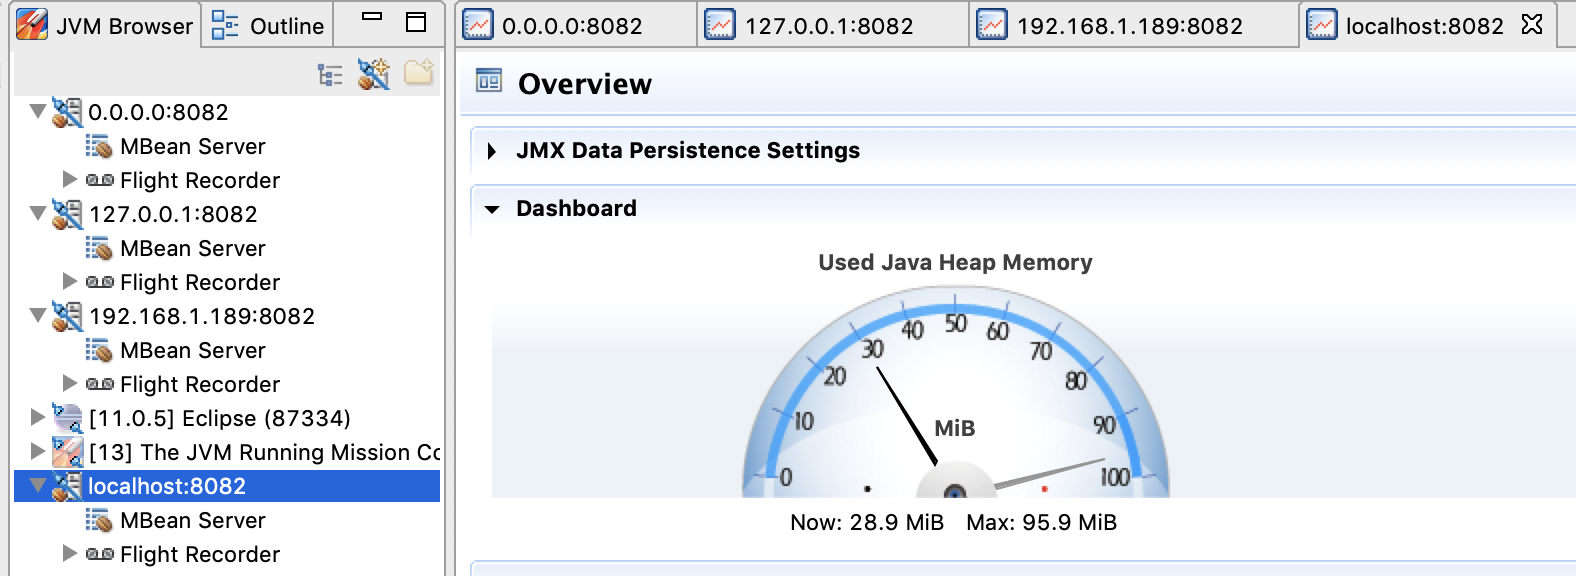
Open JDK Mission Control. Notice that the JVM Browser no longer shows the two services (since they no longer are running on the local host):
![]()
Create a new JMX Connection using 0.0.0.0 and 8082 as the host and port:
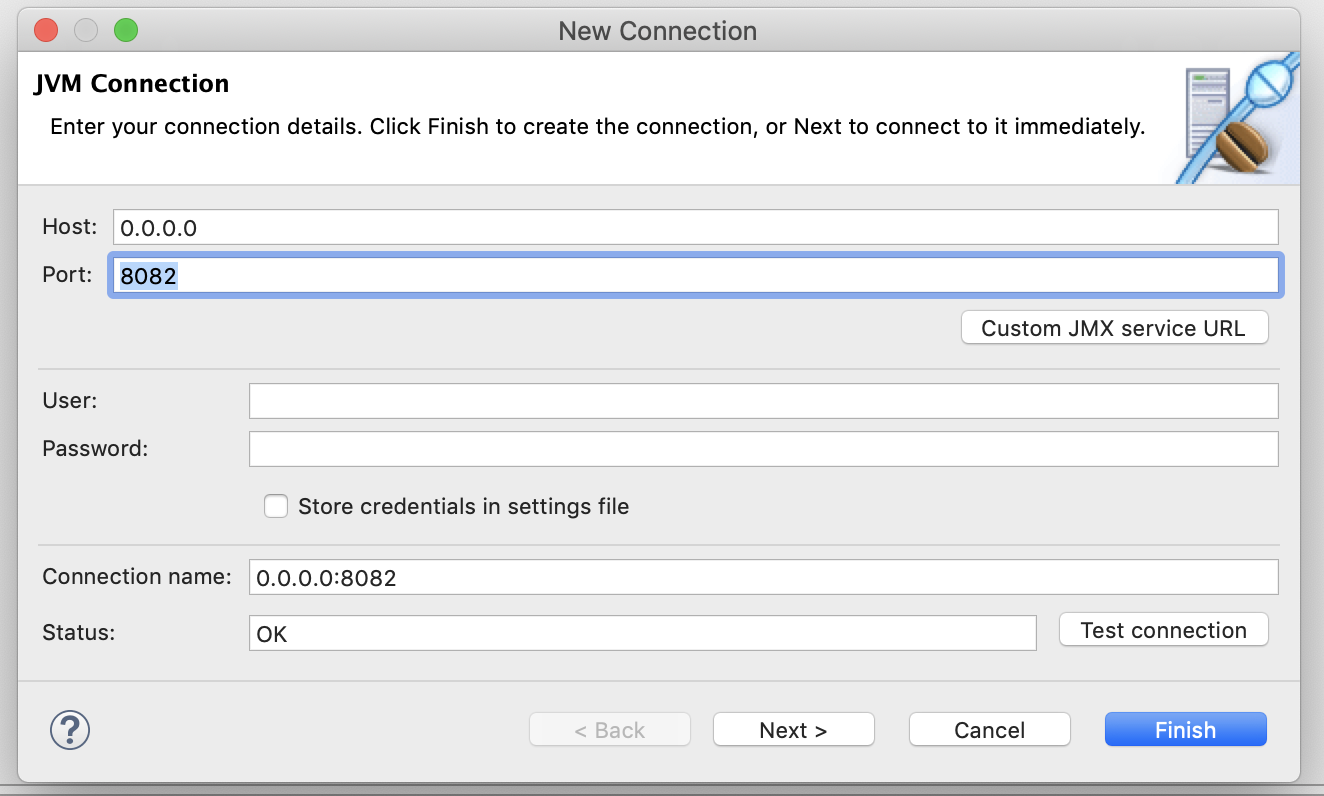
With our setup, we can connect with other addresses as well:
127.0.0.1localhost(since we are exposing port 8082 on the container as port 8082 on the local host)- Our wifi/ethernet IP address, which you can find under the
en0interface usingifconfig/ipconfig:$ ifconfig ... en0: flags=8863<UP,BROADCAST,SMART,RUNNING,SIMPLEX,MULTICAST> mtu 1500 ether 8c:85:90:ba:52:10 inet6 fe80::1862:95fe:55e7:284e%en0 prefixlen 64 secured scopeid 0x9 inet 192.168.1.189 netmask 0xffffff00 broadcast 192.168.1.255 ...
In the next section, we'll learn about some Docker tooling.
Docker Tooling6.3 - Docker Tooling
In the next section, X
References